Transcription
Applied Fluid Mechanics1. The Nature of Fluid and theStudy of Fluid Mechanics2. Viscosity of Fluid3. Pressure Measurement4. Forces Due to Static Fluid5. Buoyancy and Stability6. Flow of Fluid and Bernoulli’s Equation7. General Energy Equation8. Reynolds Number, Laminar Flow, TurbulentFlow and Energy Losses Due to Frictionã2005 Pearson Education South Asia Pte Ltd
Applied Fluid Mechanics9. Velocity Profiles for CircularSections and Flow inNoncircular Sections10.Minor Losses11.Series Pipeline Systems12.Parallel Pipeline Systems13.Pump Selection and Application14.Open-Channel Flow15.Flow Measurement16.Forces Due to Fluids in Motionã2005 Pearson Education South Asia Pte Ltd
Applied Fluid Mechanics17.Drag and Lift18.Fans, Blowers, Compressorsand the Flow of Gases19.Flow of Air in Ductsã2005 Pearson Education South Asia Pte Ltd
19. Flow of Air in DuctsChapter Objectives Describe the basic elements of an air distributionsystem that may be used for heating, ventilation, orair conditioning.Determine energy losses in ducts, consideringstraight sections and fittings.Determine the circular equivalent diameters ofrectangular ducts.Analyze and design ductwork to carry air to spacesneeding conditioning and to achieve balance in thesystem.Identify the fan selection requirements for thesystem.ã2005 Pearson Education South Asia Pte Ltd
19. Flow of Air in DuctsChapter Outline1. Introductory Concepts2. Energy Losses in Ducts3. Duct Design4. Energy Efficiency and Practical Considerations inDuct Designã2005 Pearson Education South Asia Pte Ltd
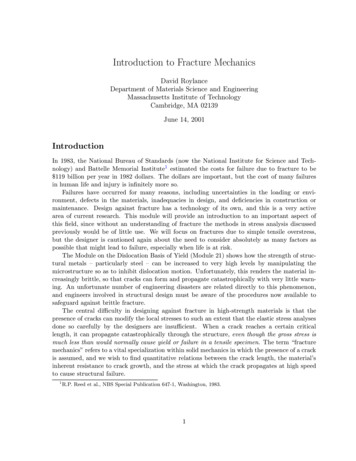
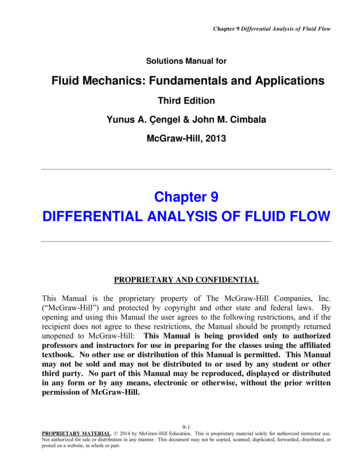
19. Flow of Air in Ducts19.1 Introductory ConceptsAn Example Air Distribution System Figure 19.1 is a sketch of the layout of an air distributionsystem. Outside air enters the building at point 1 through louversthat protect the ductwork from wind and rain. The velocity of the air flow through the louvers should berelatively low, approximately 2.5 m/s (500 ft/min), tominimize entrainment of undesirable contaminants. The duct then reduces to a smaller size to deliver the airto the suction side of a fan. A sudden contraction of the duct is shown, although amore gradual reduction would have a lower pressure loss.ã2005 Pearson Education South Asia Pte Ltd
19. Flow of Air in Ducts19.1 Introductory Conceptsã2005 Pearson Education South Asia Pte Ltd
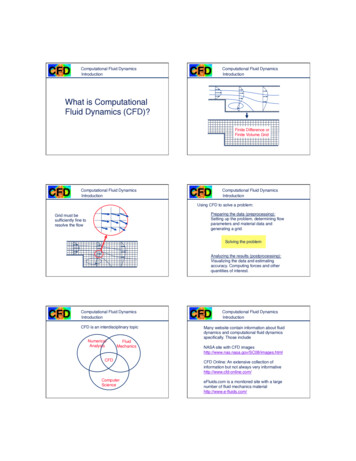
19. Flow of Air in Ducts19.2 Energy Losses in Ducts Two kinds of energy losses in duct systemscause the pressure to drop along the flow path.Friction losses occur as the air flows throughstraight sections, whereas dynamic losses occuras the air flows through such fittings as tees andwyes and through flow control devices.The units used for the various quantities and theassumed conditions are summarized in Table19.1.ã2005 Pearson Education South Asia Pte Ltd
19. Flow of Air in Ducts19.2 Energy Losses in Ductsã2005 Pearson Education South Asia Pte Ltd
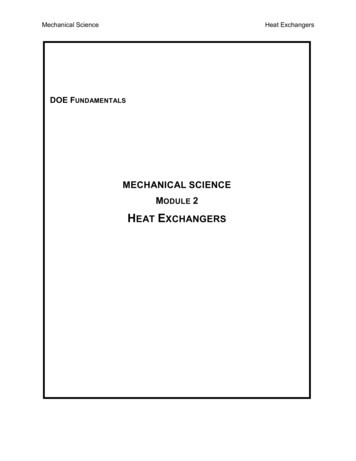
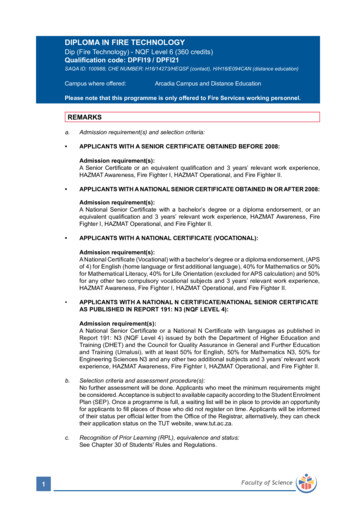
19. Flow of Air in Ducts19.2 Energy Losses in Ducts Figures 19.2 and 19.3 show friction loss hL as afunction of volume flow rate, with two sets ofdiagonal lines showing the diameter of circularducts and the velocity of flow.The total energy loss for a given duct length L iscalled HL and is found fromã2005 Pearson Education South Asia Pte Ltd
19. Flow of Air in Ducts19.2 Energy Losses in Ductsã2005 Pearson Education South Asia Pte Ltd
19. Flow of Air in Ducts19.2 Energy Losses in Ductsã2005 Pearson Education South Asia Pte Ltd
19. Flow of Air in Ducts19.2.1 Rectangular Ducts When the necessary substitutions of the hydraulicradius for the diameter are made in relationshipsfor velocity, Reynolds number, relativeroughness, and the corresponding friction factor,we see that the equivalent diameter for arectangular duct iswhere a and b are sides of the rectangle.ã2005 Pearson Education South Asia Pte Ltd
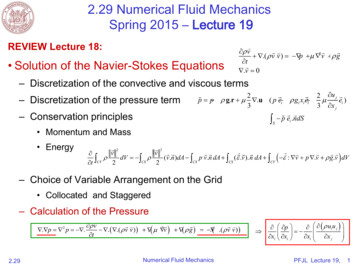
19. Flow of Air in Ducts19.2.2 Flat Oval Ducts Another popular shape for air ducts is the flat ovalshown in Fig. 19.4. The cross-sectional area is the sum of a rectangleand a circle, found fromwhere a is the length of the minor axis of the ductand b is the length of the major axis.ã2005 Pearson Education South Asia Pte Ltd
19. Flow of Air in Ducts19.2.2 Flat Oval Ducts The equivalent diameter of a circular duct isneeded to use Figs. 19.2 and 19.3 to determinefriction loss:where WP is the wetted perimeter as defined inChapter 9, found from Table 19.3 shows some examples of the circularequivalent diameters for flat oval ducts.ã2005 Pearson Education South Asia Pte Ltd
19. Flow of Air in Ducts19.2.2 Flat Oval Ductsã2005 Pearson Education South Asia Pte Ltd
19. Flow of Air in DuctsExample 19.1Determine the velocity of flow and the amount of frictionloss that would occur as air flows at 1.42 m3/s through24.4 m of circular duct having a diameter of 0.6 m(22 in).We can use Fig. 19.3 to determine that the velocity isapproximately 5.8 m/s and that the friction loss Pa/m ofduct (hL) is 0.61 Pa/m. Then, by proportion, the loss for24.4 m isã2005 Pearson Education South Asia Pte Ltd
19. Flow of Air in DuctsExample 19.2Specify the dimensions of a rectangular duct that wouldhave the same friction loss as the circular duct describedin Example Problem 19.1.From Table 19.2 we can specify a 0.36-by-0.76 m (14by-30-in) rectangular duct that would have the same lossas the 0.56-m (22.0-in) diameter circular duct. Othersthat will have approximately the same loss are 0.4-by0.7 m (16-by-26-in), 0.46-by-0.56 m (18-by- 22-in), and0.51-by-0.51 m (20-by-20-in) rectangular ducts. Such alist gives the designer many options when fitting a ductsystem into given spaces.ã2005 Pearson Education South Asia Pte Ltd
19. Flow of Air in DuctsExample 19.3Specify the dimensions of a flat oval duct that wouldhave approximately the same friction loss as the circularduct described in Example Problem 19.1.From Table 19.3 we can specify a 0.41-by-0.71 m (16by-28-in) flat oval duct that would have approximatelythe same friction loss as a 0.56-m (22.0-in) diametercircular duct. Others with approximately the same lossare 0.46-by-0.66 m (18-by-26-in) and 0.51-by-0.61 m(20-by-24-in) flat oval ducts.ã2005 Pearson Education South Asia Pte Ltd
19. Flow of Air in Ducts19.2.2 Flat Oval Ducts Dynamic losses can be estimated by usingpublished data for loss coefficients for air flowingthrough certain fittings.The dynamic loss for a fitting is calculated fromwhere C is the loss coefficient from Table 19.4and Hv is the velocity pressure or velocity head.ã2005 Pearson Education South Asia Pte Ltd
19. Flow of Air in Ducts19.2.2 Flat Oval Ductsã2005 Pearson Education South Asia Pte Ltd
19. Flow of Air in Ducts19.2.2 Flat Oval Ducts In U.S. Customary System units, pressure levelsand losses are typically expressed in inches ofwater, which is actually a measure of pressurehead. Then,where γa is the specific weight of air, v is the flowvelocity, and γw is the specific weight of water.ã2005 Pearson Education South Asia Pte Ltd
19. Flow of Air in Ducts19.2.2 Flat Oval Ducts When the velocity is expressed in feet per minuteand the conditions of standard air are used, Eq.(19–6) reduces to When we use SI units, pressure levels and lossesare measured in the pressure unit of Pa. Then,ã2005 Pearson Education South Asia Pte Ltd
19. Flow of Air in Ducts19.2.2 Flat Oval Ducts When the velocity is expressed in m/s and theconditions of standard air are used, Eq. (19–8)reduces toã2005 Pearson Education South Asia Pte Ltd
19. Flow of Air in DuctsExample 19.4Estimate the pressure drop that occurs when 1.42 m3/sof air flows around a smooth, rectangular, 90 elbow withside dimensions of 0.36 x 0.61 m (14 x 24 in).Use Table 19.2 to find that the equivalent diameter forthe duct is 500 mm (19.9 in.). From Fig. 19.3 we find thevelocity of flow to be 7.1 m/s. Then, using Eq. (19–9), wecomputeã2005 Pearson Education South Asia Pte Ltd
19. Flow of Air in DuctsExample 19.4From Table 19.4, we find C 0.18. Then the pressuredrop isã2005 Pearson Education South Asia Pte Ltd
19. Flow of Air in Ducts19.3 Duct Design The goals of the design process are to specifyreasonable dimensions for the various sections ofthe ductwork, to estimate the air pressure at keypoints, to determine the requirements to be metby the fan in the system, and to balance thesystem.Balance requires that the pressure drop from thefan outlet to each outlet grille is the same whenthe duct sections are carrying their designcapacities.ã2005 Pearson Education South Asia Pte Ltd
19. Flow of Air in Ducts19.3 Duct Design 1.2.3.4.Several different techniques are used by airdistribution designers, such as the following:Equal-friction methodStatic regain methodT-MethodIndustrial exhaust systems for vapors andparticulatesã2005 Pearson Education South Asia Pte Ltd
19. Flow of Air in Ducts19.3 Duct Design 1.2.3.Space limitations in the design of large office buildingsand certain industrial applications make “high-velocitysystems” attractive.The name comes from the practice of using smaller ductsto carry a given flow rate.However, several consequences arise:Noise is usually a factor, and special noise-attenuationdevices must be employed.Duct construction must be more substantial, and sealing ismore critical.Operating costs are generally higher because of greaterpressure drops and higher fan total pressures.ã2005 Pearson Education South Asia Pte Ltd
19. Flow of Air in Ducts19.3 Duct Design 1.a)b)c)d)e)Below is the general procedure for designing air ductsusing the equal-friction method:Generate a proposed layout of the air distribution system:Determine the air flow desired into each conditionedspace (cfm or m3/s).Specify the location of the fan.Specify the location of the outside air supply inlet.Propose the layout of the ductwork for the intake duct.Propose the layout of the air delivery system to eachspace including fittings such as tees, elbows, dampers,and grilles. Dampers should be included in the final run toeach delivery grille to facilitate final balance of the system.ã2005 Pearson Education South Asia Pte Ltd
19. Flow of Air in Ducts19.3 Duct Design2. For the intake duct and the fan outlet duct,determine the total airflow requirement as thesum of all of the air flows delivered to conditionedspaces.3. Use Fig. 19.2 or Fig. 19.3 to specify the nominalfriction loss ( or Pa/m). Low-velocity design isrecommended for typical commercial orresidential systems.ã2005 Pearson Education South Asia Pte Ltd
19. Flow of Air in Ducts19.3 Duct Design5. Specify the nominal flow velocity for each part ofthe duct system. For the intake duct and the finalruns to occupied spaces, use approximately 3–4m/s (600–800 ft/min). For main ducts away fromoccupied spaces, use approximately 6 m/s (1200ft/min).6. Specify the size and shape of each part of theduct system. The diameters for circular ducts arefound directly from Fig. 19.2 or Fig. 19.3.Rectangular ducts can be sized using Table 19.2and Eq. (19–1). Use Table 19.3 and Eq. (19–3)for flat oval ducts.ã2005 Pearson Education South Asia Pte Ltd
19. Flow of Air in Ducts19.3 Duct Design6. Compute the energy losses in the intake duct andin each section of the delivery duct.7. Compute the total energy loss for each path fromthe fan outlet to each delivery grille.8. Determine whether the energy losses for all pathsare reasonably balanced, that is, the pressuredrop from the fan to each outlet grille isapproximately equal.9. If significant unbalance occurs, redesign theductwork by typically reducing the design velocityin those ducts where high pressure drops occur.This requires using larger ducts.ã2005 Pearson Education South Asia Pte Ltd
19. Flow of Air in Ducts19.3 Duct Design10. Reasonable balance is achieved when all pathshave small differences in pressure drop such thatmodest adjustment to dampers will achieve a truebalance.11. Determine the pressure at the fan inlet and outletand the total pressure rise across the fan.12. Specify a fan that will deliver the total air flow atthis pressure rise.13. Plot or chart the pressure in the duct for eachpath and inspect for any unusual performance.ã2005 Pearson Education South Asia Pte Ltd
19. Flow of Air in DuctsExample 19.5The system shown in Fig. 19.1 is being designed for asmall office building. The air is drawn from outside thebuilding by a fan and delivered through four branches tothree offices and a conference room. The air flowsshown at each outlet grille have been determined byothers to provide adequate ventilation to each area.Dampers in each branch permit final adjustment of thesystem.ã2005 Pearson Education South Asia Pte Ltd
19. Flow of Air in DuctsExample 19.5Complete the design of the duct system, specifying thesize of each section of the ductwork for a low-velocitysystem. Compute the expected pressure drop for eachsection and at each fitting. Then, compute the totalpressure drop along each branch from the fan to the fouroutlet grilles and check for system balance. If a majorimbalance is predicted, redesign appropriate parts of thesystem to achieve a more nearly balanced system.Then, determine the total pressure required for the fan.Use Fig. 19.2 for estimating friction losses and Table19.4 for dynamic loss coefficients.ã2005 Pearson Education South Asia Pte Ltd
19. Flow of Air in DuctsExample 19.5First, treat each section of the duct and each fittingseparately. Then, analyze the branches.1. Intake duct A: Q 1.274 m3/s; L 4.9 m.Let v L 4.1 m/s.From Fig. 19.3, required D 0.6 m.hL 0.3 Pa/mHL 0.3 Pa/m (4.9 m) 1.47 Paã2005 Pearson Education South Asia Pte Ltd
19. Flow of Air in DuctsExample 19.52. Damper in duct A: C 0.20 (assume wide open)(Table 19.4).3. Intake louvers: The 1.0 by 1.0 m (40-by-40-in) sizehas been specified to give approximately a velocity of3.1 m/s through the open space of the louvers. UseHL 17 Pa from Table 19.4.ã2005 Pearson Education South Asia Pte Ltd
19. Flow of Air in DuctsExample 19.54. Sudden contraction between louver housing andintake duct: From Fig. 10.7, we know that the resistancecoefficient depends on the velocity of flow and the ratioD1/D2 for circular conduits. Because the louver housingis a 1-by-1-m (40-by-40-in) square, we can compute itsequivalent diameter from Eq. (19–1):ã2005 Pearson Education South Asia Pte Ltd
19. Flow of Air in DuctsExample 19.5Then, in Fig. 10.7,and K C 0.31. Then,5. Total loss in intake system:ã2005 Pearson Education South Asia Pte Ltd
19. Flow of Air in DuctsExample 19.5Because the pressure outside the louvers isatmospheric, the pressure at the inlet to the fan is –23.62 Pa, a negative gage pressure. An additional lossmay occur at the fan inlet if a geometry change isrequired to mate the intake duct with the fan. Knowledgeof the fan design is required, and this potential loss isignored in this example.Note: All ducts on the fan outlet side are rectangular.ã2005 Pearson Education South Asia Pte Ltd
19. Flow of Air in DuctsExample 19.56. Fan outlet, duct B: Q 1.274 m3/s; L 6.1 m.ã2005 Pearson Education South Asia Pte Ltd
19. Flow of Air in DuctsExample 19.57.ã2005 Pearson Education South Asia Pte Ltd
19. Flow of Air in DuctsExample 19.57.8. Damper in duct E: C 0.20 (assume wide open).9. Elbow in duct E: smooth rectangular elbow; C 0.18ã2005 Pearson Education South Asia Pte Ltd
19. Flow of Air in DuctsExample 19.510. Grille 6 for duct E: HL 1.5 Pa.11. Tee 3 from duct B to branch E, flow in branch: C 1.00. HL based on velocity ahead of tee in duct B:12.ã2005 Pearson Education South Asia Pte Ltd
19. Flow of Air in DuctsExample 19.513. Tee 3 from duct B to duct C, flow through main:C 0.1014.ã2005 Pearson Education South Asia Pte Ltd
19. Flow of Air in DuctsExample 19.515. Damper in duct F: C 0.20 (assume wide open).16. Two elbows in duct F: smooth rectangular elbow;C 0.1817. Grille 7 for duct F HL 15 Pa.18. Tee 4 from duct C to branch F, flow in branch:C 1.00ã2005 Pearson Education South Asia Pte Ltd
19. Flow of Air in DuctsExample 19.519.20. Tee 4 from duct C to duct D, flow through main:C 0.1021. Wye 5 between duct D and ducts G and H: C 0.3ã2005 Pearson Education South Asia Pte Ltd
19. Flow of Air in DuctsExample 19.522. Ducts G and H are identical to duct E, and lossesfrom Steps 7–10 can be applied tothese paths.This completes the evaluation of the pressure dropsthrough components in thesystem. Now we can sum the losses through any pathfrom the fan outlet to the outlet grilles.a. Path to grille 6 in duct E: sum of losses from Steps 6–11:ã2005 Pearson Education South Asia Pte Ltd
19. Flow of Air in DuctsExample 19.5b. Path to grille 7 in duct F: sum of losses from Steps 6and 12–18:c. Path to either grille 8 in duct G or grille 9 in duct H:sum of losses from Steps 6, 12, 13, 19–21, and 7–10:ã2005 Pearson Education South Asia Pte Ltd
19. Flow of Air in DuctsExample 19.5Redesign to Achieve a Balanced SystemThe ideal system design would be one in which the lossalong any path, a, b, or c, is the same. Because that isnot the case here, some redesign is called for. The lossin path b to grille 7 in duct F is much higher than theothers. The component losses from steps 12, 14–16,and 18 affect this branch, and some reduction can beachieved by reducing the velocity of flow in ducts C andF.ã2005 Pearson Education South Asia Pte Ltd
19. Flow of Air in DuctsExample 19.512a.14a.ã2005 Pearson Education South Asia Pte Ltd
19. Flow of Air in DuctsExample 19.515a.16a.18a.ã2005 Pearson Education South Asia Pte Ltd
19. Flow of Air in DuctsExample 19.5Now we can recompute the total loss in path B to grille 7in duct F. As before, this is the sum of the losses fromsteps 6, 12a, 13, 14a, 15a, 16a, 17, and 18a:This is a significant reduction, which results in a totalpressure drop less than that of path a. Therefore, let’ssee if we can reduce the loss in path a by also reducingthe velocity of flow in duct E. Steps 7–9 are affected.ã2005 Pearson Education South Asia Pte Ltd
19. Flow of Air in DuctsExample 19.57a.8a.ã2005 Pearson Education South Asia Pte Ltd
19. Flow of Air in DuctsExample 19.59a.Now, we can recompute the total loss in path a to grille 6in duct E. As before, this isthe sum of the losses from steps 6, 7a, 8a, 9a, 10, and11:ã2005 Pearson Education South Asia Pte Ltd
19. Flow of Air in DuctsExample 19.5This value is very close to that found for the redesignedpath b, and the small difference can be adjusted with thedampers. Now, note that path c to either grille 8 or grille9 still has a lower total loss than either path a or path b.We could either use a slightly smaller duct size inbranches G and H or depend on the adjustment of thedampers here also. To evaluate the suitability of usingthe dampers, let’s estimate how much the damperswould have to be closed to increase the total loss to 32.1Pa (to equal that in path a). The increased loss isã2005 Pearson Education South Asia Pte Ltd
19. Flow of Air in DuctsExample 19.5With the damper wide open and with 0.283 m3/s passingat a velocity of approximately 4 m/s, the loss was 1.93Pa, as found in the original Step 8. The loss now shouldbeFor the damper, however,Solving for C givesã2005 Pearson Education South Asia Pte Ltd
19. Flow of Air in DuctsExample 19.5Referring to Table 19.4, you can see that a dampersetting of less than 10 would produce this value of C, avery feasible setting. Thus, it appears that the ductsystem could be balanced as redesigned and that thetotal pressure drop from the fan outlet to any outlet grillewill be approximately 32 Pa. This is the pressure that thefan would have to develop.ã2005 Pearson Education South Asia Pte Ltd
19. Flow of Air in DuctsExample 19.5ã2005 Pearson Education South Asia Pte Ltd
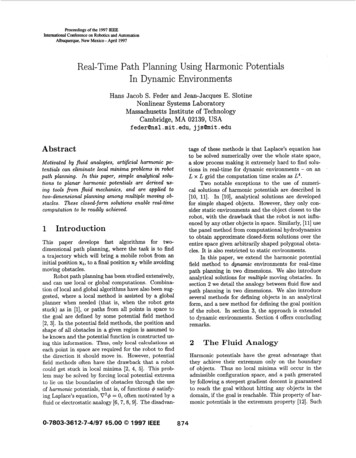
19. Flow of Air in DuctsExample 19.5It is helpful to visualize the pressure changes that occurin the system. Figure 19.5 shows a plot of air pressureversus position for the path from the intake louvers,through the fan, through ducts B and E, to outlet grille 6.Similar plots could be made for the other paths.ã2005 Pearson Education South Asia Pte Ltd
19. Flow of Air in DuctsExample 19.5ã2005 Pearson Education South Asia Pte Ltd
19. Flow of Air in Ducts19.4 Energy Efficiency and Practical Considerations in Duct Design 1.2.Additional considerations must be addressed whendesigning air distribution systems for HVAC systems andindustrial exhausts.Listed below are some recommendations.Lower velocities tend to produce lower energy losses inthe system, which reduce fan energy usage and maypermit using a smaller, less expensive fan. However,ducts will tend to be larger, affecting space requirementsand leading to higher installed costs.Locating as much of the duct system as practical withinthe conditioned space will save energy for heating andcooling systems.ã2005 Pearson Education South Asia Pte Ltd
19. Flow of Air in Ducts19.4 Energy Efficiency and Practical Considerations in Duct Design3. Ductwork should be well sealed to stop leaks.4. Ducts passing through unconditioned spacesshould be well insulated.5. The fan capacity should be well matched to theair supply requirement to avoid excessive controlby dampers, which tends to waste energy.ã2005 Pearson Education South Asia Pte Ltd
19. Flow of Air in Ducts19.4 Energy Efficiency and Practical Considerations in Duct Design6. When loads vary significantly over time, variablespeed drives should be installed on the fan andconnected into the control system to lower the fanspeed at times of low demand. The fan lawsindicate that lowering speed reduces powerrequired by the cube of the speed reduction ratio.(See Chapter 13.) For example, reducing fanspeed by 20 percent will reduce the requiredpower by approximately 50 percent.ã2005 Pearson Education South Asia Pte Ltd
19. Flow of Air in Ducts19.4 Energy Efficiency and Practical Considerations in Duct Design7. Ducts can be made from sheet metal, rigidfiberglass duct board, fabric, or flexiblenonmetallic duct. Some come with insulationeither inside or outside to reduce energy lossesand to attenuate noise. Smooth surfaces arepreferred for long runs to minimize friction losses.8. Return air ducts should be provided to maintainconsistent flow into and out from each room in theconditioned space.ã2005 Pearson Education South Asia Pte Ltd
19. Flow of Air in Ducts19.4 Energy Efficiency and Practical Considerations in Duct Design9. Ducts for most HVAC systems are designed forpressures that range from –750 Pa (–3 inH2O) onthe intake side of fans to 2500 Pa (10 inH2O) onthe outlet side. However, some large commercialor industrial installations may range from –2500Pa (–10 inH2O) to 25 kPa (100 inH2O). Structuralstrength, rigidity, and vibration must beconsidered.ã2005 Pearson Education South Asia Pte Ltd
19. Flow of Air in Ducts19.4 Energy Efficiency and Practical Considerations in Duct Design10. Noise generation in air distribution systems mustbe considered to ensure that occupants are notannoyed by high noise levels. Special care shouldbe given to fan selection and location and airvelocity in ducts and through outlet grilles. Soundinsulation, vibration isolators, and mountingtechniques should be examined to minimizenoise.ã2005 Pearson Education South Asia Pte Ltd
Applied Fluid Mechanics 1. The Nature of Fluid and the Study of Fluid Mechanics 2. Viscosity of Fluid 3. Pressure Measurement 4. Forces Due to Static Fluid 5. Buoyancy and Stability . Another popular shape for air ducts is the flat oval shown in Fig. 19.4. The cross-sectional area is the sum of a rectangle and a circle, found from