Transcription
Regional Environmental Change (2020) 20: AL ARTICLEClimate change vulnerability, water resources and socialimplications in North AfricaJanpeter Schilling 1,2 & Elke Hertig 3 & Yves Tramblay 4 & Jürgen Scheffran 5Received: 24 September 2018 / Accepted: 27 October 2019 / Published online: 7 February 2020# The Author(s) 2020AbstractNorth Africa is considered a climate change hot spot. Existing studies either focus on the physical aspects of climate change ordiscuss the social ones. The present article aims to address this divide by assessing and comparing the climate change vulnerability of Algeria, Egypt, Libya, Morocco, and Tunisia and linking it to its social implications. The vulnerability assessmentfocuses on climate change exposure, water resources, sensitivity, and adaptive capacity. The results suggest that all countries areexposed to strong temperature increases and a high drought risk under climate change. Algeria is most vulnerable to climatechange, mainly due to the country’s high sensitivity. Across North Africa, the combination of climate change and strongpopulation growth is very likely to further aggravate the already scarce water situation. The so-called Arab Spring has shownthat social unrest is partly caused by unmet basic needs of the population for food and water. Thus, climate change may becomean indirect driver of social instability in North Africa. To mitigate the impact of climate change, it is important to reduce economicand livelihood dependence on rain-fed agriculture, strengthen sustainable land use practices, and increase the adaptive capacity.Further, increased regional cooperation and sub-national vulnerability assessments are needed.Keywords Climate change . Vulnerability . Resilience . Water . Conflict . North AfricaIntroductionNorth Africa is often considered a “climate change hotspot”(e.g., Diffenbaugh and Giorgi 2012) that has been receivingincreasing attention in recent years, particularly from naturaland social scientists. Climatologists, for instance, have emphasized the high year-to-year variability of rainfall amountsand the related drought periods and heat waves (Cook et al.2016; Lelieveld et al. 2016). Several researchers have studiedthe impact of climate change on the water situation andagriculture. For example, Schmitz et al. (2013) project increased water scarcity in North Africa, while Alboghdadyand El-Hendawy (2016) show that a 1% increase in temperature in the winter results in a 1.12% decrease in agriculturalThis article is part of the Topical Collection on Climate change impacts inthe MediterraneanElectronic supplementary material The online version of this ) contains supplementarymaterial, which is available to authorized users.* Janpeter Schillingschilling@uni-landau.deElke Hertigelke.hertig@geo.uni-augsburg.deYves Tramblayyves.tramblay@ird.frJürgen Scheffranjuergen.scheffran@uni-hamburg.de1Research Group Landuse Conflicts, Institute for EnvironmentalSciences, University of Koblenz-Landau, Fortstraße 7,76829 Landau, Germany2Peace Academy Rhineland-Palatinate, Landau, Germany3Faculty of Medicine, Augsburg University, Augsburg, Germany4HydroSciences Montpellier (University of Montpellier, CNRS,IRD), Montpellier, France5Research Group Climate Change and Security (CLISEC), Center forEarth System Research and Sustainability (CEN), Institute ofGeography, University of Hamburg, Hamburg, Germany
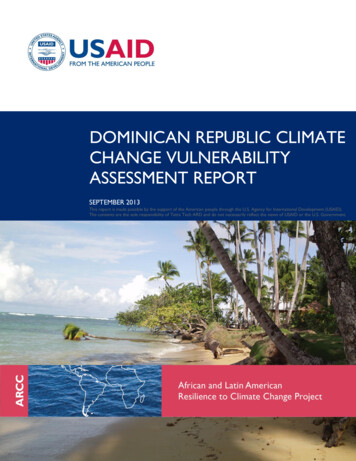
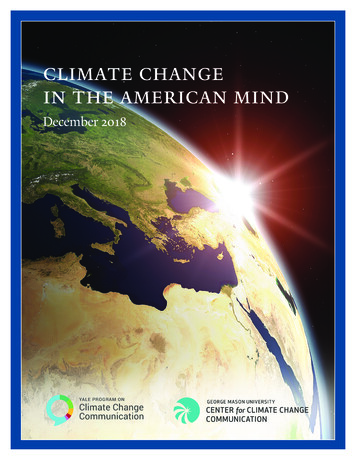
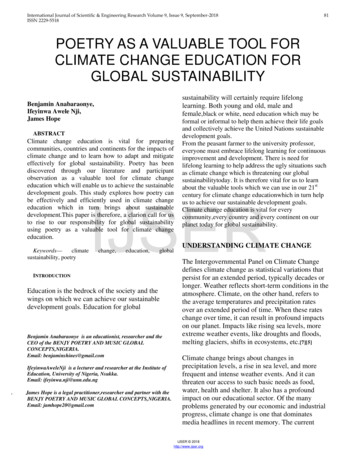
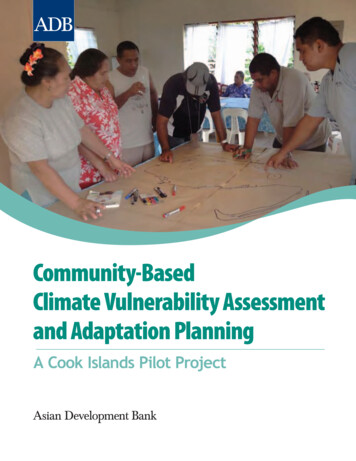
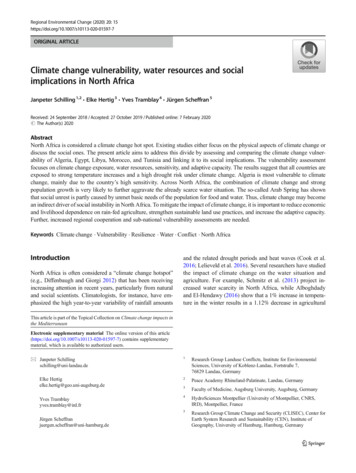
15 Page 2 of 12Reg Environ Change (2020) 20: 15Fig. 1 Land use, topography, and population growth in North Africa (Syed Zulfiqar Ali Shah for the authors based on ESA 2015a; ESA 2015b; PRB 2017)production in the Middle East and North Africa (MENA) region. Some social scientists have argued that water scarcity inthe MENA region is a “man-made problem” (Haddadin2001:462) and mostly caused by strong population growth(see also Fig. 1). Others have stressed that less rainfall and moreerratic rainfall are major drivers of water scarcity which willmost strongly affect the poor population in rural areas (Thomas2008). Scheffran et al. (2019) state that in regions depending onrain-fed agriculture, droughts can increase the risk of civil conflict (see also Schilling and Krause 2018). The papers by Wahaet al. (2017) and Schilling et al. (2012) are two examples of avery limited body of integrative literature covering both physical and social aspects of climate change and vulnerability inNorth Africa. The present article contributes to this literature byassessing and comparing the climate change vulnerability ofAlgeria, Egypt, Libya, Morocco, and Tunisia and linking it toits social implications. Figure 1 shows the study area, includingtopography, land use, and projected population growth.Section 2 describes the conceptual framework, while Sect. 3assesses and compares the climate change vulnerability of theNorth African countries. A particular focus is placed on theimpact of climate change on water resources, which are crucialto human livelihoods in North Africa. Section 4 then assessesthe social implications, including the influence of water andfood on societal stability and the risk of violent conflict. Thepaper concludes with Sect. 5, which summarizes key findingsand gives recommendations to reduce climate change vulnerability and its negative social implications in North Africa.Conceptual frameworkVulnerability is the key guiding concept of this article.Since we want to be able to compare our results toSchilling et al. (2012), who use the IntergovernmentalPanel on Climate Change’s (IPCC) vulnerability definition from 2007, we also use this definition, which considers vulnerability as being composed of sensitivity,adaptive capacity, and exposure (IPCC 2007). Figure 2gives further details of the elements of vulnerability andhow we define and operationalize them in this paper.Following the IPCC, we further divide the adaptive capacity into generic adaptive capacity and impact-specificadaptive capacity. “Generic indicators include factorssuch as education, income and health. Indicators specific to a particular impact, such as drought or floods, mayrelate to institutions, knowledge and technology” (Adgeret al. 2007:727). To measure and compare these elements of adaptive capacity, we chose the most reliableand recognized indicators (see Table S2) that wereavailable for the five countries and have been used inprevious studies (see, e.g., Schilling et al. 2012).While vulnerability is the key concept of this paper,we use the concept of resilience when discussing thesocial implications of climate change. We define resilience as “the ability of a group or community to withstand, recover, and learn from external disturbances”(Schilling et al. 2017:5); in this case, the external disturbance is climate change.Like all vulnerability assessments, this study has itslimitations. Almost all the indicators used in the presentstudy are only available for the national level. Thismeans that variations in the vulnerability within a country cannot be addressed in the present work. Especiallyfor countries with a large geographical size, likeAlgeria, Libya, and Egypt, the sub-national vulnerabilities are diverse.
Page 3 of 12 15Reg Environ Change (2020) 20: 15Fig. 2 Vulnerability framework(own representation based onIPCC 2007)Climate change vulnerability and waterresources in North AfricaExposure to climate changeThis section focuses on the most important climate variables – temperature and precipitation – and the impactof droughts on water and agriculture as the main livelihood resources in the region.For almost all parts of North Africa, there was a significantwarming trend over the last decades, more pronounced in thesummer and with regard to minimum temperatures (see Donatet al. 2013 and Table 1). The warming trend was accompaniedby increases in hot nights, hot days, and heat waves and adecrease in cold waves (Elsharkawy and Elmallah 2016;Filahi et al. 2017; Nashwan et al. 2019; Zeroual et al. 2019).Mean precipitation during the wet season, from October toMarch, has decreased over the last decades, with the strongestdecline over the Mediterranean parts of Morocco and Algeriaand parts of Libya, whereas a slight increase in precipitationhas been observed over Mediterranean Egypt (Hertig andTramblay 2017; Nashwan et al. 2019; Taibi et al. 2017). ForTunisia, trends are not consistent (Chargui et al. 2018; Fathalliet al. 2019; Kingumbi et al. 2005). Along with the decrease inrainfall during the wet season, wintertime drying has beenTable 1 Synthesis of past trendsin North Africa for the second halfof the twentieth century andbeginning of the observed over large parts of western North Africa at least sincethe 1970s (Hertig and Tramblay 2017; Tramblay et al. 2013a;Zittis 2018). However, some wet years observed since the2000s can be attributed to increased climate variability(Donat et al. 2013; Nouaceur and Murărescu 2016). Withrespect to heavy rainfall events, most parts of North Africashow no significant trends over the last decades (Nashwanet al. 2019; Nasri et al. 2016; Tramblay et al. 2012), while ageneral increase in drought frequency can be observed in allcountries (see Hertig and Tramblay 2017 and Table 1).Projections under increased greenhouse gas forcingshow considerable changes in the mean, the variability,and the extremes for temperature and precipitation overthe course of the twenty-first century, making the regionone of the major climate change hot spots (Diffenbaughand Giorgi 2012). With respect to temperature changes,an annual and seasonal warming signal for northernAfrica is consistently projected by various general circulation models (GCMs) (e.g.,Collins et al. 2013), regional climate models (RCMs) (e.g., Bucchignani et al.2018), and statistical projections (e.g., Hertig andJacobeit 2008). In the Coupled Model IntercomparisonProject Phase 5 (CMIP5), GCM ensemble indicates anincrease in median temperature of about 4 C in thesummer and about 2.5 C in the winter by the end ofMeantemperatureExtreme lDrought - -No trendNo trendNo trendNo trendNo trend Semiquantitative evaluation of temperature changes in absolute terms (small ( ), 0.5 C; moderate ( ), 0.5 C to 1 C; strong ( ), 1 C) and of precipitation changes and drought changes in relative terms (small( /-), 10%; moderate ( /–), 10% to 20%; strong ( /—), 20%)
15 Page 4 of 12Reg Environ Change (2020) 20: 15the twenty-first century under the moderateRepresentative Concentration Pathways (RCP) 4.5 scenario and about 7 C in the summer and 4 C in thewinter under the more pessimistic RCP8.5 scenario(Christensen et al. 2013). In addition, strong increasesin heat waves (as expressed by a strong increase inwarm nights, warm days, and warm spell duration) areprojected for the whole North Africa region (Lelieveldet al. 2016). With regard to precipitation, the CMIP5GCM ensemble projects a decrease in rainfall of about 10% to 20% for large parts of northern Africa(IPCC 2013). The decreasing trend is in general confirmed by dynamical (Ozturk et al. 2018; Tramblayet al. 2018) and statistical downscaling assessments(Dubrovský et al. 2014; Hertig et al. 2013).With regard to heavy precipitation, Hertig et al. (2013,2014) found an increasing trend for western North Africa inwinter and a decrease for all other seasons. RCM simulations present contrasted projections for Morocco with littlerobustness (Filahi et al. 2017; Tramblay et al. 2012), anincrease in extreme rainfall for Libya in spring and autumn(Gao et al. 2006), and a decrease in rainfall in MediterraneanEgypt (Abiodun et al. 2017). Overall, the projected changesin extreme precipitation for North Africa are rather uncertain, with little agreement between climate models(Tramblay and Somot 2018). CMIP3 and CMIP5 modeloutputs (Dai and Zhao 2017; Dubrovský et al. 2014) consistently predict an increase in droughts over North Africa,with the strongest changes occurring in the northwest.Likewise, statistical and dynamical downscaling projectionsshow a strong increase in the number and intensity ofdrought months and the maximum dry-spell length fornorthern Morocco and Algeria, and small to moderate increases for the Mediterranean parts of Tunisia and Libya(Gao et al. 2006; Hertig and Tramblay 2017). Unlike theprojected changes in heavy rainfall events, the climatechange signal pointing to an increase in aridity and a reduction of the number of wet days is much stronger (Poladeet al. 2017). Table 2 gives a general picture summarizing theanticipated changes.Table 2 Synthesis of climatechange in North Africa until theend of the twenty-first centuryAlgeriaEgyptLibyaMoroccoTunisiaImpact of climate change on water resourcesThe projected precipitation decreases in the southern part of theMediterranean basin will affect water resources (Lionello andScarascia 2018). Recently, Tramblay et al. (2018) analyzed theimpact of climate change on the water resources of the 46basins that supply the largest dams and reservoirs in NorthAfrica. They projected a future decline in surface water resources in different climate scenarios, due to a combination ofprecipitation decreases and evapotranspiration increases along awest-to-east gradient. Some studies based on large-scale hydrological models have also shown a future potential decrease inwater resources for the southern Mediterranean region(Prudhomme et al. 2014). Droogers et al. (2012) simulatedfuture water resources for the Maghreb and the Middle East,taking into account both water supply and demand. They obtained a future decrease in water supply by 12% on average,coupled with a strong increase in water demand by 50%.Indeed, besides the trends in water supply, several studiesproject a strong increase in water demand for this region due topopulation growth and economic development, indicating ahigher water stress in the future (e.g., Milano et al. 2012).Some studies provide hydrological scenarios on the scale ofindividual basins in Algeria (e.g., Benhamiche et al. 2014;Elmeddahi et al. 2014), Morocco (e.g., Brouziyne et al. 2018;Tramblay et al. 2013b) and Tunisia (e.g., Bargaoui et al. 2013;Dakhlaoui et al. 2017). Their results indicate a decrease in surface flows that is more pronounced under the RCP8.5 thanunder the RCP4.5 scenario. Climate model simulations converge toward a decrease in precipitation in spring and to a lesserextent in winter (Tramblay et al. 2016; Tramblay et al. 2018).This decrease in rainfall at the end of winter and spring isresponsible for the decline in annual surface runoff. The increase in potential evapotranspiration, linked to the sharp risein temperatures in this region during the summer period in thefuture climate, is also responsible for the decline in surfacerunoff, but more moderately than the decrease in precipitation.The influence of increasing evapotranspiration is most visiblein late spring and early fall; for the majority of the basins, anextension of the dry summer season is observed with little to noMeantemperatureExtreme lDrought ------ - Semiquantitative evaluation of temperature changes in absolute terms (small ( ), 2 C; moderate ( ), 2 C to 4 C; strong ( ), 4 C) and of precipitation changes and drought changes in relative terms (small ( /-), 20%; moderate ( /–), 20% to 40%; strong ( /—), 40%)
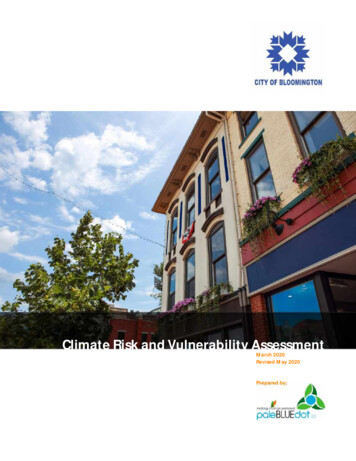
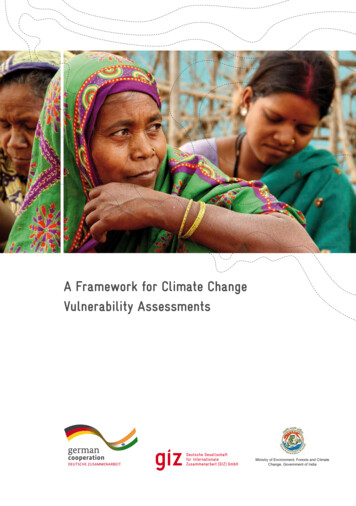
Page 5 of 12 15Reg Environ Change (2020) 20: 15groundwater resources. In this context, there is a strong needfor adaptation strategies to limit the impacts of climate changein this region, through an adaptation of agricultural practices andirrigation strategies (Brouziyne et al. 2018; Seif-Ennasr et al.2016) and better regulation of well exploitation (Kuper et al.2017). Several studies agree that these adaptation measuresshould be implemented at the institutional and local levels toencourage a rational use of water that takes into account bothsocioeconomic and natural constraints and ensure sustainability(Kuper et al. 2017; Lezzaik and Milewski 2018; Seif-Ennasret al. 2016). There is also a need for better long-term monitoringof water resources, whereas at the moment, the monitoring network is being reduced (Leduc et al. 2017).flow in the rivers during this season. For the mountainous basins with the presence of snow in winter, notably in Morocco inthe High Atlas Mountains, the various climatic scenarios pointto a sharp decline in snow cover and snowmelt runoff, causedby the strong rise in temperatures and the decrease in precipitation as rain or snow (Marchane et al. 2017).As a consequence of the decrease in surface runoff, a significant decline in water supply to dams and reservoirs, which aremainly used for irrigation, is expected. In North Africa, thesereservoirs are already affected by dam silting, evaporation losses(Boudjadja et al. 2003; Remini et al. 2009), and in some casesdeep infiltration losses through the reservoir bed into the aquifers(Leduc et al. 2007). Several studies associate a future decrease ingroundwater recharge with the reduction in surface runoff(Benabdallah et al. 2018; Bouchaou et al. 2011; Meddi andBoucefiane 2013); since in semiarid environments, focused infiltration from rivers is the main groundwater recharge process(Leduc et al. 2017). However, until now, North African aquifershave been affected much more by human activities than by climate variability (Leduc et al. 2017; Lezzaik and Milewski 2018).A drop in groundwater levels induced by overexploitation hasbeen reported in the last 50 years in many subregions of theMaghreb countries (Bouchaou et al. 2011; Zkhiri et al. 2019)and has also led to a degradation of water quality in these aquifers. The main cause of the intense pumping of groundwaterresources is agricultural demand, together with the significantdemand in coastal urban areas with high population densities(Leduc et al. 2017; Lezzaik and Milewski 2018). However, it isnow clear that at the current rate of withdrawal, groundwatercannot be considered a long-term resource, given the increasedprecipitation variability due to climate change in the region(Kuper et al. 2017). Döll (2009) identified North Africa as oneof the regions with the highest vulnerability to decreasedIn order to assess sensitivity to climate change, this sectioncompares the countries’ availability of the affected resource(water) prior to the climate stimuli and the importance of theresource for each country. In all five North African countries,agriculture is by far the largest consumer of withdrawn water,and all countries except Egypt depend almost exclusively onrain as a source of water for agricultural land (Table S1). Interms of gross domestic product, agriculture is most importantin Morocco, although 15% is not very high. It should be notedthat the latest data available for Libya is significantly olderthan for the other countries. In terms of employment,Morocco is most dependent on agriculture and hence mostsensitive to climate change.Figure 3 shows the water situation measured by differentindices. Using the Hydrological Water Stress Index (HWSI)and the SWSI (Social Water Scarcity Index), all five countriesare regarded as water scarce. This means that according toFig. 3 Sensitivity measured by the water situation, based on three indices(own representation based on FAO 2016; Jemmali 2018; PRB 2017). TheHydrological Water Stress Index (HWSI) measures the number of peoplein hundreds per one million m3 of available renewable water. The SocialWater Scarcity Index (SWSI) is the HWSI divided by the HumanDevelopment Index (see Table S2). The Water Poverty Index (WPI) combines indicators measuring access to water for consumption, cooking,irrigation, and nonagricultural use with water availability measured inm3 per capita per year (for details see Jemmali 2018). For reasons ofgraphical representation, the WPI has been reversed (100 – WPI RWPI)Sensitivity
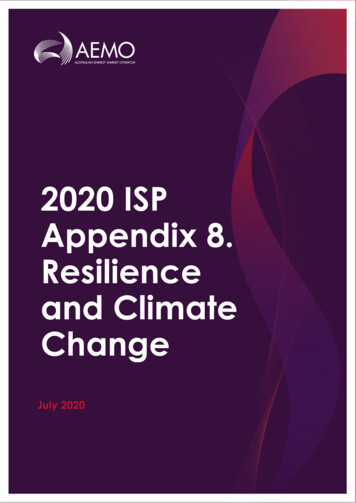
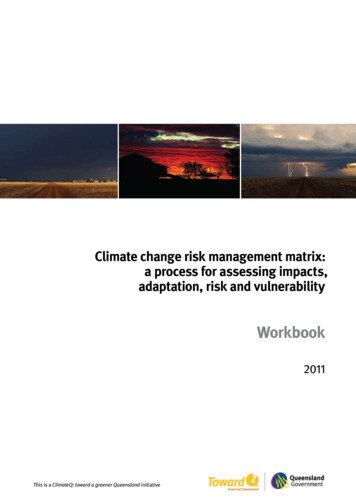
15 Page 6 of 12these two indices, the water situation has worsened in all fivecountries since 2009 (see Schilling et al. 2012). Algeria andTunisia have the highest SWSI and HWSI values, while thevalues for Morocco and Egypt are significantly lower. Egypthas the highest Reversed Water Poverty Index (RWPI) that iscalculated by subtracting the Water Poverty Index (WPI) from100. Taking all three indices into consideration, the watersupply situation is the worst in Algeria, followed by Tunisia,Egypt, and Morocco. On the demand side, the bar diagrams inFig. 1 show that the highest population growth in both absolute and relative terms is expected to occur in Egypt. Between2017 and 2050, an additional 70 million people will be livingin the country. The second strongest population growth isexpected in Algeria, while the growth in Libya, Tunisia, andMorocco is strong in relative rather than absolute terms. In allthe countries, strong population growth is highly likely tofurther aggravate the already scarce water situation.Reg Environ Change (2020) 20: 15significant progress here, as well as in terms of the percentageof the population with access to improved drinking watersources. The latter values were much lower in 2008, whenthe percentage in Morocco was only 60 (see Schilling et al.2012). In terms of education, there is still a gap between theother North African countries and Morocco, which has thelowest generic adaptive capacity. Tunisia and Morocco arethe least corrupt countries, while Libya is the most corruptcountry in all of North Africa (Table S2). Taking all threeindicators into account, the impact-specific adaptive capacityis lower in Algeria and Egypt than in Tunisia and Morocco,while not enough data is available to assess the impactspecific adaptive capacity in Libya.Comparison of vulnerabilityMorocco not only has the lowest per capita income but alsothe highest Gini index and hence the most unequal distributionof income (Table S2). The level of human development is highin Algeria, Libya, and Tunisia and medium in Egypt andMorocco. The under-five child mortality rate is highest inAlgeria and Morocco, but the two countries have madeFigure 4 combines key vulnerability indicators of genericadaptive capacity and sensitivity. The gross domestic product(GDP) per capita, the human development index, and the education index were chosen (rather than all six indicators fromTable S2) because of a lack of data on two of the indicators forLibya and in order to compare the results to Schilling et al.(2012). For reasons of graphical representation, the indicatorsrepresenting the sensitivity to climate change have been reversed to insensitivity. The larger the plot area, the greater thegeneric adaptive capacity (area above the dashed line) and theFig. 4 Generic adaptive capacity and insensitivity to climate change inNorth Africa (own representation based on CIA 2018; UNDP 2016). Thelower three variables (related to agriculture) are taken from Table S1 andreversed for graphical representation. This means dependence on agriculture becomes independence from agriculture. GDP gross domesticproduct. PPP USD purchasing power parity in US dollarsAdaptive capacity
Page 7 of 12 15Reg Environ Change (2020) 20: 15higher the insensitivity to climate change (area below thedashed line). The orange line shows the assessment based onTables S1 and S2, while the gray line indicates the values foreach indicator as assessed by Schilling et al. (2012). Whencomparing the orange plot areas, it is obvious that Moroccohas the smallest plot area and is hence the most vulnerable toclimate change. Algeria and Tunisia have similarly shapedplot areas. In both countries, the importance of rain for agriculture is a key weakness, while a relatively high income levelstrengthens the adaptive capacity. According to Fig. 4, Egypthas the highest generic adaptive capacity and lowest sensitivity to climate change. When comparing the current situationwith the assessment from 2012, increases in income can beobserved in all countries but Libya, where the generic adaptivecapacity shows a declining trend.Overall, all North African countries are exposed to strongclimate change, with Morocco and Algeria particularly at risk(see Sect. 3.1). The sensitivity to climate change is highest inAlgeria, Tunisia, and Egypt, while water is also scarce inMorocco. In Libya the sensitivity is unclear due to a lack ofdata. Algeria has the highest generic adaptive capacity but alsothe lowest impact-specific adaptive capacity. Taking all theelements of vulnerability into consideration, Algeria is themost vulnerable country. In the assessment by Schillinget al. (2012), this was Morocco. The results of the presentstudy are in line with earlier findings by Waha et al.(2017:1627), who see Algeria as one of the countries inNorth Africa that will become “global hot spots for droughtby the end of the twenty-first century.” In contrast,Ahmadalipour and Moradkhani (2018) find Algeria to be lessvulnerable to drought, in comparison with all countries on theAfrican continent.Social implications of climate changeThe social implications of climate change depend on the vulnerability of each country and are hence location-specific. Thefollowing sections highlight some of the key implications forfood production and conflict in North Africa.Food productionClimate change will negatively affect the largely rain-fed agricultural production in North Africa (Waha et al. 2017). Forthe central northern region of Algeria, a reduction in durumwheat production of between 22% and 40% is projected forthe period from 2071 to 2100 compared to the 1980–2009baseline period using the IPCC A1B scenario (Chourghalet al. 2016). The extent of the reduction depends on whetherprescribed or dynamic sowing is assumed. For the easternhigh plains of Algeria, the yield loss is expected to be lower.In Egypt, wheat yields are projected to decline due to climatechange, despite improvements obtained through crop intensification and expansion of irrigated areas (Asseng et al. 2018).In addition to losses caused by changes in temperature, rainfall, and extreme CO2 concentrations, a sea level rise of 1 m isprojected to lead to a loss of one-third of the current agricultural land in the Nile Delta (El-Nahry and Doluschitz 2010). Asimulation by Fader et al. (2016) suggests that Libya will beunable to meet its irrigation water requirements toward the endof the century, even when the most optimistic scenario ofclimate change and irrigation technologies are considered(for adaptation options see also Harmanny and Malek 2019).For Morocco, yield losses of around 10% between 2003 and2050 are projected for the major crop-producing areas underthe IPCC A2 scenario without considering a CO2 fertilizationeffect. Even when including this effect and using the optimistic B2 scenario, the majority of areas in Morocco’s breadbasket will see decreases in yield (Ouraich and Tyner 2018). ForTunisia, Zouabi and Peridy (2015) show that a 1% decrease inprecipitation leads to 0.79% decrease in the production ofcereals.All North African countries produce and import cereals(wheat, barley, maize, and others). While Egypt is by far thelargest producer and importer, Morocco has the highest andLibya the lowest per capita production. Libya also the highestdependency on cereal imports (Table S3).ConflictAs North African countries are strongly dependent on agriculture for gross domestic product and particularly employment(see Sect. 3.3), climate change can be expected to underminefood security, economic security, resilience, and overall livelihood prospects in the region (see also Waha et al. 2017). Thisis even more significant given that strong population growth(Fig.1) will increase the demand for food and income opportunities. However, the widening gap between the supply anddemand of critical resources is not sufficient to draw directclimate-conflict links. The wide body of literature has shownthat links between climate and conflict variables are indirectand complex (Adams et al. 2018; Buhaug 2015; Mach et al.2019; Scheffran et al. 2012; Schleussner et al. 2016). In NorthAfrica, climate change is expected to negatively impact agricultural production (Sect. 4.1), which in turn could contributeto rising food prices and food insecurity, leading to protestsand riots against the government (see also Scheffran et al.2019; Waha et al. 2017). This pathway was prominentlydiscussed as part of the so-called Arab Spring of 2011, whenprotests and riots led to political change in Tunisia, Libya, andEgypt (Sottilotta 2015). Demonstrations also took place inMorocco and Algeria (Bayat 2013). Some authors have calledthe Arab Spring a “textbook example” (Johnstone and Mazo2011:11; see also Werrell and Femia 2013) of how climatechange aggravated food prices and food insecurity, thus
15 Page 8 of 12resulting in riots and violence. Another study suggests thatdrought and crop failure in China led the country to stronglyincrease its wheat imports, which in turn contributed to a doubling of global wheat prices, triggering riots in Egypt(Sternberg 2012). The majority of studies identify sharplyincreasing food prices and living costs as drivers of the ArabSpring (e.g., Johnstone and Mazo 2011; Sternberg 2012;Werrell and Femia 2013). However, several studies attributethese rising costs to government policies and government failures rather than climate change and drought (e.g., AlSham mari and Willoughby 2019; Devarajan andIanchovichina 2018).Violent conflicts in the region are mainly driven by politicalmotives. The key actors in attacks on state governments areterrorist groups such as the so-called Islamic State and affiliatesof Al-Qaeda (see overview in Table S4). Algeria and Lib
exposed to strong temperature increases and a high drought risk under climate change. Algeria is most vulnerable to climate change, mainly due to the country's high sensitivity. Across North Africa, the combination of climate change and strong population growth is very likely to further aggravate the already scarce water situation.