Transcription
Climate Risk and Vulnerability AssessmentMarch 2020Revised May 2020Prepared by:
Table of ContentsSection 1:IntroductionSection 2:Climate Change In The MidwestSection 3:Climate Change In IndianaSection 4:Local Climate ChangeSection 5:City On The MoveSection 6:Climate Risks To PopulationSection 7:Climate Impact MultipliersHeat IslandTree CanopyFlood VulnerabilitiesWater StressSection 8:Climate Resilience IndicatorsEconomic StressHealthEPA Environmental Justice ScreenEPA Social Vulnerability IndexMPCA Environmental Justice ScreenHousing BurdenSection 9:Vulnerable PopulationsChildrenOlder AdultsIndividuals With DisabilitiesIndividuals Under Economic StressPeople of Color and Limited English SpeakersAt-Risk WorkersIndividuals with Possible Food InsecurityComposite VulnerabilitiesComparison of Vulnerable PopulationsSection 10:FindingsSection 11:RecommendationsAdaptation and Resilience GoalsSection 12:Potential FundingAppendix 1Local Climate Risks To EnvironmentAppendix 2Climate Adaptive Tree SpeciesAppendix 3Data References and ResourcesAppendix 4Glossary of Climate Adaptation andVulnerability Terms
Section01IntroductionClick toReturn to TOCBloomington Climate Risk and Vulnerability Assessment1-1
IntroductionClimate change is a global phenomenon that creates local impacts. Two changes to Indiana’s climate are occurringalready: shorter winters with fewer cold extremes, and more heavy and extreme precipitation. In the future, there isrelatively high confidence that those two changes will continue to increase in frequency and intensity, and also thatIndiana will begin to experience heat extremes beyond the historical variability of the climate. There is somewhat lowerconfidence that drought, and also tornadoes, hail and straight-line wind will increase in frequency and/or intensity as aresult of climate change in the future.While the science behind climate change is complex, many of the solutions to reducing impacts are already a part ofBloomington municipal government expertise. In many instances, responding to climate change does not require largescale changes to municipal operations, but simply requires adapting exiting plans and polices to incorporate knowledgeabout changing levels of risk across key areas such as public health, infrastructure planning and emergencymanagement.Incorporating this knowledge not only protects our communities from growing risk, but climate adaptation strategiescan also increase jobs, improve public health and the overall livability of our communities. Strategies which strengthenresilience in time of emergency also help communities thrive even more during good times.City of BloomingtonBloomington IN Renter vs Owner by Housing Type23.4 sq miles15,002 AcresAreaParks, Recreation & Preserves (in 2020) 2,275 AcresPopulation (2017)85,071Households (2017)30,569Number of Companies (2017)6,040Employment (2017 all jobs)50,700Note: “Non-Family” households include college student populations.City of Bloomington Census Tract Map1-2Bloomington Climate Risk and Vulnerability Assessment
What is Climate Change Vulnerability?According to the Intergovernmental Panel on Climate Change (IPCC), vulnerability is “the degree to which a system issusceptible to, or unable to cope with, adverse effects of climate change, including climate variability and extremes”.Vulnerability is a function of both impacts (the effects of climate change and variability on a given system or resource) aswell as adaptive capacity (the ability of the economy, infrastructure, resources, or population to effectively adapt to suchevents and changes).Why Study Climate Change Vulnerability?Increases in the global surface temperature and changes in precipitation levels and patterns are expected to continueand intensify for decades, regardless of mitigation strategies currently being implemented. In turn, these changes inclimate have impacts on the economy and health of local communities.Weather and climate shape our economy. Temperature impacts everything from the amount of energy consumed toheat and cool homes and offices to the ability for some workers to work outside. Temperature and precipitation levelsnot only determine how much water we have to drink, but also the performance of entire economic sectors, fromagriculture to recreation and tourism. Extreme weather events, like tornadoes, hail storms, droughts, and inland floodingcan be particularly damaging. In the last ten years alone, extreme weather events have cost Indiana and the Midwest 96billion in damage and resulting in 440 deaths. (NOAA National Centers for Environmental Information).In addition, climate conditions affect the quality of life and life safety of communities – particularly those populationsespecially sensitive to climate impacts. Extreme weather events linked to climate change have the potential to harmcommunity member health in numerous ways. Rising temperatures, for example, can result in a longer-than-averageallergy season, erode air quality, and prolong the stay and increase the population of insects increasing the risk of vectorborne diseases. Climate impacts also exacerbate additional economic challenges that can directly impact the ability ofat-risk populations to cope with the additional risks exacerbated by climate conditions while creating more exposure todangerous living/working conditions and poor nutrition.Strengthening community resilience is rooted in an on-going assessment of potential vulnerabilities, anticipatingpotential climate impacts, development and implementation of strategies to address those vulnerabilities, and incommunication and outreach to the members of the community.Weather vs ClimateThe difference between weather andclimate is a measure of time. Weatheris what conditions of the atmosphereare over a short period of time, andclimate is how the atmosphere"behaves" over relatively long periodsof time. (NASA)Bloomington Climate Risk and Vulnerability Assessment1-3
About This ReportThis Climate Vulnerability Assessment has been developed in conjunction withthe City of Bloomington's Climate Action Plan update effort. This report seeks to: Provide climate risk and vulnerability information in support of the City’sGlobal Covenant of Mayors reporting requirements Increase awareness of potential climate impacts and populationvulnerabilities. Increase inclusion of climate adaptation dialogue within City planningand decision making processes. Strengthen adaptive capacity based on the best available informationon regional climate change projections and impacts. Outline priority risks, and vulnerabilities in support of establishingstrategies and actions through the Climate Action Planning effort. Prevent or reduce the risks to populations most vulnerable to theimpacts of climate change.The Population Vulnerability Assessment portion of this report describes howclimate affects the region today, the changes and impacts expected over thecoming decades, and identifies population vulnerabilities.1-4Bloomington Climate Risk and Vulnerability Assessment
Section02Climate ChangeIn The MidwestClick toReturn to TOCBloomington Climate Risk and Vulnerability Assessment2-1
Climate Change in The MidwestAccording to the United States National Climate Assessment on the Midwest Region:In general, climate change will tend to amplify existing climate-related risks to people,ecosystems, and infrastructure in the Midwest. Direct effects of increased heat stress, flooding,drought, and late spring freezes on natural and managed ecosystems may be multiplied bychanges in pests and disease prevalence, increased competition from non-native oropportunistic native species, ecosystem disturbances, land-use change, landscapefragmentation, atmospheric pollutants, and economic shocks such as crop failures or reducedyields due to extreme weather events. These added stresses, when taken collectively, areprojected to alter the ecosystem and socioeconomic patterns and processes in ways that mostpeople in the region would consider detrimental. Much of the region’s fisheries, recreation,tourism, and commerce depend on the Great Lakes and expansive northern forests, whichalready face pollution and invasive species pressure that will be exacerbated by climate change.Most of the region’s population lives in cities, which are particularly vulnerable to climate changerelated flooding and life-threatening heat waves because of aging infrastructure and otherfactors. Climate change may also augment or intensify other stresses on vegetation encounteredin urban environments, including increased atmospheric pollution, heat island effects, a highlyvariable water cycle, and frequent exposure to new pests and diseases. Some cities in the regionare already engaged in the process of capacity building or are actively building resilience to thethreats posed by climate change. The region’s highly energy-intensive economy emits adisproportionately large amount of the gases responsible for warming the climate.Primary Issues for Midwest1: Impacts to AgricultureIncreases will continue in growing seasons,likely boosting some crop yields. Increases inextreme weather, number of very-hot days,flooding, and days without precipitation willlikely decrease other yields. Overall, Midwestproductivity is expected to decrease throughthe century.2: Forest CompositionRising air and soil temperatures, and variabilityin soil moisture will stress tree species. Forestcompositions will change as habitats are drivenNorthward by as much as 300 miles. Due tothese ecosystem disruptions, the region’sforests may cease acting as a carbon sink,exacerbating greenhouse gas emission impacts.2-23: Public Health RisksIncreases incident rate of days over 95 degrees,and humidity are anticipated to contribute todegradations in air and water quality. Each ofthese will increase public health risk, especiallyfor at-risk populations.4: Increased Rainfall and FloodingThe frequency and size of extreme rainfallevents and flooding has increased over the lastcentury. In addition, the number of dayswithout precipitation have increased. Thesetrends are expected to continue, causingerosion, declining water quality, and impacts onhuman health, and infrastructure.Bloomington Climate Risk and Vulnerability Assessment
According to the US National Climate Assessment, based on current emissions trends, by mid-century (2040 2070) the Midwest region is projected to experience a climate that is Hotter (Source: United States National Climate Assessment)(Source: United States National Climate Assessment)Bloomington Climate Risk and Vulnerability Assessment2-3
According to the US National Climate Assessment, based on current emissions trends, by mid-century (2040 2070) the Midwest region is projected to experience a climate that is Hotter with more rainThe Midwest can expect continued increases in annual average precipitation, the number of days with heavyprecipitation, making the wettest days of the year even wetter.(Source: United States National Climate Assessment) and droughtThe Midwest can also expect an increase in the average number of days between rainfall events. This,combined with heavier rain events which have a higher tendency of “runoff” means that the potential fordrought and reduced water tables will increase .(Source: United States National Climate Assessment)2-4Bloomington Climate Risk and Vulnerability Assessment
Section03Climate ChangeIn IndianaClick toReturn to TOCBloomington Climate Risk and Vulnerability Assessment3-1
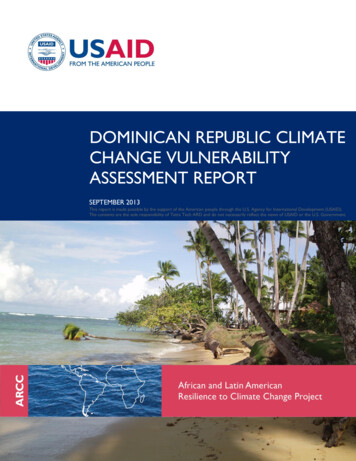
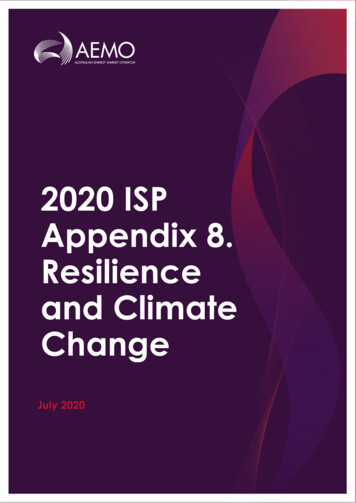
Climate Change in IndianaAnnual RainfallHeavier precipitation is a signature of climate change. For every 1 F of temperatureincrease, the atmosphere can effectively hold 4 percent more water vapor. So asthe world warms from the increase in greenhouse gases, the amount ofevaporation also increases from oceans, lakes, rivers, and soils. The extra watervapor is available to produce additional rain and snow, creating an environmentripe for heavy precipitation events.Indiana, home to a number of recent significant flooding events, has strong trendsin heavy precipitation events. The State has seen an increase in the magnitude ofheavy rain events - the top 1% annual rain events have increased over 20% in thevolume of water deposited since 1950.(Graphic Source: PurdueUniversity “Indiana’s Past &Future Climate: A Report fromthe Indiana Climate ChangeImpacts Assessment”)Observed Indiana Regional Precipitation andTemperature Data(Source: Midwest Economic Policy Institute “Climate Change and ItsImpact on Infrastructure Systems in Indiana”)Flooding Events byCounty in Indiana,1996-2016(Source: Midwest EconomicPolicy Institute “ClimateChange and Its Impact onInfrastructure Systems inIndiana”)3-2Bloomington Climate Risk and Vulnerability Assessment
Climate Change in IndianaObserved Annual Precipitation in IndianaThe observed annual precipitation across Indiana for 1895–2014,averaged over 5-year periods; these values are from NCEI’s version 2climate division dataset. Annual precipitation varies widely, but has beenabove average since 1990. The dark horizontal line represents the longterm average. Annual precipitation during the driest period on record(1940–1944) averaged 35.16 inches, while 46.03 inches was the annualaverage during the wettest period (2007–2011). Source: CICS-NC andNOAA NCEI.(NOAA National Centers for Environmental Information; State of IndianaSummary)Observed Extreme Precipitation Events in IndianaThe observed number of days with extreme precipitation events (annualnumber of days with precipitation above 2 inches) for 1900–2014,averaged over 5-year periods; these values are averages from 21 availablelong-term reporting stations. The dark horizontal line represents the longterm average. A typical station experiences between 1 and 2 such eventsper year. The number of extreme precipitation events has been aboveaverage since the late 1980s. Between 2005 and 2009, Indianaexperienced a record high number of events when stations averagedalmost 3 events annually. Source: CICS-NC and NOAA NCEI.(NOAA National Centers for Environmental Information; State of IndianaSummary)Inland Flooding Threat in IndianaBy 2050, Indiana is projected to see an increase of inlandflooding threat of 25 percent. With this increase, by 2050,Indiana is projected to be ranked 14th for inland floodingthreat within the United States.In Indiana, there are more than 270,000 people living inareas at an elevated risk of inland flooding(Threat is calculated by severity of flooding weighted by the State’sestimated flood vulnerable population)Summer Drought in IndianaAccording the the U.S. Drought Monitor, since 2000, thelongest duration of drought in Indiana lasted 42 weeksbeginning on July 23, 2002 and ending on May 6, 2003. Themost intense period of drought occurred the week ofAugust 7, 2012 where D4 droughts affected 25.0% ofIndiana land.By 2050, the severity of widespread summer drought isprojected to see an increase of up to 200 percent. Indiana isprojected to see an 105 percent increase for its index of theseverity of widespread drought by 2050. Vulnerability ofsoils to dry winters could increase the risk of multi-yeardroughts in Indiana.Threat is calculated by severity of drought(Sources: Purdue University “Indiana’s Past & Future Climate: A Report from the Indiana Climate Change Impacts Assessment”, University of Michigan,Climate Central, National Climate Assessment)Bloomington Climate Risk and Vulnerability Assessment3-3
Climate Change in IndianaAnnual TemperaturesAnnual temperatures have increased throughout Indianaover the last few decades. Typically, all seasons are warmingacross the US, with winter temperatures increasing thefastest. Indiana is no exception to this trend. Since 1981,Indiana temperatures have risen an average of 1.78 degreesin the winter and 0.81 degrees annually.There have been marked changes in temperature extremesacross the contiguous United States. The frequency of coldwaves has decreased since the early 1900s, and thefrequency of heat waves has increased since the mid-1960s.The number of high temperature records set in the past twodecades far exceeds the number of low temperature records.Even with the trend towards increasing temperatures for theregion, climate variability is anticipated which may createextreme fluctuations such as weakening of the Jet Streamand increased incidence of polar vortex “wobble” deliveringextreme cold to the region. Increased climate variability canhave significant impacts on trees, perennial agriculture (fruitand nut trees), insect populations/balance, and agriculturalimpacts. These trends are expected to continue and increase.Dangerous Heat Days in IndianaIndiana currently averages fewerthan 5 dangerous heat days a year.By 2050, the states is projected tosee almost 40 such days each year.Source: Climate Central(Graphic: Climate Central)(Source: “Indiana’s Agriculture in a Changing Climate: A Report fromthe Indiana Climate Change Impacts Assessment ”)3-4Bloomington Climate Risk and Vulnerability Assessment
Climate Change in IndianaAnnual Temperatures(Graphic Source: Indiana’s Multi-Hazard Mitigation Plan,Impacts of climate change on the state of Indiana)Bloomington Climate Risk and Vulnerability Assessment3-5
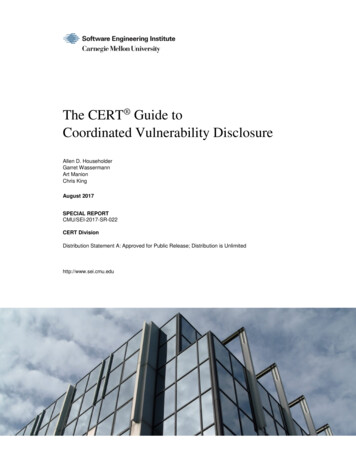
Climate Change in IndianaExtreme Heat Threat in IndianaBy 2050, Indiana is projected to see an increase in theExtreme Heat Threat of 275%. With this increase, by 2050,Indiana is projected to be ranked 20th for extreme heatthreat within the United States.(Threat is calculated by number of heat wave days multiplied by the State’sestimated extreme heat vulnerable population)(Graphic: Climate Central)Changing USDA ZonesIn addition to warmer weather, Indiana is experiencing less spring snow cover and earlier thaw dates resulting in morerapidly warming soil. The cumulative effects is a shift of USDA Hardiness zones to the North. In 1990 Central Indiana wasa Zone 5, today almost the entire State is a Zone 6.(Graphic Sources: “Indiana’s Agriculture in a Changing Climate: A Report from the Indiana Climate Change Impacts Assessment:, Arbor Day Foundation)Hardiness Zone Changes199020153-6Bloomington Climate Risk and Vulnerability Assessment
Climate Change in IndianaObserved Tornadoes In United States Since 1950Severe Weather - Observed Tornadoes in IndianaBy May of 2019, the US had experienced one of its worst tornadooutbreaks of the past decade, with more than 500 reported over 30 days,with the total year to date over 200 higher than average.Research by Proceedings of The National Academies of Science of TheUnited States of America, like the report “Robust increases in severethunderstorm environments in response to greenhouse forcing” byNoah S. Diffenbaugh, et al, has suggested that climate change will createconditions more favourable to the formation of severe thunderstormsand tornadoes. The chart to the right shows the path and numbers ofobserved tornadoes across the US since 1950. Overall, the number oftornadoes appears to be increasing, however, the increase is currentlyobserved only in weaker category storms.The study “Report Increased variability of tornado occurrence in theUnited States” by Harold E. Brooks, et al found that there has beenconsiderably more clustering of tornadoes in recent decades. In otherwords, there are more days in which multiple tornadoes occur, but feweroverall days with tornadoes.Records by the Indiana State Climate Office of Purdue University (shownbelow) appear to support the findings of this study, showing an increasein the number of lower category storms.(Sources: Perdue University State of Indiana Climate Office, State ofIndiana Multi-Hazard Mitigation Plan, Proceedings of The NationalAcademies of Science of The United States of America, Carbon Brief, )Observed Tornadoes In Indiana Since 1950(Sources: Purdue University, Indiana State Climate Office; )Bloomington Climate Risk and Vulnerability Assessment3-7
Climate Change in IndianaHuman AllergiesWith the shift in hardiness zones and increasing growing season, increases in pollen quantity and duration have beenexperienced and projected to continue. Beyond inflammation and irritation associated with allergic reactions, somestudies indicate pollen can affect the cardiovascular and pulmonary system. Since 1995, the State of Indiana hasexperienced an increase in allergy season of 10-15 days.(Graphic: Jaime Chrismar MPRnews.org)Vector Borne DiseaseVector borne diseases are spread through insects and are highly sensitive to climatic factors. Warmer weather influencessurvival and reproduction rates of vectors, in turn influencing the intensity of vector activity throughout the year. Theincrease in Lyme disease cases are an illustration of the impacts of a warming Indiana climate will have on vector bornedisease intensity.(Graphic: Jaime Chrismar MPRnews.org)Disease Cases From Ticks (2004-2006 reported)3-8Bloomington Climate Risk and Vulnerability Assessment
Section04Local ClimateChangeClick toReturn to TOCBloomington Climate Risk and Vulnerability Assessment4-1
Climate Change in BloomingtonThe climate in City of Bloomington has alreadychanged. From 1980 through 2018, the City hasexperienced an increase in annual averagetemperature, an increase in the number of daysabove 95 degrees, an increase in the number ofheavy rain events, and a decrease in the number ofdays below 32 degrees.Some of the most significant changes in the climaterelate to variability. Climate variability can be seenin the changes in annual precipitation forBloomington. Overall annual precipitation hasincreased, however, this increase is not evenlydistributed throughout the year. Spring and Fallprecipitation have increased up to 17%, whileSummer precipitation has decreased 2.45% andWinter precipitation has increased 3.22%.(Sources: “Hoosiers’ Health in a Changing Climate: A Report from theIndiana Climate Change Impacts Assessment ”, US Climate ResilienceLooking BackClimate Change Bloomingtonhas already experienced:Increase in annual averagetemperature (since 1895):Increase in annual precipitation(since 1895):Increase in heavy precipitation(Since 1980):Increase in Days above 95(Since 1980):Decrease in Days below 32(Since 1980):Increase in growing season:(Since 1980):2 F15%25%3 days-10 days10 daysToolkit, Climate Science Special Report, University of IndianaHoosier Resilience Index, US NOAA, Union of Concerned Scientists)Storm Weather EventsNumber of Events Reported In Monroe County:90 eventsFrom March 2009 to March 2019:96 events - an increase of 7%From March 1999 to March 2009:Average Annual Storm Weather Economic Damage 1999-2019:(source: NOAA National Centers for Environmental Information)The City ’s climate is anticipated to continue to warmthrough this century. Precipitation is anticipated toincrease in Spring and Fall while remaining the sameor decreasing in the Summer and Winter seasons.The primary changes to climate characteristics forthe City include: Warmer annual average temperatures witha more significant warming in wintermonths. Increase in extreme heat days. Increase in heavy rain fall events, withincrease in flood potential. Increase in time between precipitation withincrease in drought potential. Greater variability in temperature andprecipitation trends.(Sources: “Hoosiers’ Health in a Changing Climate: A Report fromthe Indiana Climate Change Impacts Assessment ”, US ClimateResilience Toolkit, Climate Science Special Report, University ofIndiana Hoosier Resilience Index, US NOAA, Union of ConcernedScientists)4-2 714,150Looking ForwardBy 2100, Bloomington Can Expect:Increase in annual averagetemperature:Change in annual precipitation:8-11 F-16 to 10%With SignificantSeasonal VariationIncrease in heavy precipitationevents:Increase in Days above 95:Decrease in Days below 32:Increase in growing season:Increase in Air Conditioning Demand:Bloomington Climate Risk and Vulnerability Assessment30% 70 days-52 days53 days40-50%
Climate Change in Bloomington - Extreme Heat(Graphic Source: The Indiana Climate Change Impacts Assessment, Purdue University)Bloomington Climate Risk and Vulnerability Assessment4-3
Climate Change in Bloomington - PrecipitationAccording to Purdue University’s report “”Extreme rainfall events, defined as having a daily rainfall total in the top 1 percent of all events, haveincreased over the last century and are expected to continue to do so. Heavy downpours contribute tosoil erosion and nutrient runoff, which affects both water quality and crop productivity. These events canalso overwhelm wastewater systems and create challenges for flood-control infrastructure.Averaged across the entire state, historically, an extreme rain event occurs when more than 0.86 inches ofrain falls in a day. Since 1900, the number of days per year with extreme rain has been increasing by 0.2days per decade on average. However, most of that increase has occurred since 1990. The northwesternpart of the state has seen the largest increase — a rate of about 0.4 days per decade.(Graphic Source: “”)4-4Bloomington Climate Risk and Vulnerability Assessment
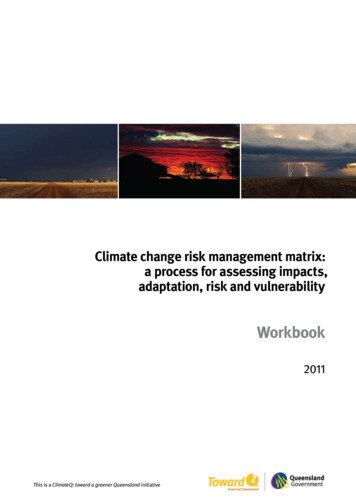
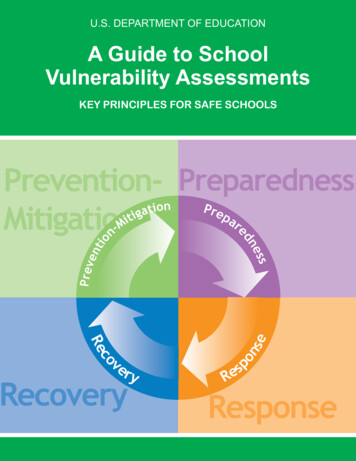
Climate Change in Bloomington - National Climate Assessment ProjectionsHow To Read These ChartsStarting from the left and moving towards the right, the dark gray bars which are oriented vertically indicate observed historic valuesfor each year. The horizontal line from which bars extend shows the county average from 1960-1989. Bars that extend above the lineshow years that were above average. Bars that extend below the line were below average. The lighter gray band, or area, shows therange of climate model data for the historical period – in other words, the lighter gray area shows the range of weather for the historicperiod.Starting from the left and moving right, the red toned band, or area, shows the range of future projections assuming globalgreenhouse gas emissions continue increasing at current rates. The darker red line shows the median of these projections. Forplanning purposes, people who have a low tolerance for risk often focus on this scenario.The blue toned band, or area, shows the range of future projections for a scenario in which global greenhouse gas emissions stopincreasing and stabilize. The darker blue line shows the median of these projections. Though the median is no more likely to predictan actual future than other projections in the range, both the red and blue lines help to highlight the projected trend in each scenario.Mean Daily MaximumTemperatureThis chart shows observedaverage daily maximumtemperatures for MonroeCounty from 1950-2010, therange of projections for thehistorical period, and the rangeof projections for two possiblefutures through 2100.Maximum temperature servesas one measure of comfort andsafety for people and for thehealth of plants and animals.When maximum temperatureexceeds particular thresholds,people can become ill andtransportation and energyinfrastructure may be stressed.(Source: US Climate Resilience Toolkit)Days with MaximumTemperature Above 95 FThis chart shows observedaverage number of days withtemperatures above 95 F forMonroe County from 19502010, the range of projectionsfor the historical period, andthe range of projections fortwo possible futures through2100. The total number ofdays per year with maximumtemperature above 95 F is anindicator of how often very hotconditions occur. Dependingupon humidity, wind, andaccess to air-conditioning,humans may feel veryuncomfortable or experienceheat stress or illness on veryhot days.(Source: US Climate Resilience Toolkit)Bloomington Climate Risk and Vulnerability Assessment4-5
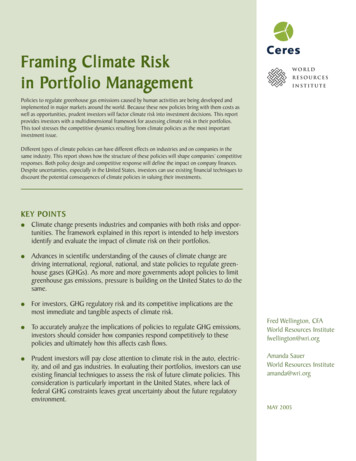
Climate Change in Bloomington - National Climate Assessment ProjectionsDays with MinimumTemperature Below 32 FThis chart shows observedaverage number of days withtemperatures below 32 F forMonroe County from 19502010, the range of projectionsfor the historical period, andthe range of projections fortwo possible futures through2100. The total number ofdays per year with minimumtemperature below 32 F is anindicator of how often colddays occur.Winter recreation businessesdepend on days with belowfreezing temperatures tomaintain snow pack.Additionally, some plantsrequire a period of days belowfreezing before they can beginbudding or blooming.(Source: US Climate Resilience Toolkit)Cooling Degree DaysThis chart shows observedaverage degree cooling daysfor Monroe County from1950-2010, the range ofprojections for the historicalperiod, and the range ofprojections for two possiblefutures through 2100. Thenumber of cooling degree daysper year reflects the amount ofenergy people use to coolbuildings during the warmseason.Cooling degree days arecalculated using 65 F degreesas the base buildingtemperature. On a day whenthe average outdoortemperature is 85 F, reducingthe indoor temperature by 20degrees over 1 day requires 20degrees of cooling multipliedby 1 day, or 20 cooling degreedays.4-6(Source: US Climate Resilience Toolkit)Bloomington Climate Risk and Vulnerability Assessment
Section05City on The MoveClick toReturn to TOCBloomington Climate Risk and Vulnerability Assessment5-1
City on The MoveProjected changes in annual average temperatures andgrowing seasons will result in a change in the overallclimate of Bloomington. Summertime conditions formid-twenty first century in Bloomington are projected tobe similar to the conditions currently felt 330 miles orfurther to the South.According to the University of Michigan Cities Impacts &Adaptation Tool, by 2040-70 summertime conditions inBloomington are anticipated to be similar to those todayup to 650 miles to the south in Dothan, Alabama; WarnerRobins, Georgia; Hattiesburg, Mississippi; andSummerville, South Carolina(Source: University of Michigan Cities Impacts & Adaptation Tool)19milesDistance southward the City ofBloomington’s climateexperience moves every year.Which is equal to moving275fee
The Population Vulnerability Assessment portion of this report describes how climate affects the region today, the changes and impacts expected over the coming decades, and identifies population vulnerabilities. 1-4 Bloomington Climate Risk and Vulnerability Assessment. Climate Change In The Midwest 2-1