Transcription
Climate change risk management matrix:a process for assessing impacts,adaptation, risk and vulnerabilityWorkbook2011This is a ClimateQ: toward a greener Queensland initiative
Prepared by:Queensland Climate Change Centre of ExcellenceDepartment of Environment and Resource Management203 Tor StToowoomba Qld 4350 State of Queensland (Department of Environment and Resource Management) 2011This document has been prepared with all due diligence and care, based on the best available information at the time of publication.The department holds no responsibility for any errors or omissions within this document. Any decisions made by other parties basedon this document are solely the responsibility of those parties. Information contained in this document is from a number of sourcesand, as such, does not necessarily represent government or departmental policy.The authors – June Brundell, David Cobon, Grant Stone (QCCCE)and Neil Cliffe (Department of Employment, Economic Development and Innovation).AcknowledgementsPhotos: Steve O’Connor, DEEDI Julia CreekDesign: Heather Lees, DEEDI RockhamptonPublished 2011Literature reviewNOT GOVERNMENT POLICY
ContentsSummary2Climate variability and climate change3Adaptation and mitigation4Risk, opportunity, vulnerability and adaptive capacity5Adaption process6Impact Risk Matrix7Vulnerability Matrix8Risk assessment using the Impact Risk Matrix9Step 1: Define area of interest and timescale boundaries9Step 2: Identify important climate change variablesfor your situation9Step 3: Assign likely changes in climate patterns10Step 4: Identify elements of the organisation10(business, region or industry)Step 5: Complete framework of the Impact Risk Matrix11Step 6: Describe climate change impacts11Step 7: Determine likelihood category for the impact11Step 8: Determine consequence category for the impact12Step 9: Assign impact risk in the Impact Risk Matrix13Vulnerability assessment using the Vulnerability Matrix14Step 10: Describe adaptation responses14Step 11: Determine adaptive capacity14Step 12: Assign level of vulnerability14Step 13: Prepare a risk or vulnerability statement15Step 14: Prepare action plan16References17Further reading and links17Impact Risk Matrix worksheet18Vulnerability Matrix worksheet19Literature reviewNOT GOVERNMENT POLICY1
SummaryRisk and Vulnerability Assessment ProcessYour situationStep 1: Define context – area and timescaleStep 2: Identify climate variablesStep 3: Assign likely changes in climate patternsStep 4: Identify key elements for yourorganisationFinalise climate variables and elementsElementsVariablesStep 5: Copy climatevariables andorganisation elementsto matrixRisk assessmentImpact descriptionStep 6: Describe impacts for each climatevariable and elementAnalysing risk or opportunityStep 7: Determine likelihood categoriesStep 8: Determine consequence categoriesStep 9: Assign impact riskVulnerability assessmentAdaptation descriptionStep 10: Describe adaptation responsesAnalysing vulnerabilityStep 11: Determine adaptive capacityStep 12: Assign level of vulnerabilityPrepare summary statementStep 13: Prepare risk or vulnerability statementsPrepare action plansStep 14: Prepare action plans2Managing climate variability is a challenge for allprimary industries in Queensland. The impactsof climate change we are currently experiencingand will experience in the future, impose yetanother challenge to the way we think about andmanage businesses, regions and industries in anuncertain environment.The science of global climate change is far fromsettled. Large uncertainties remain regarding therate of change and the scale and distribution ofimpacts. Less certain still is how we will respondas individuals and collectively to the problem.Although there is ample cause for concern, suchuncertainty also brings the opportunity for newdiscovery.The ‘risk matrix’ is one risk managementapproach that can help identify the impacts,adaptive responses and risk and vulnerabilityassociated with climate change. Identifying andanalysing risks and opportunities, using thisrisk management approach, can help to planresponses to climate variability and change andcan enable organisations to be proactive andmore effective in adapting to future uncertainty.This workbook, based on Australian climatechange impacts and risk management: a guidefor business and government1, will assist youthrough a structured process which identifies: impacts of climate change in the context ofyour organisation or situation the level of risk or opportunity presented bythose climate change impacts possible adaptation responses you couldimplement how vulnerable you are to any risk presentedby climate change how to communicate the key risks andvulnerabilities to others how you can develop an action plan to respondto the risk and vulnerability of climate change.Armed with this assessment and by revisiting itperiodically, you will be better prepared to takeaction and adapt to our variable climate andclimate change impacts.Literature reviewNOT GOVERNMENT POLICY
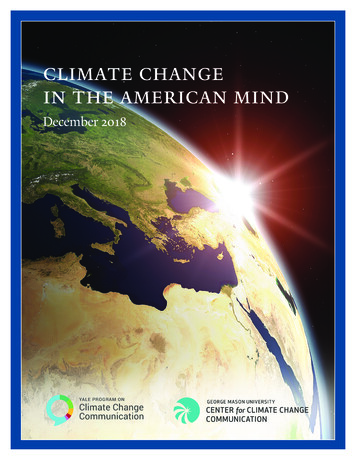
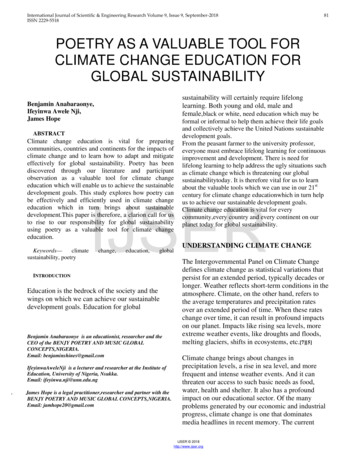
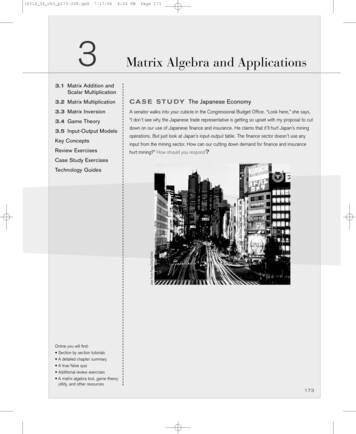
Climate variability and climate changeSome definitions and termsClimate is the average weather over time whichoccurs in a given location.Weather is day-to-day individual events whichmake up climate. These are partially determinedby the climatic systems and local conditions.Climate is what you expect;weather is what you get.2Climate variability is the natural variation in thepattern of the world’s weather. This is a naturallyoccurring process which is currently beingaccelerated by human activities. Australia has ahighly variable climate which varies day to day,year to year and decade to decade.What is climate change?How is it different to climate variability?( 5 to 40 days/year over 35 C) and fewer coolnights (0 to 12 nights/year under 0 C), higherpotential evaporation (2%), higher carbon dioxideconcentrations (70–100 ppm) and little change inrainfall (annual, summer and autumn) in the farnorth, and decreases of 2–5% elsewhere (annual,summer and autumn).These changes are relative to 1960–1990 valuesand there are differences between regions andseasons.Climate change is the change in the world’sclimate over time. This is a process which occursnaturally but which is currently being acceleratedby human activities.The science: Australia is experiencing rapidclimate change. Since the middle of the twentiethcentury, Australian temperatures have, onaverage, risen by about 1 C with an increase inthe frequency of heatwaves and a decrease inthe numbers of frosts and cold days. Rainfallpatterns have also changed – the north-west hasexperienced an increase in rainfall over the last50 years while much of eastern Australia andthe far south-west have experienced a decline.3The climate in northern Australia is projected tobecome warmer (0.7–1.2 C), with more hot daysFigure 1. Historical change in annual rainfall across Australia 2Consider how climate variability has affected your organisation (business, region or industry) in the past.a) Write down one example of a climate event which affected you in the past? E.g. floods in 2010.Q1b) What was the impact of this event? E.g. reduced access to property and markets.Q2How have historical changes in climate affected your organisation (business, region or industry)? E.g.tropical grasses are dominating temperate varieties due to higher temperatures.Literature reviewNOT GOVERNMENT POLICY3
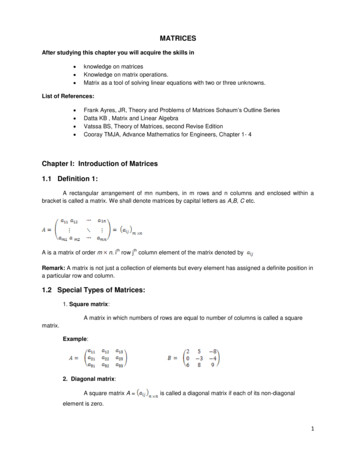
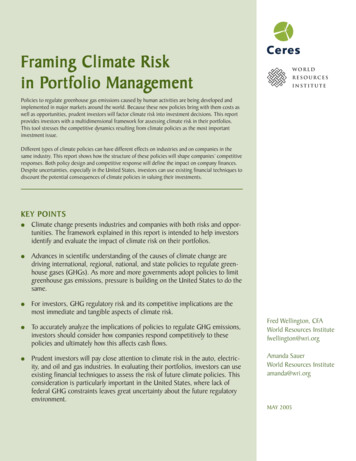
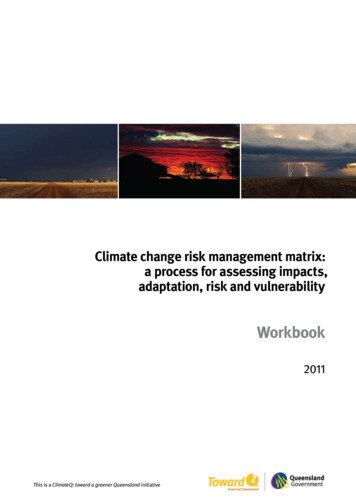
Adaptation and mitigationSome definitions and termsWhat are adaptation and mitigation?What are the different types of change?There are roles for both adaptation and mitigationin climate change. The world is committed to acertain amount of climate change, even if we wereto stop emitting greenhouse gases immediately.This means that in the short term we need toadapt to our changing climate. This will alsoassist in the management of Australia’s highclimate variability.Agricultural resource use sheepequivalents (millions)300250DroughtSheepCattleCrop150Wool floor price up 70%100End of the wool floor -0750Sheep equivalents:Beef cattle 8 sheepDairy cattle 12 sheepIncremental change is largely maintainingexisting activities and building on existingtechnologies; it is both reactive and proactive.Transformational change involves major changesin enterprises, land use and human and socialcapital; it is largely proactive and strategic(see Figure 2).US and Japan introduce beefimport restrictions200Adaptation is a process where actions areadjusted to adapt to the impacts of the changingclimate. Adaptation actions are immediatesolutions to the impacts of a changing climate.These actions may include changing managementsystems, the mix of enterprises in a businessand the type of enterprise (grain, beef, sheep).Adaptation can be either incremental ortransformational.Mitigation prevents or slows the rate of climatechange and contributes to lowering the finallevel of global warming we experience. Mitigationactions are long-term solutions to global warmingand are often based on new technologies andgovernment policies, and include measures suchas emissions trading, carbon abatement andcarbon sequestration.1 ha crop 12 sheepFigure 2. Historical trends in agricultural resource useshowing transformational adaptation of rural enterprisesto market and climate forces in the mid 1970s, early1980s and early 1990s. 4Q3What mitigation activity could you implement in your organisation (business, region or industry) toreduce greenhouse gas levels? E.g. the planting of tree strips to store carbon.Q4What responses do you think may be suitable for your organisation (business, region or industry) to adaptto climate change? E.g. building deeper dams with greater capacity; better managing climate variability.4Literature reviewNOT GOVERNMENT POLICY
Risk, opportunity, vulnerabilityand adaptive capacitySome definitions and termsRisk is a hazard or the chance of a loss. Riskcan be assessed by considering both theconsequence of an event occurring and likelihoodthat the same event occurs.Opportunity is a benefit that may be identifiedthrough the process of risk assessment. Climatechange will produce some positive impacts thatmay provide opportunities to improve economic,environmental and social outcomes.Adaptive capacity is the ability of a system toadjust to climate change, to moderate potentialchanges, to take advantage of opportunities or tocope with negative consequences.Vulnerability is a combination of exposure,sensitivity and capacity to adapt to the changingclimate. The degree of exposure and sensitivitygives rise to the potential impact, and thecombined effect of potential impact and adaptivecapacity gives rise to vulnerability. A riskassessment process such as the ‘risk matrix’ is astructured way of identifying impacts, adaptiveresponses and vulnerability to climate change.Likelihood of a climate change impact occurringcan be identified as either almost certain, likely,possible, unlikely or rare. The impact mightWhat do I find out from the process ofrisk assessment?What does the process of risk assessmenttell me about my business?happen only once, such as the permanent lossof an endangered animal or a plant speciesbut others may be recurring events such asreduced income or ground cover caused bydrought. Examples can be used to describe thesecategories in more detail which helps associatethe impact with the most appropriate likelihoodcategory (see page 11).Consequence of a climate change impact canbe identified as either minor, moderate, major,severe or catastrophic. Examples can be usedto describe these categories in more detailwhich helps associate the impact with the mostappropriate consequence (see page 12).Impact is the likely effect of a climate changevariable on an element of the relevantorganisation (business, region or industry).Q5What do you think may be a risk to your organisation (business, region or industry) as a result ofclimate change? E.g. reduced growth of pasture leading to decreased stock production; reducedpersistence of temperate pasture species; decreased quality of tropical pastures.Q6What may be an opportunity for your organisation (business, region or industry) as a result of climatechange? E.g. increased growth of cool season pastures.Literature reviewNOT GOVERNMENT POLICY5
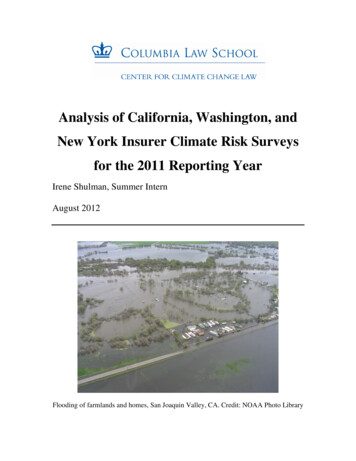
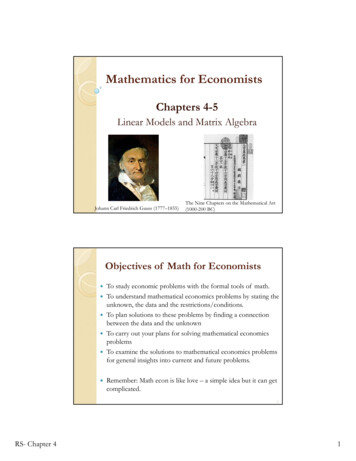
Adaptation processWhat is adaptation?How is it related to risk assessment?Adaptation is a process we undertake throughoutour lifetimes in response to change. Businessesuse adaptation to reposition themselvesto better respond to opportunity and risk.Governments adapt by changing policies andprograms to achieve broad societal goals.Likewise, individuals, business, regions, andthe community can adapt to climate change andthe adaptation process is an effective way ofachieving this.Successful implementation of adaptationresponses requires knowledge of the system ofinterest, assessment of the risk and adaptiveresponses, briefing policy makers on risks andvulnerability, monitoring and evaluating therelevance, ongoing need and implementation ofthe responses, raising awareness of the futureclimate and the risks and opportunities andbuilding capacity of the community to respond tothe risks and opportunities that climate changemay deliver (see Figure 3).A risk or vulnerability statement is a meansof communicating climate change risks,vulnerabilities and adaptive responses to a rangeof decision makers who are likely to implementthem in management decisions or governmentpolicy (e.g. land managers, regional groups,industry bodies, State and Federal Governments).An example of a risk statement follows:The extreme risk to the grazing industry ofmore and prolonged drought could lead tolost viability of grazing enterprises in marginalregions and loss of biodiversity in fragileecosystems.This level of risk requires an immediateresponse from the most senior levels of industryleadership, agency management, policydevelopment and government representatives.This risk can potentially be mitigated throughapplication of seasonal and decadal climatevariability technologies, more certainty inregional climate change projections andanalysis for policy makers on exceptionalcircumstance reform, adaptation grants, timelimited income support and exit grants to leavethe land.Knowledge, Data, Toolse.g. integrated assessment modelsAwareness Raising& Capacity Buildinge.g. training ofregional stakeholdersIdentify gaps in knowledgeand priorities for R&DRiskAssessmentse.g. drought riskImplementationof adaptation responsesEvaluation &Monitoring forfeedback and change“Mainstreaming”adaptationinto NRM plans, policies, strategiesFigure 3. The adaptation process 56Literature reviewNOT GOVERNMENT POLICY
Impact Risk MatrixThe process of developing the Impact RiskMatrix is a structured way of identifying impacts,risks, and opportunities associated with climatechange.An Impact Risk Matrix (an example for the grazingindustry is given in Table 1) describes the impactsof climate change variables (y-axis) on elementsof a business, region or industry (x-axis).The colour coding in each cell shows either thenegative (brown) and positive (blue) impacts,or the confidence that scientists place in theWhat is an ‘Impact Risk Matrix’?projections for the climate variables (red is higherconfidence, yellow is lower confidence – seepage 9 for definitions). Darker degrees of brownand blue colouring identify impact risk (negativeand positive) of greater magnitude, that havebeen assessed by considering the likelihood andconsequence of these impacts occurring.Table 1. A completed Impact Risk Matrix describing the impacts and showing the risk and opportunities of climatechange on elements of the grazing industry 6. A colour key for red, orange and yellow is given in Table 3, and for blue and brown in Table 7.Element ofthe industryPasture growthSurface coverPlant availablewater capacityWind erosionRural human healthand well-beingBiodiversityIncreased winderosion due tolower surfacecoverLarge decreases inrural human healthand capacity to copeat current rate offunctioningChanges inplant structureand speciescompositionLarge decreasein human health,potential for stressrelated incidenceMajor changesin plant andanimal speciescompositionMore daysover 35 CDecrease inpasture growthDecrease insurface coverReduced plantavailable watercapacity due to areduction in wateravailability/surfacecoverMoredroughtsSevere reductionin pasturegrowthSeverereduction insurface coverSevere reductionin plant availablewater capacity dueto reduction in wateravailability/surfacecoverIncreased winderosion due tolower surfacecoverIncreasedstorm intensity– same totalrainfallDecrease inpasture growthDecrease insurface coverDecrease in plantavailable watercapacityIncreased winderosion due tolower surfacecoverNo changeChanges in insectand plant speciescomposition,siltation ofwaterholesDecrease inwinter rainfallMinor decreasein pasturegrowthMinor decreasein surface coverMinor reductionin plant availablewater capacitydue to lower wateravailability/surfacecoverMinor increase inwind erosion dueto lower surfacecoverMinor decrease inrural human healthMajor changesin plant andanimal speciescompositionDecreasein summerrainfallSevere reductionin pasturegrowthSeverereduction insurface coverReduced plantavailable watercapacity dueto lower wateravailability/surfacecoverSevere increasein wind erosiondue to lowersurface coverLarge decreasein human health,hardship andwelfare, potentialfor stress relatedincidenceChanges inplant andanimal speciescompositionIncrease inpasture growthDecrease insurface coverDecrease in plantavailable watercapacity due tolower surface coverIncreased winderosion due tolower surfacecoverDecrease in humanhealth and welfarerelated issuesChanges inplant structureand speciescompositionDecrease inpasture growthdue to higherevaporation anderosion of topsoilespecially in aridand semi-aridregionsDecreasedsurface coverdue to higherevaporation,erosion oftopsoilDecrease in plantavailable watercapacity due tolower surface cover(reduced infiltrationinto soil)Increased winderosion due tohigher peak windspeedsDecrease in humanhealth and increasein welfare relatedissuesDamage to sometree and animalspeciesReduction inpasture growthDecrease insurface coverDecrease in plantavailable watercapacityIncreased winderosionDecrease in humanhealth and increasein welfare relatedissuesGeneral negativelong-term effectson ecosystemfunctionMorewildfiresHigher peakwind speedsOverallestimate forthe risk averseLiterature reviewNOT GOVERNMENT POLICY7
Vulnerability Matrixdescribes the way in which a business, region orindustry could respond to the risks identified inthe Impact Risk Matrix.What is a ‘Vulnerability Matrix’?The Vulnerability Matrix identifies adaptationresponses to the risks of climate changeand determines the level of vulnerability.Vulnerability is influenced by both impact riskand adaptive capacity. A completed VulnerabilityMatrix (for the grazing industry in Table 2)In addition, the white and pink colour codingin each cell shows the degree of vulnerability(nil, low, moderate or high). White indicates novulnerability, light pink (low vulnerability), middleshade of pink (moderate vulnerability) and darkpink (high vulnerability). This is discussed furtheron page 14.Table 2. A completed Vulnerability Matrix describing the adaption responses and showing the vulnerability to climatechange on elements of the grazing industry 6. A colour key for red, orange and yellow is given in Table 3, and for pink in Table 8.Element ofthe industrySurface coverPlant availablewater capacityWind erosionRural human healthand well-beingBiodiversityMore daysover 35 CDecrease cattle/sheep in thewarm/dry seasonto maintainpastures; manageutilisation earlyin the growingseasonDecrease totalgrazing pressure(TGP) to maintaincoverMaintain basalarea and adoptsustainablestocking rate toincrease waterstorage in soilprofile for deeprooted pasturespeciesMaintain basalarea and groundcover to reducedryness andexposure ofsurface soilIncrease availabilityof health servicesin rural regions;change work-daystructure andamenityManage invasiveplant species;maintain refugiaMoredroughtsDecrease cattle/sheep to maintainpastures; manageclimate variabilityto help adjustanimal numbersDecrease TGP tomaintain cover;Manage climatevariability to helpadjust animalnumbersMaintain basalarea and adoptsustainablestocking rate toincrease waterstorage in soilprofileMaintain basalarea and groundcover to reducedryness andexposure ofsurface soilIncrease availabilityof health servicesin rural regions;Counselling servicesavailable; Grantsfor adaptation andfurther education;Income supportManage invasiveplant species;maintain refugiaIncreasedstorm intensity– same totalrainfallDecrease cattle/sheep in thewarm/dry seasonto maintainpastures;Maintain biomassfor optimalinfiltrationDecrease TGP tomaintain cover;Use erosionmitigationstrategiesMaintain basalarea and adoptsustainablestocking rate toincrease waterstorage in soilprofileMaintain basalarea and groundcover after stormsto reduce furthererosion in thefollowing dryperiodNo significantaction requiredManage invasiveplant species;maintain refugiaDecreasein summerrainfallDecrease cattle/sheep to maintainpastures; manageclimate variabilityto help adjustanimal numbers;Manage nondomestic grazingpressureDecrease TGP tomaintain cover;Manage climateto help adjustanimal numbersMaintain basalarea and adoptsustainablestocking rate toincrease waterstorage in soilprofileMaintain basalarea and groundcover to reducedryness andexposure ofsurface soilIncrease availabilityof health servicesin rural regions;Counselling servicesavailable; Grantsfor adaptation andfurther educationManage invasiveplant species;maintain refugiaMorewildfiresFirepreparedness;Rotate paddocksof heavier grazingas fire breaksDecrease TGP tomaintain cover;Use erosionmitigationstrategies; Usecontrolled firesMaintain basalarea and adoptsustainablestocking rate toincrease waterstorage in soilprofileLimited ability tomanage in winderosion areasIncrease in needfor governmentsupportIncreasepatchiness andreduce extremeintensity andsize; managerefugiaDecrease TGP tomaintain coverMaintain basalarea and adoptsustainablestocking rate toincrease waterstorage in soilprofileMaintain basalarea and groundcover to reduceexposure ofsurface soilTidiness in localamenity and generalwelfare and safetyawarenessManage invasiveplant species;maintain refugia;monitor forinvasive insectbiotaHigher peakwind speeds8Pasture growthProvide shelterbeltsLiterature reviewNOT GOVERNMENT POLICY
Risk assessment using theImpact Risk MatrixRisk assessment: steps 1 and 2Step 1Define area of interest and timescale boundariesWhat physical area do you wish to cover in your risk assessment? E.g. your property/region/state.What timescale do you wish to address in your risk assessment? E.g. 2030/2050/2070/2100.Step 2 Identify important climate change variables foryour situationThese are listed in Table 3.The confidence that scientists place on the projection for each climate variable also differs (Table 3).Record the six most relevant climate change variables and rank them from 1–6 (1 is most importantand 6 least important).Table 3. List of climate change variables and the level of confidence in projections 7Your level of priorityClimate change variableElevated CO2Increased evaporationLevel of confidenceVery high confidence ( 90%)Higher minimum temperatureLess frostHigher maximum temperatureHigh confidence ( 90%)More days over 35 CelsiusMore droughtsIncreased storm intensityDecreased winter rainfallMedium – high confidence ( 70%)Decreased summer rainfallIncreased storm frequencyMore wildfiresModerate confidence ( 50%)Higher peak wind speedsLiterature reviewNOT GOVERNMENT POLICY9
Risk assessment: steps 3 and 4Step 3Assign likely changes in climate patternsUse the climate change summary for your region (see Regional Climate Change Summary 8) anddetermine the likely changes in the climate change variables chosen in step 2 based on the spatial andtimescale boundaries you selected in step 1.Determine the likely changes for the 3 most important climate change variables e.g. decreasedsummer rainfall by five per cent, increased maximum temperature by 1.5 C.Write these in the space below.Step 4Identify elements of the organisation(business, region or industry)Consider which elements of your business, region or industry that may be affected by the changingclimate. These should include issues which affect production, natural resources and social aspects.Examples from the grazing industry include (but are not limited to) pasture growth, surface cover, woolper head, beef per head, gross margins, biodiversity, human health and well-being.List in the table below these elements of your business, region or industry that are importantdeterminants of production, natural resource sustainability and social well-being, and then prioritisethe three most important (1 being the highest and 3 the lowest importance).Table 4. Elements of the organisation affected by climate changeElementsPriorityProduction driversNatural resource driversSocial or lifestyle drivers10Literature reviewNOT GOVERNMENT POLICY
Risk assessment: steps 5, 6 and 7Step 5 Complete framework of the Impact Risk MatrixAdd the climate variables and elements of the organisation to the Impact Risk Matrix worksheet.Use the empty Impact Risk Matrix worksheet at the back of the booklet, and in cells a, b and c enter the three most important elements of the business, region or industry whichwere identified in Step 4, and in cells d, e and f enter the three most important climate change variables identified in Steps 2and 3.Step 6 Describe climate change impactsConsider and record in the Impact Risk Matrix worksheet the expected impact of each climate changevariable for each element of the organisation. Do this independently of the other influences.Step 7 Determine likelihood category for the impactUsing Table 5, consider the likelihood of the climate change event occurring being in one of thefollowing categories either almost certain, likely, possible, unlikely or rare.The impact might happen only once, such as the permanent loss of an endangered animal or a plantspecies but others may be recurring events such as reduced income or ground cover caused bydrought (Table 5).Record the likelihood category in the space provided in each cell of the Impact Risk Matrix worksheet.Table 5. Likelihood categories describing the occurrence of each impactRatingRecurrent eventsSingle eventAlmost certainCould occur several times per yearMore likely than not– Probability greater than 50%LikelyMay arise about once per yearAs likely as not– 50/50 chancePossibleMay arise once in 10 yearsLess likely than not but still appreciable– Probability less than 50% but still quite highUnlikelyMay arise once in 10 years to 25 yearsUnlikely but not negligible– Probability low but noticeably greater than zeroRareUnlikely during the next 25 yearsNegligible– Probability very small, close to zeroLiterature reviewNOT GOVERNMENT POLICY11
Risk assessment: step 8Step 8Determine consequence category for the impactConsider the consequence of the impact if the climate change event occurred. Consequence categoriesrange from catastrophic to minor (Table 6).Write the consequence category in the space provided in each cell of the Impact Risk Matrix worksheet.Table 6. Consequence categories for assessing impact risk for economic, natural resource and social success criteriaProfitability andgrowthNatural resourcesustainability andenvironmentSupply chain andmarketLifestyle andcommunityPublic safetyCatastrophicBusiness would beunprofitable andcontract markedlymaking it unviable.Business wouldhave to be woundup.Extreme,permanent andwidespread lossof environmentalamenity andprogressiveirrecoverableenvironmentaldamageLoss of a keysource of supplyor marketthreatening thebusinessThe region wouldbe seen as veryunattractive,moribund andunable to supportits communityLarge numbersof seriousinjuries or lossof livesSevereBusiness would beunprofitable andcontract markedlyand would likelybecome unviableeven withsignificant remedialactionSevere, semipermanent andwidespread lossof environmentalamenity andlikelihood ofirrecoverableenvironmentaldamageSevere disruptionof a key source ofsupply or markethaving a seriouseffect on thebusinessSevere andwidespreaddecline inservices andquality of lifewithin thecommunitySerious injuriesor loss of livesoccurs routinelyMajorThe business wouldbe unprofitable andcontract and requiresignificant remedialaction to remainviableMajor, semipermanent lossof environmentalamenity anddanger ofcontinuingenvironmentaldamageMajor disruptionof a key sourceof supply ormarket having asignificant effecton the businessMajor andwidespreaddecline inservices andquality of lifewithin thecommunityIsolatedinstances ofserious injuriesor loss of livesModerateThe business wouldonly be marginallyprofitable withgrowth stagnantComponents ofthe supply chainIsolated butand market wouldsignificantrequire more thaninstances ofnormal levelsenvironmentaldamage that might of managementattention tobe reversed withprotect theintensive effortsbusinessGeneralappreciabledecline inservicesSmall numbersof injuriesMinorThe business isprofitable andgrowth is achievedbut they both fail tomeet expectationsMinor instancesof environmentaldamage that couldbe reversedIsolateddifficulties wouldarise in thesupply chain andmarket but wouldbe resolvedIsolated butnoticeableexamples ofdecline inservicesSerious nearmisses or minorinjuries12Literature reviewNOT GOVERNMENT POLICY
Risk assessment: step 9Step 9 Assign impact risk in the Impact Risk MatrixUsing Table 7 combine likelihood (Step 7) and consequence (Step 8) categories to derive the level ofimpact risk.Record the impact risk in the Impact Risk Matrix worksheet. The o
Literature review NOT GOVERNMENT POLICY 1 Contents Summary 2 Climate variability and climate change 3 Adaptation and mitigation 4 Risk, opportunity, vulnerability and adaptive capacity 5 Adaption process 6 Impact Risk Matrix 7 Vulnerability Matrix 8 Risk assessment using the Impact Risk Matrix 9 Step 1: Define area of interest and timescale boundaries 9