Transcription
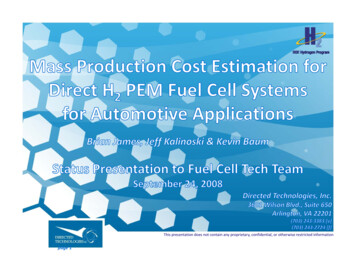
This presentation does not contain any proprietary, confidential, or otherwise restricted informationpage 1
OverviewTimeline Base Period:–– 100% completeFeb 17, 2006 to Feb. 16, 2008Barriers Option year 1 of 3:––65% completeStarted Feb 16, 2008DOE Cost TargetsBudget Total project funding––– Manufacturing costsMaterials costs (particularly preciousmetal catalysts) 325K (2 year base period) 182k (opt. yr. 1)Contractor share: 0Funding for FY 2008– 182kpage 2CharacteristicUnits2008 2010 2015Stack Cost /kWe (net)- 25 15System Cost /kWe (net)- 45 30Collaborations Extensive interaction withindustry/researchers to solicit design &manufacturing metrics as input to costanalysis.
Project Timeline Work since the AMR has been researching and applying changes to the determine 2008 systemPrimary focus was BOP componentsBipolar plate coatings and alternative gasketing methods were also improvedpage 3
Objectives1.22.3.Identifyd if theh lowestlcost system designd i anddmanufacturing methods for an 80 kWe direct‐H2automotive PEMFC system based on 3 technology levels: 2008 status technologygy 2010 projected technology 2015 projected technologyDetermine costs for these 3 tech levelsystems at 5 production rates: 1,000 vehicles/year 30,000 vehicles/year 80,000 vehicles/year 130,000 vehicles/year 500,000 vehicles/yearAnalyze, quantify & document impactof system performance on cost Use cost results to guide futurecomponent developmentpage 4FuelStorageBatterySystemFuel CellSystemTIMTractionElec. MotorProject covers complete FC system(specifically excluding battery, tractionmotor/inverter, and storage)
General Rules 80kWnet system (90 kWgross for 2008 system) 1k to 500k annual system production U.S. labor rates: 60/hr (fully loaded) 1,100/troy oz. Pt cost used for consistency (currently 1,370/troy oz.)Some costs NOT included: 10% capitalpcost contingencyg y Warranty Building costs (equipment cost included but not building in which equipment is housed) Sales Tax Non‐Recurring Engineering Costspage 5
DTI’s DFMA ‐Style Costing Methodology DFMA (Design for Manufacturing and Assembly) is a registeredWhat is DFMA ?trademark of Boothroyd‐Dewhurst, Inc. Used by hundreds of companies world‐wide Basis of Ford Motor Co. design/costing method for past 20 years DTI practices are a blend of: “Textbook”Textbook DFMA , industry standards & practices,practices DFMA software,softwareinnovation and practicalityEstimated Cost (Material Cost Processing Cost Assembly Cost) x Markup FactorManufacturing rate cost factors:1.2.33.4.Methodology Reflects Cost of Under‐utilization:Material CostsManufacturing MethodMachine RateTooling AmortizationCapital CostInstallationMaachine Rate, /mminInitialExpensesMaint./Spare achine Utilization (of 14 hr day)page 61 Equipment Life Interest Rate Corporate Tax aymentsRepaymentAnnual Minutes ofEquipment Operation 20Used to calculateannual CapitalRecovery Factorbased on: Machine Rate( /min)
Key Technical Targets Define System2007 Status 2008 Status 2007 Status 2008 Status 2007 Status 2008 StatusCurrentDOE Tech. Targets that drive analysis:Stack Efficiency @ Rated PowerMEA Areal Power Density @ Peak PowerTotal Pt‐Group Catalyst Loading2010(2007, 000.300.300.200.20mg tmt232.3232.3202.0202.0151.5151.5mW/cm2Key Derived Performance Parameters:System Gross Electric Power (Output)Active AreaCell Voltage @ Peak PowerOperating Pressure (Peak)2 A few key DOE Technical Target values are used to anchor system definition Allll otherh system parameters flowfl fromfDTI calculationsl l& judgmentdpage 7
System Comparison2008 Technologygy22010 Technologygy2015 Technologygy525 (was 583)1,0001,0000.21 (was 0.35)0.30.22.321.570‐9099120Nafion on ePTFEAdvanced High‐Temperature MembraneAdvanced High‐Temperature MembraneAluminum Radiator,RadiatorSmaller Aluminum RadiatorRadiator,Smaller Aluminum Radiator,RadiatorRadiator/Cooling SystemWater/Glycol coolant,Water/Glycol coolant,Water/Glycol coolant,DI filterDI filterDI filterStamped SS 316 (uncoated)Stamped SS 316 (uncoated)Stamped SS 316 (uncoated)Bipolar PlatesFuture options: SS 304 with CoatingFuture options: SS 304 with CoatingFuture options: SS 304 with CoatingCentifugal Compressor,Centifugal Compressor,Twin Lobe Compressor,Air CompressionTwin Lobe ExpanderRadial Inflow ExpanderNo ExpanderCarbon Paper Macroporous Layer withCarbon Paper Macroporous Layer withCarbon Paper Macroporous Layer withGas Diffusion LayersMicroporous layer applied on topMicroporous layer applied on topMicroporous layer applied on topDouble‐sided vertical die‐slot coating ofDouble‐sided vertical die‐slot coating ofDouble‐sided vertical die‐slot coating ofCatalyst ApplicationmembranemembranemembraneAir HumidificationWater spray injectionPolyamide MembraneNoneNNoneNNoneNNoneH2 HumidificationfExhaust Water RecoverySS Condenser (Liquid/Gas HX)SS Condenser (Liquid/Gas HX)NoneInjection molded Viton MEA Frame aroundInjection molded Viton MEA Frame aroundInjection molded Viton MEA Frame aroundMEA ContainmentHot‐Pressed MEAHot‐Pressed MEAHot‐Pressed MEACoolant & End GasketsScreen Printed ResinScreen Printed ResinScreen Printed ResinDrain water at shutdownDrain water at shutdownFreeze ProtectionDrain water at shutdown2 forf FC systemf FC system1 forH2 Sensors1 for passenger cabin (not in cost estimate)1 for passenger cabin (not in cost estimate)None1 for fuel system (not in cost estimate)1 for fuel system (not in cost estimate)End Plates/CompressionComposite molded end plates withComposite molded end plates withComposite molded end plates withSystemcompression bandscompression bandscompression bands5 hours of power conditioning ‐ from UTC's US 4 hours of power conditioning ‐ from UTC's US 3 hours of power conditioning ‐ from UTC's US/ yConditioninggStack/SystemPatent #7,078,1180 8 118Patent #7,078,1180 8 118Patent #7,078,1180 8 118Power Density (mW/cm )Total Pt loading (mg/cm2)Operating Pressure (atm)Peak Stack Temp. ( C)Membrane Materialpage 8
Different Technology SchematicsNot Included inCost AnalysisPRD2008PCompressedHydrogen Tank PressureRegulatorRegulatorProportionalValveNot Included inCost AnalysisCompressedHydrogen TankPRDPressureTransducerH2 Purge Valve2010PressureTransducerPneumaticControl ValveH2 Purge ValveHigh Flow Hydrogen EjectorHigh Flow Hydrogen EjectorExhaustGas toTailPipeLow Flow Hydrogen EjectorAnodeExhaustWaterPurgeWaterReservoirLow Flow Hydrogen EjectorAnodeExhaustReactant AirReactant AirWater DI WaterFilterPumpAir FilterAir FilterFC C StacksAir ifierAir MassFlowSensorExhaust Gasto Tail PipeMotorCathodeExhaustWater SprayAir HumidifierThermocoupleWaterSumpPumpCoolantDI FilterCondensorLHigh TempR di t SRadiatorSystemtC l tCoolantReservoirCoolantCl tPumpThermostat& ValveLevelSensorCoolant CoolantReservoir PumpCoolant BypassLow TemperatureRadiatorNot Included inCost AnalysisCompressedHydrogen TankPressureTransducer2015PRD PneumaticControl ValveH2 Purge ValveHigh Flow Hydrogen EjectorLow Flow Hydrogen EjectorAnodeExhaustReactant AirAir FilterFC emCoolant 3 way valveWaterPumpCoolant BypassCoolantThermostatRadiatorSystemCoolant CoolantReservoirRiPPumpCoolant 3 way valveCoolant Bypasspage 9Air MassFlowSensorMotorChanges from 2008 to 2010: Highergtemperature,p, smaller radiator Use of membrane humidifier (instead of water spray) Lower pressure Centrifugal compressor/expander (instead of twinlobe compressor)Changes from 2010 to 2015: Higher temperature, smaller radiator No humidification Lower pressure Smaller compressor No expander
PEM Fuel Cell Stack Abridged to 2 cells (from 186) for clarity 1:1 ratio of cooling to active cellspage 10
Platinum CostMonthly UMUSD/Troy OOunce 2,500 2,000 1 500 1,500 1,000PlatinumDOE Pt Cost ( 1,100) 500 urrently trading at 1,235/tr.oz.Platinum cost is highly variable:3/04/08: 2,280/tr.oz.9/16/08: 1,105/tr.oz. (almost back to our 1,100 value!) Consistent use of 1,100 facilitates “apples‐to‐apples” system costs comparisonEspecially for the current technology system, Pt is a major system cost component, so estimatesare highly susceptible to Pt cost fluctuationspage 11
Noteworthy Changes Since Last YearCurrent Technology,Technology 500,000500 000 Systems/YearItemNotesTechnology LevelChanged baseline to "2008"H2 SensorsUpdated the Hydrogen sensor pricesSystem ControllersSwitched from 2 controllers to 1Belly PanAdded new DFMA analysisPower DensityChanged MEA Areal Power Density to 525 mW/cm2Catalyst LoadingChanged Total PlatinumPlatinum-GroupGroup Catalyst Loading to 0.21 mg/cm2Machine LifetimesReview and standardization of Machine LifetimesWiringAdded new analysisMEA FrameUpdated Material costs, improved calculationsMembranee ba eC a ged membraneChangede b a e tthicknessc essHumidifierImproved Water Spray Humidifier cost estimateBipolar PlatesUpdated 316L and 304 sheet metal prices from Allegheny LudlumCoolant & End GasketsSwitched to Screen Printed Coolant & End GasketsStartupp BatteryyRemoved the Startupp Batteryy from the analysisyLow Temp. Radiator LoopReduced to 67% of cost to account for duties not included in analysisMiscellaneousNumerous small changesTotal System Cost ( /kWnet)page 12Effect on SystemCost( /kWnet)( 1 25)( 1.25)( 2.50)( 0.21) 4.92( 12.36)( 0.05) 0.03 1.80( 0.08)( 0.33) 0.73( 4.06)( 0.63)( 0.70) 1.80( 12.89)
MEA Frame‐Gasket ConceptMEA with Integrated SealInsertion molding of gasket around MEAD P t Viton DuPontVit GF‐SGF S w/filler/fill & curingi additivesdditi 36.87/kg (for 500k systems/year) 1.92 g/cc density2007 AnalysisMaterialCostDensityCure TimeCure TempSilicone /kgg/ccs 14.331.4150127 CSiliconeUpdatesHenkelLoctite 5714 56.701.05 180‐2008 AnalysisViton GF‐S 36.871.92120187 CProcess: VacuumVmixeri tto remove airi bbubblesbbl Low pressure injection followed by 20 ksicompression 2 min cycle time at 187 C Add’l room temperaturettcure outsidet id off moldldpage 13Ballard Patent US 7,070,876July 4, 2006
Coolant Gaskets 8.00 7.00 7 00Insertion Molding ( /kWnet)Laser Welding ( /kWnet)Screen Printing ( /kWnet) 6.00 5.00 4.00 3.00 2.00 1.00 0.00 0 000 300,000400,000500,000Laser Welding & Screen PrintingBoth provide cost savings over Insertion Molding, especially with updated (higher) silicone/Viton costsScreen‐printing selected––––– 200,0002007 Analysis used insertion molding for creation of coolant gaskets2 new gasketing methods examined:–– 100,000Formula‐A Resin (from Dana Corp. Patent) printed onto the stainless steel bipolar platesIndexed process, batch length ranges from 9.62 sec to 4 sec, depending on machine used 387k process line used for 1,000 sys/year, faster 1.4M process line used for other 4 ratesUV Curing, robotic handling 0.38/kWnet at 2008 technology, 500k sys/yearSScreen‐printingi i process alsol appliedli d to EEnddGGasketsk– 0.04/kWnet savings compared to Insertion Moldingpage 14
Hydrogen Sensors Makel Engineering sensors2 sensors/system at 2008 tech.1 per system for 2010 tech.0 per systemtf 2015 tech.fort h 850/sensor vs. 2000/sensor in ‘07 Analysis1k systems/year, 2008 tech. 100/sensor vs. 150/sensor in ‘07 Analysis 200720008Current Technology500k systems/year 2008 tech.2010 Technology2015 TechnologyAnnual Production 00130,000500,0001,00030,00080,000130,000Sensors per System22222111110000500,0000Hydrogen Sensor Cost ( ) 850.00 438.00 320.00 261.00 100.00 750.00 367.00 256.00 201.00 50.00 500.00 238.00 161.00 124.00 20.00Hydrogen Sensors Cost ( /system ) 1,700.00 876.00 640.00 522.00 200.00 750.00 367.00 256.00 201.00 50.00 0.00 0.00 0.00 0.00 0.00Hydrogen Sensors Cost ( /kWnet) 21.25 10.95 8.00 6.53 2.50 9.38 4.59 3.20 2.51 0.63 0.00 0.00 0.00 0.00 0.00Sensors per System122221111100000Hydrogen Sensor Cost ( ) 2,000.00 200.00 187.00 175.00 150.00 2,000.00 200.00 187.00 175.00 150.00 2,000.00 200.00 187.00 175.00 150.00Hydrogen Sensors Cost ( /system ) 2,000.00 400.00 374.00 350.00 300.00 2,000.00 200.00 187.00 175.00 150.00 0.00 0.00 0.00 0.00 0.00Hydrogen Sensors Cost ( /kWnet) 25.00 5.00 4.68 4.38 3.75 25.00 2.50 2.34 2.19 1.88 0.00 0.00 0.00 0.00 0.00page 15
20007 Analysis2015 2010 2007201520008 Analysis20102008Belly PanAnnual Production RateMaterial ( /system )Manufacturing ( /system )Tooling ( /system )1,00030,00080,000130,000500,000 3.41 139.70 5.67 3.41 4.98 0.19 3.41 2.08 0.07 3.41 1.41 0.04 3.41 0.51 0.01Total Cost ( /system) 148.78 8.58 5.56 4.86 3.94T t lCTotalCostt ( /kW net) 1 86 1.86 0 11 0.11 0 07 0.07 0 06 0.06 0 05 0.05Material ( /system )Manufacturing ( /system )Tooling ( /system ) 3.41 139.70 5.67 3.41 4.98 0.19 3.41 2.08 0.07 3.41 1.41 0.04 3.41 0.51 0.01Total Cost ( /system) 148.78 8.58 5.56 4.86 3.94Total Cost (( /kW net) 1.86 0.11 0.07 0.06 0.05Material ( /system )Manufacturing ( /system )Tooling ( /system ) 3.41 139.70 5.67 3.41 4.98 0.19 3.41 2.08 0.07 3.41 1.41 0.04 3.41 0.51 0.01Total Cost ( /system) 148.78 8.58 5.56 4.86 3.94Total Cost ( /kW net) 1.86 0.11 0.07 0.06 0.05Total Cost ( /system) 400.12 41.12 17.58 12.18 5.75Total Cost ( /kW net) 5.00 0.51 0.22 0.15 0.07Total Cost ( /system) 219.04 29.19 13.09 9.38 5.02Total Cost ( /kW net) 2.74 0.36 0.16 0.12 0.06Total Cost ( /system) 219.66 29.27 13.12 9.40 5.02Total Cost ( /kW net) 2.75 0.37 0.16 0.12 0.06page 16 New bottom‐up DFMAanalysis Vacuum thermoformingprocess Polypropylene, 1.15/kg Manual Loading used atall mfg. rates except500k/year 0.05/kWnet (500k/year)
Wiring New bottom‐upbottom up analysis Detailed wiring requirements & BOMVendor quotes on wires/connectors AnalysisA l i onlyl covers materialst i l costst(installation covered in system assembly) 9 different cable types in eachsystem:– 22 data cables– 17 powerpcables– 38 meters of total length 2.65/kWnetpage 17
Balance of Plant2008 Technology 4,000 8,000 3,500 7,000 3,000 6,000BOP CostBOP Cost 9,000 5,000 4,000 3,0002015 TechnologyHydrogen SensorsF l LLoopFuel 2,500 2,000Exhaust Loop 1,500Coolant Loop 1 000 1,000 2,000 1,000 500 0 0Systems per Year Increases in manufacturing rateleads to largest savings. Air Compressors and Sensors arethe two categories that have thelargest decline, together yielding70% off theh BOP cost declined li fromflowlproduction to high production.page 18MiscellaneousHumidifier & WaterRecovery LooppAir LoopSystems per Year Technology changes yields lesserBOP savings and comes in form ofreduced/eliminated components. Simplifications of Air, Humidifier,& Coolant Loops yield majority oftechnologyh limprovementisavings.iMounting Frames
Stack & System Costs vs. Annual Production Rate Power Density 525 mW/cm2 Catalyst Loading 0.21 mg/cm22007Status2008StatusCurrent(2007, 2008)page DOE Target:Stack Cost /kWe (net)-- 25 25 15 15Study Estimate:Stack Cost /kWe (net) 50 42 27 27 23 23DOE Target: System Cost /kWe (net)-- 45 45 30 30Study Estimate: System Cost /kWe (net)( t) 94 81 66 60 53 49
Stack & System Costs vs. Annual Production Rate (ANL vs. DTI)DTI:DTI ANL Power Density 525 mW/cm2 Catalyst Loading 0.210 21 mg/cm2“ANL”: Power Density 715 mW/cm2 Catalyst Loading 0.25 mg/cm2page 202008Stack Cost /kWe (net) 42System Cost /kWe (net) 81 34 73
Stack Component Cost Distribution1,000 systems (2008)1%3%1% 1%6% 5%1,000 systems (2010)1,000 systems (2015)2% 1%8% 5%1%2% 1%8%2%5%5%Bipolar Plates(Stamped)MembranesCatalyst Ink5%Catalyst CatalystInk3%12%3%MEA Frame/GasketsCoolant Gaskets(Screen Printing)End Gaskets8%End Plates500,000 systems (2010)500,000 systems (2008)0%1%1%6%15%Membranes0% 1%1%7%500,000 systems (2015)0% 2%1%14%10%13%11%10%12% GDL12%0%43%page 21 Catalyst Ink dominatescost at high production Top 3 costs:Catalyst Ink0% Membrane dominatescost at low production16%12%9%9%8%Other48%0%38% Membrane Catalyst Ink GDL
Additional Analyses Not Included in 2008 Update Cost Bipolar Plate Coatings Oak Ridge National Labs – Nitriding TreadStone – proprietary process NSTF catalyst deposition (3M)page 22
Stamped Stainless Steel Bipolar Plates Stamped using a 4‐stage4‐stage Progressive Die setup Greater tooling costs offsetsignificantly by reduced labor& energy costs over individualdie setup Rapid plate production (up to80 plates/minute) SS 304 or SS 316Stamped vs.vs other methods: Less brittle than compositesLower tooling cost than injection moldingLower gas permeationB d li corrosionBorderlinei resistanceitHigh contact resistancepage 23
Nitrided Coatings for Stamped Bipolar PlatesThermally Grown Cr‐NitridePlainNitrided Oak Ridge National Lab (Mike Brady) is investigating nitrided coatings for bipolar platecorrosion resistance with low surface contact resistance Surface conversion, not a deposited coating: High temperature favors reaction of all exposedmetal surfaces No pin‐hole defects (other issues to overcome) Amenable to complex geometries (flow field grooves) Conventional nitriding currently conducted in large automated facilities: anticipated processfor bipolar plates is similar but simpler & fasterpage 24
Nitrided Coatings for Bipolar Plates (continued) Batch processing and automated “lights out” facilities analyzed Automated, step‐continuous conventional nitriding system at 500,000 systems/year Markup not included Keys are shorth nitridingd cyclel andd highh h furnacefplatelstackingk densityd 0.75/kW potentially feasible Nitriding by pulsed plasma arc lamp in range of 0.16 ‐ 0.44/kW Feasibility to nitride Ti in “seconds”seconds previously demonstratedpage 25
TreadStone Coatings for Stamped Bipolar PlatesMachine selection notoptimizedti i d forf low‐rateltproduction 14.00Coating Cost ( /kWnet) 12.00 10.00 8.002008 6.0020082015316 Plate 6.34/kW 3.82/kWCoating 1 92/kW 1.92/kW 1 51/kW 1.51/kWCoatedPlate 8.26/kW 5.33/kW20102015 4.00 2.00 0.000100,000200,000300,000400,000500,000Production Volume (Systems/Year) NDA signed with TreadStone,TreadStone collaborated closely to model their multi‐stepmulti step process Based on US patent # 7,309,540 B2, and proprietary parameters Conducted preliminary evaluation based on information from TreadStonein depth version based on detailed equipment manufacturer specifications Conducted more in‐depth Improved machinery schematics, capital costs, machine rates, etc. Analyzed the impact of switching from SS 316 to the cheaper SS 304 for coated plates Cost savings of SS 304 is small FurtherF h savingsimighti h beb achievedhi d withi h cheaperhplatelmaterialsi l suchh as AluminumAl ipage 26
NanoStructured Thin Film Catalysts (NSTF) ‐ 3M Method(Preliminary Analysis) A preliminary DFMA analysis based on the workof 3M (Mark Debe)4‐step process:1) PhPhysicali l vapor depositionditi off PR‐149PR 149 (Perylene(P lR d pigmentRedit149) onto DuPont Kapton polyamide web PR‐149: 25 C, 0.1µm thickness2) Vacuum annealing 245 C , 20 min dwell timeCreates crystallinell whiskersh k bby a screw ddislocationlgrowthhprocess3) Platinum and a bimetallic alloy are magnetron‐sputteredonto the crystalline nanostructures 30 second dwell time4) Roll‐to‐rollR ll tll transfertf off catalystt l t fromfK t toKapton t membraneb Compared to existing VertiCoater method:–Appears to be slightly more expensive – 0.51/kWnet increase (2008 technology, 500k sys/yr)May facilitate a higher Areal Power Density 715 mW/cm2, 0.25 mg/cm2 (from 3M), up from 525, 0.21Net cost savings of 7.35/kWnet (2008, 500k sys/yr)page 27PRELIMINARY
Future Work Year 3 (Option Year 1): Due February 2009– Annual Update Expanded sensitivity analysis– Use results to drive the rest of the analysisy Documentation & Reporting– Write the 2008 Report Update– Refine the spreadsheet model for submission Investigate platinum alloys & alternate catalyst depositiontechniques including NanoStructured Thin Film Catalyststechniques,– Optional Task 3.3: Optimization analysis– Analyze tradetrade‐offsoffs between power density & catalyst loading for minimized cost CMEU cost study–––––page 28Partner with Honeywell to determine a detailed CMEU costSeeking to find more detailed CMEU cost breakdown & new cost‐saving pathwaysBase analysis on existing Honeywell designHoneywell will provide a detailed cost breakdown based largely on vendor quotesDTI will develop a DFMA model around it
End of PresentationThank you.page 29
Additional SlidesTh ffollowingThell i slideslid are providedid d ffor ffurtherhclarificationpage 30
Proton Exchange Membrane(Based on Gore‐like approach)Purchase Price ( /m2)P 375DTI Total CostDuPont StudyGM Study 300 225 150 75 01.0E 04 1.0E 05 1.0E 06 1.0E 07 1.0E 08 1.0E 09Annual Production (m2/year) Assumes 67% max equipment utilization consistent with 25%/year growth rate (over 5 years) Assumes 50%50%‐80%80% membrane yields Membrane /m2 is reduced solely by increases in manufacturing rate, not by technologicaladvancement with year However,However fewer m2 are required in future years because areal power density increasespage 31
Catalyst InkC t l tPCatalystPreparationti Batch Pt‐precipitation onto Vulcan XC‐72carbon support via a hexachloroplatinicacid (CPA) precursor (notional E‐TEK‐likeprecipitation method)C t l t InkCatalystI k compositioniti 7% (wt) Nafion Ionomer 15% (wt) Carbon supported Pt (40% (wt) Pt on Vulcan XC‐72) 78% (wt) Solvent (50/50 mixture of methanol and DI water) Mixed Ultrasonically Material costs are dominated by the platinum ( 1,100/tr. oz.)page 32
Catalyst ApplicationCoatema VertiCoater Dual‐sided Vertical coating process Die‐slot catalyst applicator Modeled as Coatema VertiCoater Simultaneously applies catalyst slurryto both sides of the membrane Maximum roll width of 1 meter Line speed of 10m/min 750,000 capital cost/line (notcounting 40% for installation)page 33
Bill of Materials: Stack (2008 Technology)Annual Production Rate1,00030,00080,000130,000500,000System Net Electric Power (Output)System Gross Electric Power (Output)Bipolar Plates (Stamped)MEAsMembranesCatalyst Ink & ApplicationGDLsM & E Hot PressingM & E Cutting & SlittingMEA Frame/GasketsCoolant Gaskets (Screen Printing)End Gaskets (Screen Printing)End PlatesCurrent CollectorsCompression Bands8090.34 352.338090.34 256.058090.34 254.228090.34 254.958090.34 253.67 3,276.06 3276 06 974.90 1,532.80 38.30 27.46 196.31 102 52 102.52 90.08 68.43 15.07 10.00 556.89 55689 764.47 917.04 17.11 3.38 240.25 14 98 14.98 11.18 33.64 9.21 8.00 352 06 352.06 760.17 575.23 17.11 2.85 232.80 16 37 16.37 4.22 29.66 8.03 6.00 278 52 278.52 757.96 451.70 16.87 2.93 232.26 16 70 16.70 2.62 27.81 7.52 5.50 151 80 151.80 747.94 214.87 16.86 2.79 226.35 15 21 15.21 0.71 20.92 6.99 5.00 51.59 26 27 26.27 19.73 11 28 11.28 17.10 10 81 10.81 17.46 10 85 10.85 17.03 10 80 10.80 0.00 0.00 0.00 0.00 0.00 6,762.11 2,863.20 2,286.62 2,083.62 1,690.94 13,524.22 5,726.40 4,573.25 4,167.25 3,381.88Total Stack Cost ( /kW net) 169.05 71.58 57.17 52.09 42.27Total Stack Cost ( /kW gross) 149.71 63.39 50.62 46.13 37.44Stack AssemblyStack Conditioning10% Cost ContingencyTotal Stack CostTotal Cost for All Stacks 3.5 to 1 cost reduction between low and high manufacturing ratespage 34
Bill of Materials: Stack (2010 Technology)Annual Production Rate1,00030,00080,000130,000500,000System Net Electric Power (Output)System Gross Electric Power (Output)Bipolar Plates (Stamped)MEAsMembranesCatalyst Ink & ApplicationGDLsM & E Hot PressingM & E Cutting & SlittingMEA Frame/GasketsCoolant Gaskets (Screen Printing)End Gaskets (Screen Printing)End PlatesCurrent CollectorsCompression Bands8086.82 243.368086.82 153.478086.82 153.478086.82 152.568086.82 152.53 2,244.65 2244 65 742.99 878.18 34.00 27.32 201.34 100 97 100.97 90.06 50.25 10.58 10.00 397.05 39705 547.57 456.99 7.69 3.26 124.93 13 47 13.47 11.16 23.38 5.29 8.00 243 18 243.18 542.02 286.57 7.81 2.74 119.70 14 86 14.86 4.20 21.55 4.56 6.00 188 99 188.99 539.47 224.10 7.84 2.62 119.38 15 18 15.18 2.60 19.63 4.27 5.50 97 06 97.06 532.10 106.44 7.71 2.53 115.25 13 03 13.03 0.70 15.07 3.96 5.00 51.59 24 76 24.76 19.73 9 15 9.15 17.10 8 84 8.84 17.46 8 77 8.77 17.03 8 65 8.65 0.00 0.00 0.00 0.00 0.00Total Stack Cost 4,710.06 1,781.13 1,432.61 1,308.37 1,077.06Total Cost for All Stacks 9,420.13 3,562.26 2,865.22 2,616.73 2,154.13Total Stack Cost ( /kW net) 117.75 44.53 35.82 32.71 26.93Total Stack Cost ( /kW gross) 108.50 41.03 33.00 30.14 24.81Stack AssemblyStack Conditioning10% Cost Contingency 4.3 to 1 cost reduction between low and high manufacturing ratespage 35
Bill of Materials: Stack (2015 Technology)Annual Production Rate1,00030,00080,000130,000500,000System Net Electric Power (Output)System Gross Electric Power (Output)Bipolar Plates (Stamped)MEAsMembranesCatalyst Ink & ApplicationGDLsM & E Hot PressingM & E Cutting & SlittingMEA Frame/GasketsCoolant Gaskets (Screen Printing)End Gaskets (Screen Printing)End PlatesCurrent CollectorsCompression Bands8087.11 243.768087.11 153.818087.11 153.818087.11 152.918087.11 152.88 2,249.97 2249 97 550.26 880.45 34.00 27.32 201.87 100 98 100.98 90.06 50.28 10.60 10.00 398.84 39884 368.18 458.52 7.68 3.26 125.32 13 48 13.48 11.16 23.39 5.30 8.00 244 28 244.28 364.00 287.50 7.81 2.74 118.58 14 87 14.87 4.20 21.56 4.58 6.00 189 85 189.85 361.79 224.81 7.84 2.62 118.49 15 19 15.19 2.60 19.63 4.28 5.50 97 51 97.51 356.88 106.74 7.71 2.53 115.64 13 03 13.03 0.70 15.07 3.97 5.00 51.59 23 25 23.25 19.73 7 02 7.02 17.10 6 63 6.63 17.46 6 54 6.54 17.03 6 51 6.51 0.00 0.00 0.00 0.00 0.00Total Stack Cost 4,524.38 1,603.69 1,253.65 1,129.50 901.19Total Cost for All Stacks 9,048.76 3,207.38 2,507.31 2,259.00 1,802.38Total Stack Cost ( /kW net) 113.11 40.09 31.34 28.24 22.53Total Stack Cost ( /kW gross) 103.88 36.82 28.78 25.93 20.69Stack AssemblyStack Conditioning10% Cost Contingency 4.9 to 1 cost reduction between low and high manufacturing ratespage 36
Bill of Materials: Balance of Plant (2008 Technology)Annual Production Rate1,00030,00080,000130,000500,000System Net Electric Power (Output)SystemStGrossGElectricEl t i PowerP(Output)(O t t )Mounting FramesAir LoopHumidifier & Water Recovery LoopCoolant Loop (High Temperature)Exhaust Loop (Low Temperature)F lLFuelLoopSystem Controller/SensorsHydrogen SensorsMiscellaneousTotal BOP Cost8090.349034 100.00 2,616.69 535.13 528.75 169.18 927 50 927.50 300.00 1,700.00 962.30 7,839.558090.349034 43.00 1,364.16 379.81 448.00 147.40 747 00 747.00 245.00 876.00 706.05 4,956.428090.349034 33.00 1,063.94 315.54 384.25 130.32 566 50 566.50 230.00 640.00 586.98 3,950.528090.349034 30.00 954.11 300.75 363.10 123.28 528 40 528.40 222.00 522.00 563.07 3,606.718090.349034 30.00 803.28 273.77 331.80 113.90 457 20 457.20 200.00 200.00 515.73 2,925.68 97.99 86.78 61.96 54.87 49.38 43.73 45.08 39.92 36.57 32.39Total BOP Cost ( /kW net)Total BOP Cost ( /kW gross) 2.6 to 1 cost reduction between low and high manufacturing ratespage 37
Bill of Materials: Balance of Plant (2010 Technology)Annual Production Rate1,00030,00080,000130,000500,000System Net Electric Power (Output)SystemStGrossGElectricEl t i PowerP(Output)(O t t )Mounting FramesAir LoopHumidifier & Water Recovery LoopCoolant Loop (High Temperature)Exhaust Loop (Low Temperature)F lLFuelLoopSystem Controller/SensorsHydrogen SensorsMiscellaneousTotal BOP Cost8086.828682 100.00 1,887.03 900.00 498.24 0.00 927 50 927.50 300.00 750.00 910.12 6,272.898086.828682 43.00 1,327.82 600.00 420.54 0.00 747 00 747.00 245.00 367.00 653.87 4,404.238086.828682 33.00 1,003.72 425.00 358.32 0.00 566 50 566.50 230.00 256.00 534.80 3,407.348086.828682 30.00 891.74 350.00 338.69 0.00 528 40 528.40 222.00 201.00 510.89 3,072.728086.828682 30.00 754.33 250.00 308.92 0.00 457 20 457.20 200.00 50.00 463.55 2,514.00 78.41 72.25 55.05 50.73 42.59 39.25 38.41 35.39 31.42 28.96Total BOP Cost ( /kW net)Total BOP Cost ( /kW gross) 2.6 to 1 cost reduction between low and high manufacturing ratespage 38
Bill of Materials: Balance of Plant (2015 Technology)Annual Production Rate1,00030,00080,000130,000500,000System Net Electric Power (Output)SystemStGrossGElectricEl t i PowerP(Output)(O t t )Mounting FramesAir LoopHumidifier & Water Recovery LoopCoolant Loop (High Temperature)Exhaust Loop (Low Temperature)F lLFuelLoopSystem Controller/SensorsHydrogen SensorsMiscellaneousTotal BOP Cost8087.118711 100.00 1,374.58 0.00 453.75 0.00 927 50 927.50 300.00 0.00 895.23 4,051.068087.118711 43.00 967.35 0.00 380.50 0.00 747 00 747.00 245.00 0.00 638.98 3,021.838087.118711 33.00 726.79 0.00 320.50 0.00 566 50 566.50 230.00 0.00 519.91 2,396.708087.118711 30.00 649.64 0.00 303.10 0.00 528 40 528.40 222.00 0.00 496.00 2,229.148087.118711 30.00 552.07 0.00 275.55 0.00 457 20 457.20 200.00 0.00 448.66 1,963.48 50.64 46.51 37.77 34.69 29.96 27.51 27.86 25.59 24.54 22.54Total BOP Cost ( /kW net)Total BOP Cost ( /kW gross) 2 to 1 cost reduction between low and high manufacturing ratespage 39
Bill of Materials: System (2008 Technology)Annual Production Rate1,00030,00080,000130,000500,000SystemyNet Electric Power (Output)(p )80System Gross Electric Power (Output)90.34 13,524.22Fuel Cell Stacks 7,839.55Balance of Plant8090.34 5,726.40 4,956.428090.34 4,573.25 3,950.528090.34 4,167.25 3,606.718090.34 3,381.88 2,925.68 203.10 149.58 21,566.86 10,832.40 147.64 8,671.42 147.79 7,921.75 147.41 6,454.97 108.39 95.99 99.02 87.69 80.69 71.45System Assembly & TestingTotal System CostTotal System Cost ( /kW net)Total System Cost ( /kW gross) 269.59 238.74 135.41 119.9
417. Cell. 463. Voltage. 233 @ Peak. 234. Power V/cell. 0.677 0.677 0.677 0.677 0.677 0.677. Operating Pressure (Peak) t. 23 23 20 20 15 15. Key DerivedPerformance Parameters: a m. 2.3 2.3 2.0 2.0 1.5 1.5 A few key DOE Technical Target values are used to anchor system definition ll h fl f ll d A ot er system parameters ow rom DTI .