Transcription
IntroductionDebugging support in the kernelIskanje napak z izpisiIskanje napak s povpraševanjiDebugging by observingSystem error searchSystem error search, when system hangsDebuggers and similar toolsLinux Device Drivers - debuggingJernej VičičMarch 15, 2018Jernej VičičLinux Device Drivers - debugging
IntroductionDebugging support in the kernelIskanje napak z izpisiIskanje napak s povpraševanjiDebugging by observingSystem error searchSystem error search, when system hangsDebuggers and similar toolsOverview12345678IntroductionDebugging support in the kernelIskanje napak z izpisiIskanje napak s povpraševanjiUsing /proc file systemMethod ioctlDebugging by observingSystem error searchSystem error search, when system hangsDebuggers and similar toolsgdbkdb – Kernel Debuggerkgdb – kgdb PatchesUser-Mode Linux PortJernej VičičLinux Device Drivers - debugging
IntroductionDebugging support in the kernelIskanje napak z izpisiIskanje napak s povpraševanjiDebugging by observingSystem error searchSystem error search, when system hangsDebuggers and similar toolsIntroductionkernel code cannot be executed in a debugger,an error can ”lay down” the whole system,Jernej VičičLinux Device Drivers - debugging
IntroductionDebugging support in the kernelIskanje napak z izpisiIskanje napak s povpraševanjiDebugging by observingSystem error searchSystem error search, when system hangsDebuggers and similar toolsDebugging support in the kernelcompiling proprietary kernel,”debugging features” in the core,these properties are slow (additional writing),is usually turned off in ”production” kernels,”kernel hacking” menu,kernel configuration j VičičLinux Device Drivers - debugging
IntroductionDebugging support in the kernelIskanje napak z izpisiIskanje napak s povpraševanjiDebugging by observingSystem error searchSystem error search, when system hangsDebuggers and similar toolsConfiguration possibilitiesCONFIG DEBUG KERNEL: enables for debuggingpossibilities, does not do anything,CONFIG DEBUG SLAB: enables to find memory overrun andmissing initialization errors, each byte of memory is addressedto 0xa5 and is set to 0x6b after the command free,CONFIG DEBUG PAGEALLOC: enables searching for errorsof type ”memory corruption”, slows down the systemconsiderably,CONFIG DEBUG SPINLOCK: enables search errors of type:”double open lock”,CONFIG DEBUG SPINLOCK SLEEP: complains if a functionis called that can sleep in critical section,CONFIG INIT DEBUG: enables code search for parts that useJernej VičičLinux Device Drivers - debugging
IntroductionDebugging support in the kernelIskanje napak z izpisiIskanje napak s povpraševanjiDebugging by observingSystem error searchSystem error search, when system hangsDebuggers and similar toolsConfiguration possibilitiesCONFIG DEBUG INFO: ”full debugging information”, thisoption is needed by gdb,CONFIG FRAME POINTER: also gdb,CONFIG MAGIC SYSRQ: enables ”magic SysRq”,CONFIG DEBUG STACKOVERFLOW,CONFIG DEBUG STACK USAGE: enables search of ”kernelstack overflows”,CONFIG KALLSYMS: ”kernel symbol information” is insertedinto kernel that enables a nedugger a ”human readable”output,CONFIG IKCONFIG ,CONFIG IKCONFIG PROC: usable ifthe kernel is not compiled by us,Jernej VičičLinux Device Drivers - debugging
IntroductionDebugging support in the kernelIskanje napak z izpisiIskanje napak s povpraševanjiDebugging by observingSystem error searchSystem error search, when system hangsDebuggers and similar toolsConfiguration possibilitiesCONFIG ACPI DEBUG: ”verbose ACPI debugginginformation”, used with ACPI,CONFIG DEBUG DRIVER: ”debugging information in thedriver core”,CONFIG SCSI CONSTANTS: ”verbose SCSI error messages”,CONFIG INPUT EVBUG: ”verbose logging of input events”for drivers of I/O devices,CONFIG PROFILING: ”tracking down some kernel hangs andrelated problems”.Jernej VičičLinux Device Drivers - debugging
IntroductionDebugging support in the kernelIskanje napak z izpisiIskanje napak s povpraševanjiDebugging by observingSystem error searchSystem error search, when system hangsDebuggers and similar toolsIskanje napak z izpisiprintk,almost printf.but only almost printf.Jernej VičičLinux Device Drivers - debugging
IntroductionDebugging support in the kernelIskanje napak z izpisiIskanje napak s povpraševanjiDebugging by observingSystem error searchSystem error search, when system hangsDebuggers and similar toolsprintkordering messages according to loglevel,loglevel is defined by a macro,KERN INFO” already seen,loglevel macro expands to a string, that is added to themessage,The first number in the output is the console log level, thesecond is the default log level, third is the minimum log leveland fourth is the maximum log level.cat /proc/sys/kernel/printk4 4 1 7Jernej VičičLinux Device Drivers - debugging
IntroductionDebugging support in the kernelIskanje napak z izpisiIskanje napak s povpraševanjiDebugging by observingSystem error searchSystem error search, when system hangsDebuggers and similar toolsprintkprintk(KERN DEBUG "Here I am: %s:%i\n", FILE , LINE )printk(KERN CRIT "I have crashed; giving up on %p\n", ptr);Jernej VičičLinux Device Drivers - debugging
IntroductionDebugging support in the kernelIskanje napak z izpisiIskanje napak s povpraševanjiDebugging by observingSystem error searchSystem error search, when system hangsDebuggers and similar toolsprintkKERN EMERG: this printout is usually followed by a crash,KERN ALERT: requires immediate action,KERN CRIT: ”Critical conditions”, bad hw, sw errors,KERN ERR: an error message, the drivers should report hwerrors this way,KERN WARNING: nothing terrible,KERN NOTICE:normal events, which we still log, security access,KERN INFO: often on startup,KERN DEBUG: ”debugging messages”.Jernej VičičLinux Device Drivers - debugging
IntroductionDebugging support in the kernelIskanje napak z izpisiIskanje napak s povpraševanjiDebugging by observingSystem error searchSystem error search, when system hangsDebuggers and similar toolsprintkDepending on loglevel, the kernel outputs on:consoletext-mode terminalserial portparallel printerif smaller than console loglevel:if klogd and syslogd are started, the messages are written to:/var/log/messages,if klogd is not started, the messages will be only in:/proc/kmsgJernej VičičLinux Device Drivers - debugging
IntroductionDebugging support in the kernelIskanje napak z izpisiIskanje napak s povpraševanjiDebugging by observingSystem error searchSystem error search, when system hangsDebuggers and similar toolsPrint device numbersint print dev t(char *buffer, dev t dev);char *format dev t(char *buffer, dev t dev);Print device numbersJernej VičičLinux Device Drivers - debugging
IntroductionDebugging support in the kernelIskanje napak z izpisiIskanje napak s povpraševanjiDebugging by observingSystem error searchSystem error search, when system hangsDebuggers and similar toolsUsing /proc file systemMethod ioctlIskanje napak s povpraševanjiDebugging by Querying,frequent use of printk slows down the system,some options without using printk:file in /proc file system,use the ioctl driver,export attributes via sysfs.last item will not be looked at (we need too much knowledge).Jernej VičičLinux Device Drivers - debugging
IntroductionDebugging support in the kernelIskanje napak z izpisiIskanje napak s povpraševanjiDebugging by observingSystem error searchSystem error search, when system hangsDebuggers and similar toolsUsing /proc file systemMethod ioctlUsing /proc file systemspecial, programmed file system (not hw),used by the kernel,each file is bound to a core function that generates thecontents of this file when it is read (data is not written),examples: /proc/ modules displays all the registered modules,some drivers print their content in this way,our driver can also work,Jernej VičičLinux Device Drivers - debugging
IntroductionDebugging support in the kernelIskanje napak z izpisiIskanje napak s povpraševanjiDebugging by observingSystem error searchSystem error search, when system hangsDebuggers and similar toolsUsing /proc file systemMethod ioctlUsing /proc file system/proc should not be used for these purposes,sysfs should be used instead (demanding),we will use /proc :)Jernej VičičLinux Device Drivers - debugging
IntroductionDebugging support in the kernelIskanje napak z izpisiIskanje napak s povpraševanjiDebugging by observingSystem error searchSystem error search, when system hangsDebuggers and similar toolsUsing /proc file systemMethod ioctlFile implementation in /procinclude linux/proc fs.h ”read-only”, need a read function,process starts read system callkernel allocates one page of memory at the read call,PAGE SIZE bytesJernej VičičLinux Device Drivers - debugging
IntroductionDebugging support in the kernelIskanje napak z izpisiIskanje napak s povpraševanjiDebugging by observingSystem error searchSystem error search, when system hangsDebuggers and similar toolsUsing /proc file systemMethod ioctlFile implementation in /procint (*read proc)(char *page, char **start, off t offset,int count, int *eof, void *data);page - kernel allocates at the command,data - (not relevant) - ”driver specific, internal usage”,returns the number of bytes that are placed in the page,eof is a simple flag,start is used for commands that return more than one datapage.Jernej VičičLinux Device Drivers - debugging
IntroductionDebugging support in the kernelIskanje napak z izpisiIskanje napak s povpraševanjiDebugging by observingSystem error searchSystem error search, when system hangsDebuggers and similar toolsUsing /proc file systemMethod ioctlFile implementation in /procint scull read procmem(char *buf, char **start, off t offset,int count, int *eof, void *data){int i, j, len 0;int limit count - 80; /* Don’t print more than this */for (i 0; i scull nr devs && len limit; i ) {struct scull dev *d &scull devices[i];struct scull qset *qs d- data;if (down interruptible(&d- sem))return -ERESTARTSYS;len sprintf(buf len,"\nDevice %i: qset %i, q %i, sz %li\n",i, d- qset, d- quantum, d- size);for (; qs && len limit; qs qs- next) { /* scan the list */len sprintf(buf len, " item at %p, qset at %p\n",qs, qs- data);if (qs- data && !qs- next) /* dump only the last item */for (j 0; j d- qset; j ) {if (qs- data[j])len sprintf(buf len," % 4i: %8p\n",j, qs- data[j]);}}up(&scull devices[i].sem);}Jernej VičičLinux Device Drivers - debugging*eof 1;
IntroductionDebugging support in the kernelIskanje napak z izpisiIskanje napak s povpraševanjiDebugging by observingSystem error searchSystem error search, when system hangsDebuggers and similar toolsUsing /proc file systemMethod ioctlFile implementation in /procassume that: only one data page,therefore we do not need start, offset,. but . we look at the buffer overrun.Jernej VičičLinux Device Drivers - debugging
IntroductionDebugging support in the kernelIskanje napak z izpisiIskanje napak s povpraševanjiDebugging by observingSystem error searchSystem error search, when system hangsDebuggers and similar toolsUsing /proc file systemMethod ioctlFile implementation in /proca function was defined: read procfunction is linked into hierarchy /proccall create proc read entryJernej VičičLinux Device Drivers - debugging
IntroductionDebugging support in the kernelIskanje napak z izpisiIskanje napak s povpraševanjiDebugging by observingSystem error searchSystem error search, when system hangsDebuggers and similar toolsUsing /proc file systemMethod ioctlFile implementation in /procstruct proc dir entry *create proc read entry(const char *name, mode t mode,struct proc dir entry *base,read proc t *read proc, void *data);name – filenamemode – security mask (0 default)base – directory in which the file will reside (NULL jeroot /proc)read proc – function that implements the file, in our case:scull read procmemdata – kernel ignores thisJernej VičičLinux Device Drivers - debugging
IntroductionDebugging support in the kernelIskanje napak z izpisiIskanje napak s povpraševanjiDebugging by observingSystem error searchSystem error search, when system hangsDebuggers and similar toolsUsing /proc file systemMethod ioctlExample create proc read entrycreate proc read entry("scullmem", 0 /* default mode */,NULL /* parent dir */, scull read procmem,NULL /* client data */);scullmem – file namedefault security (world readable)Jernej VičičLinux Device Drivers - debugging
IntroductionDebugging support in the kernelIskanje napak z izpisiIskanje napak s povpraševanjiDebugging by observingSystem error searchSystem error search, when system hangsDebuggers and similar toolsUsing /proc file systemMethod ioctl/proc implementationremove proc entry("scullmem", NULL /* parent dir */);unload module: delete links,use: remove proc entryJernej VičičLinux Device Drivers - debugging
IntroductionDebugging support in the kernelIskanje napak z izpisiIskanje napak s povpraševanjiDebugging by observingSystem error searchSystem error search, when system hangsDebuggers and similar toolsUsing /proc file systemMethod ioctlMethod ioctlsystem call, which behaves like a ”file descriptor”,gets a number that identifies which command is executed,we need an additional program,executes the ioctl commands,displays the results,code in the driver is practically the same.More below.Jernej VičičLinux Device Drivers - debugging
IntroductionDebugging support in the kernelIskanje napak z izpisiIskanje napak s povpraševanjiDebugging by observingSystem error searchSystem error search, when system hangsDebuggers and similar toolsDebugging by observingobserve the applications behaviour in user space,simple/small problems.Jernej VičičLinux Device Drivers - debugging
IntroductionDebugging support in the kernelIskanje napak z izpisiIskanje napak s povpraševanjiDebugging by observingSystem error searchSystem error search, when system hangsDebuggers and similar toolsDebugging by observingUse:1debugger (for applications),2additional printf in the code,3straceJernej VičičLinux Device Drivers - debugging
IntroductionDebugging support in the kernelIskanje napak z izpisiIskanje napak s povpraševanjiDebugging by observingSystem error searchSystem error search, when system hangsDebuggers and similar toolsDebugging by observing – straceobserve a program from user space;shows all system calls,system call arguments,”return values” of system calls.Cmdline options:-t – (time) when the call was executed,-T – (time spent) time the call used,-e – (limit types) filter calls,-o – (output) to a file.Jernej VičičLinux Device Drivers - debugging
IntroductionDebugging support in the kernelIskanje napak z izpisiIskanje napak s povpraševanjiDebugging by observingSystem error searchSystem error search, when system hangsDebuggers and similar toolsDebugging by observing – strace1strace gets information directly from kernel,2no need for ”debugging support”,3can connect to a working process,Jernej VičičLinux Device Drivers - debugging
IntroductionDebugging support in the kernelIskanje napak z izpisiIskanje napak s povpraševanjiDebugging by observingSystem error searchSystem error search, when system hangsDebuggers and similar toolsDebugging by observing – straceopen("/dev", O RDONLY O NONBLOCK O LARGEFILE O DIRECTORY) 3fstat64(3, {st mode S IFDIR 0755, st size 24576, .}) 0fcntl64(3, F SETFD, FD CLOEXEC) 0getdents64(3, /* 141 entries */, 4096) 4088[.]getdents64(3, /* 0 entries */, 4096) 0close(3) 0[.]fstat64(1, {st mode S IFCHR 0664, st rdev makedev(254, 0), .}) 0write(1, "MAKEDEV\nadmmidi0\nadmmidi1\nadmmid"., 4096) 4000write(1, "b\nptywc\nptywd\nptywe\nptywf\nptyx0\n"., 96) 96write(1, "b\nptyxc\nptyxd\nptyxe\nptyxf\nptyy0\n"., 4096) 3904write(1, "s17\nvcs18\nvcs19\nvcs2\nvcs20\nvcs21"., 192) 192write(1, "\nvcs47\nvcs48\nvcs49\nvcs5\nvcs50\nvc"., 673) 673close(1) 0exit group(0) ?Jernej VičičLinux Device Drivers - debugging
IntroductionDebugging support in the kernelIskanje napak z izpisiIskanje napak s povpraševanjiDebugging by observingSystem error searchSystem error search, when system hangsDebuggers and similar toolsDebugging by observing – stracethis was started: ls /dev /dev/scull0,ls after reading the contents of directory starts write,tries to write only 4000 bytes,restarts the call,scull0 writes quantum data (4000) in one go.Jernej VičičLinux Device Drivers - debugging
IntroductionDebugging support in the kernelIskanje napak z izpisiIskanje napak s povpraševanjiDebugging by observingSystem error searchSystem error search, when system hangsDebuggers and similar toolsDebugging by observing – strace[.]open("/dev/scull0", O RDONLY O LARGEFILE) 3fstat64(3, {st mode S IFCHR 0664, st rdev makedev(254, 0), .}) 0read(3, "MAKEDEV\nadmmidi0\nadmmidi1\nadmmid"., 16384) 4000read(3, "b\nptywc\nptywd\nptywe\nptywf\nptyx0\n"., 16384) 4000read(3, "s17\nvcs18\nvcs19\nvcs2\nvcs20\nvcs21"., 16384) 865read(3, "", 16384) 0fstat64(1, {st mode S IFCHR 0620, st rdev makedev(136, 1), .}) 0write(1, "8865 /dev/scull0\n", 17) 17close(3) 0exit group(0) ?Jernej VičičLinux Device Drivers - debugging
IntroductionDebugging support in the kernelIskanje napak z izpisiIskanje napak s povpraševanjiDebugging by observingSystem error searchSystem error search, when system hangsDebuggers and similar toolsDebugging by observing – stracestarted call: wc -l /dev/scull0,wc is used for fast read,posktries to read more data: 16384 bytes,gets only 4000 bytes,restarts the call,scull0 reads quantum data (4000) in one go.Jernej VičičLinux Device Drivers - debugging
IntroductionDebugging support in the kernelIskanje napak z izpisiIskanje napak s povpraševanjiDebugging by observingSystem error searchSystem error search, when system hangsDebuggers and similar toolsSystem error searchWhen we run a driver, and the system error occurs;We want to gather as much information as possible;”fault” 6 ”panic”;usually panic does not happen, only:a process that triggered the driver’s code with a bug dies;unfreed memory space remains allocated with kmalloc,the whole system works normally.Jernej VičičLinux Device Drivers - debugging
IntroductionDebugging support in the kernelIskanje napak z izpisiIskanje napak s povpraševanjiDebugging by observingSystem error searchSystem error search, when system hangsDebuggers and similar toolsSystem error searchoops : The term does not stand for anything, other than thatit is a simple mistake.oops is a deviation from the normal behaviour of the kernel,when the kernel detects a problem, it outputs a oops messageand kills all the processes that are connected,usually also oops does not crash the entire system.usually, we can only remove the driver from the kernel.if the kernel/system behaves strangely: reboot.Jernej VičičLinux Device Drivers - debugging
IntroductionDebugging support in the kernelIskanje napak z izpisiIskanje napak s povpraševanjiDebugging by observingSystem error searchSystem error search, when system hangsDebuggers and similar toolsSystem error search, oopsmost bugs: dereferencing NULL pointer or using the wrongvalues of the pointer;this causes the oops message;oops displays the state of the processor when the errorhappened:content of registers,description of the rest of the environment.generated using printk in the error handler (fault handler:arch/*/kernel/traps.c).Jernej VičičLinux Device Drivers - debugging
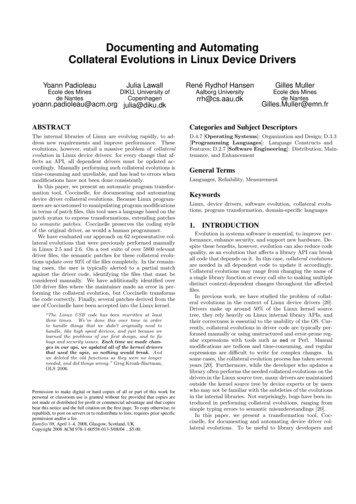
IntroductionDebugging support in the kernelIskanje napak z izpisiIskanje napak s povpraševanjiDebugging by observingSystem error searchSystem error search, when system hangsDebuggers and similar toolsSystem error search, oops primerUnable to handle kernel NULL pointer dereference at virtual address 00000000printing eip:d083a064Oops: 0002 [#1]SMPCPU: 0EIP: 0060:[ d083a064 ] Not taintedEFLAGS: 00010246 (2.6.6)EIP is at faulty write 0x4/0x10 [faulty]eax: 00000000 ebx: 00000000 ecx: 00000000 edx: 00000000esi: cf8b2460 edi: cf8b2480 ebp: 00000005 esp: c31c5f74ds: 007b es: 007b ss: 0068Process bash (pid: 2086, threadinfo c31c4000 task cfa0a6c0)Stack: c0150558 cf8b2460 080e9408 00000005 cf8b2480 00000000 cf8b2460 cf8b2460fffffff7 080e9408 c31c4000 c0150682 cf8b2460 080e9408 00000005 cf8b248000000000 00000001 00000005 c0103f8f 00000001 080e9408 00000005 00000005Call Trace:[ c0150558 ] vfs write 0xb8/0x130[ c0150682 ] sys write 0x42/0x70[ c0103f8f ] syscall call 0x7/0xbCode: 89 15 00 00 00 00 c3 90 8d 74 26 00 83 ec 0c b8 00 a6 83 d0Jernej VičičLinux Device Drivers - debugging
IntroductionDebugging support in the kernelIskanje napak z izpisiIskanje napak s povpraševanjiDebugging by observingSystem error searchSystem error search, when system hangsDebuggers and similar toolsSystem error search, oops primerexample: faulty,it has an error,code faulty.c.Jernej VičičLinux Device Drivers - debugging
IntroductionDebugging support in the kernelIskanje napak z izpisiIskanje napak s povpraševanjiDebugging by observingSystem error searchSystem error search, when system hangsDebuggers and similar toolsSystem error search, oops primerssize t faulty write (struct file *filp, const char user *buf, size t count,loff t *pos){/* make a simple fault by dereferencing a NULL pointer */*(int *)0 0;return 0;}dereference a NULL pointer,0 is never a valid poiter address,kernel signals oops, process, that called dies.Jernej VičičLinux Device Drivers - debugging
IntroductionDebugging support in the kernelIskanje napak z izpisiIskanje napak s povpraševanjiDebugging by observingSystem error searchSystem error search, when system hangsDebuggers and similar toolsSystem error search, oops primerssize t faulty read(struct file *filp, char user *buf,size t count, loff t *pos){int ret;char stack buf[4];/* Let’s try a buffer overflow */memset(stack buf, 0xff, 20);if (count 4)count 4; /* copy 4 bytes to the user */ret copy to user(buf, stack buf, count);if (!ret)return count;return ret;}Jernej VičičLinux Device Drivers - debugging
IntroductionDebugging support in the kernelIskanje napak z izpisiIskanje napak s povpraševanjiDebugging by observingSystem error searchSystem error search, when system hangsDebuggers and similar toolsSystem error search, oops primerread function,copies the string into a local variable,string is longer than the allocated space,buffer overflow,oops on the return function is displayed,instruction pointer is set to nowhereland.Unusable oops:Jernej VičičLinux Device Drivers - debugging
IntroductionDebugging support in the kernelIskanje napak z izpisiIskanje napak s povpraševanjiDebugging by observingSystem error searchSystem error search, when system hangsDebuggers and similar toolsSystem error search, oops primerEIP: 0010:[ 00000000 ]Unable to handle kernel paging request at virtual address ffffffffprinting eip:ffffffffOops: 0000 [#5]SMPCPU: 0EIP: 0060:[ ffffffff ] Not taintedEFLAGS: 00010296 (2.6.6)EIP is at 0xffffffffeax: 0000000c ebx: ffffffff ecx: 00000000 edx: bfffda7cesi: cf434f00 edi: ffffffff ebp: 00002000 esp: c27fff78ds: 007b es: 007b ss: 0068Process head (pid: 2331, threadinfo c27fe000 task c3226150)Stack: ffffffff bfffda70 00002000 cf434f20 00000001 00000286 cf434f00 fffffff7bfffda70 c27fe000 c0150612 cf434f00 bfffda70 00002000 cf434f20 0000000000000003 00002000 c0103f8f 00000003 bfffda70 00002000 00002000 bfffda70Call Trace:[ c0150612 ] sys read 0x42/0x70[ c0103f8f ] syscall call 0x7/0xbCode: Bad EIP value.Jernej VičičLinux Device Drivers - debugging
IntroductionDebugging support in the kernelIskanje napak z izpisiIskanje napak s povpraševanjiDebugging by observingSystem error searchSystem error search, when system hangsDebuggers and similar toolsSystem error search, oops primerEIP is at faulty write 0x4/0x10 [faulty]this line shows the address (first example oops), where theerror occurred,error happened in function faulty write,in module faulty,instruction pointer shows to (0x4) 4 bytes in function, that is(0x10) 16 bytes long.Jernej VičičLinux Device Drivers - debugging
IntroductionDebugging support in the kernelIskanje napak z izpisiIskanje napak s povpraševanjiDebugging by observingSystem error searchSystem error search, when system hangsDebuggers and similar toolsSystem error search, when system hangsmost bugs are presented as oops,some bugs hang a system,then we do not get oops,tem code is in an infinite loop,scheduler does not work,system is unresponsive.how to get to the description?two options:we make sure that the system does not hang,enable to search for errors anyway.Jernej VičičLinux Device Drivers - debugging
IntroductionDebugging support in the kernelIskanje napak z izpisiIskanje napak s povpraševanjiDebugging by observingSystem error searchSystem error search, when system hangsDebuggers and similar toolsSystem error search, when system hangsHow do we get to the description?Two options:we make sure that the system does not hang,enable to search for errors anyway.Jernej VičičLinux Device Drivers - debugging
IntroductionDebugging support in the kernelIskanje napak z izpisiIskanje napak s povpraševanjiDebugging by observingSystem error searchSystem error search, when system hangsDebuggers and similar toolsSystem error search, when system hangsmake sure the system does not hang:in strategic places, add a system call schedule, which ensuresthat the task scheduler is called,we can review the process that has been looping,we can kill the process that was looping.We can still look for errors:we use this if we do not know where our code hangs,add printouts to the console (also change console loglevel)Jernej VičičLinux Device Drivers - debugging
IntroductionDebugging support in the kernelIskanje napak z izpisiIskanje napak s povpraševanjiDebugging by observingSystem error searchSystem error search, when system hangsDebuggers and similar toolsgdbkdb – Kernel Debuggerkgdb – kgdb PatchesUser-Mode Linux PortLinux Trace ToolkitDynamic ProbesDebuggers and similar toolslast resort)- slow,sometimes it is the only way,using the debugger at the core is a special problem:difficult to use breakpoints,it is difficult to use the running of a single step single step,Jernej VičičLinux Device Drivers - debugging
IntroductionDebugging support in the kernelIskanje napak z izpisiIskanje napak s povpraševanjiDebugging by observingSystem error searchSystem error search, when system hangsDebuggers and similar toolsgdbkdb – Kernel Debuggerkgdb – kgdb PatchesUser-Mode Linux PortLinux Trace ToolkitDynamic ProbesFormat ELFExecutable and Linkable Format (ELF),before: Extensible Linking Format,standard file format for:executables,object code,shared libraries,core dumps.Jernej VičičLinux Device Drivers - debugging
IntroductionDebugging support in the kernelIskanje napak z izpisiIskanje napak s povpraševanjiDebugging by observingSystem error searchSystem error search, when system hangsDebuggers and similar toolsgdbkdb – Kernel Debuggerkgdb – kgdb PatchesUser-Mode Linux PortLinux Trace ToolkitDynamic Probesgdbdebugger is started as if the kernel is just one of theapplications,give it a kernel image - (ELF kernel image),give it the name of the core file,for the kernel that is currently running is this file in/proc/kcore.Jernej VičičLinux Device Drivers - debugging
IntroductionDebugging support in the kernelIskanje napak z izpisiIskanje napak s povpraševanjiDebugging by observingSystem error searchSystem error search, when system hangsDebuggers and similar toolsgdbkdb – Kernel Debuggerkgdb – kgdb PatchesUser-Mode Linux PortLinux Trace ToolkitDynamic Probesgdb – usagegdb /usr/src/linux/vmlinux /proc/kcorefirst argument: uncompressed ELF image (not: zImage alibzImage – boot),second argument: name of core file, that is /proc datoteka.Jernej VičičLinux Device Drivers - debugging
IntroductionDebugging support in the kernelIskanje napak z izpisiIskanje napak s povpraševanjiDebugging by observingSystem error searchSystem error search, when system hangsDebuggers and similar toolsgdbkdb – Kernel Debuggerkgdb – kgdb PatchesUser-Mode Linux PortLinux Trace ToolkitDynamic Probesgdb – what does not workcan not modify kernel data,we can not set breakpoints or watchpoints,we can not execute individual steps single-step,If we want a symbolic table, we need to compile the kernelwith the CONFIG DEBUG INFO tag on,can not access the module code.Jernej VičičLinux Device Drivers - debugging
IntroductionDebugging support in the kernelIskanje napak z izpisiIskanje napak s povpraševanjiDebugging by observingSystem error searchSystem error search, when system hangsDebuggers and similar toolsgdbkdb – Kernel Debuggerkgdb – kgdb PatchesUser-Mode Linux PortLinux Trace ToolkitDynamic Probesgdb – new kernels and modules (current)from version 2.6.7,kernel modules are in ELF format,3 interesting parts:.text – executable module code,.bss – global module variables, uninitialized at compile time,.dat – global module variables, initialized at compile time,,Jernej VičičLinux Device Drivers - debugging
IntroductionDebugging support in the kernelIskanje napak z izpisiIskanje napak s povpraševanjiDebugging by observingSystem error searchSystem error search, when system hangsDebuggers and similar toolsgdbkdb – Kernel Debuggerkgdb – kgdb PatchesUser-Mode Linux PortLinux Trace ToolkitDynamic Probesgdb – new kernels and modules (current)present to the debugger where are the sections,this is written in /sys/module,for our example in: /sys/module/scull/sections,command that we use: add-symbol-file.Jernej VičičLinux Device Drivers - debugging
IntroductionDebugging support in the kernelIskanje napak z izpisiIskanje napak s povpraševanjiDebugging by observin
Introduction Debugging support in the kernel Iskanje napak z izpisi Iskanje napak s povpra sevanji Debugging by observing System error search System error search .