Transcription
MSCI ESG Research LLCNet-Zero AlignmentObjectives and Strategic Approaches for InvestorsGuido Giese, Zoltan Nagy, Chris CoteSeptember 2021
Net-Zero Alignment September 2021ContentsExecutive Summary .3Introduction: What is Net-Zero?.5Why Net-Zero?. 6Setting Net-Zero Objectives: The Role of Capital-MarketsParticipants .7Can Investors Drive Convergence? . 11Allocating Capital Away from High Emitters . 11Engaging with Laggards . 12Investing in Climate Solutions. 15Case Study: Coal to Gas Transition among US Power Generators . 15Low-Carbon Revenue and Performance . 17Capex Needs . 18Advocating for Carbon-Pricing Policies. 20Implementing Portfolio Net-Zero Pathways in Practice . 23Two Options for Constructing Net-Zero Portfolios . 23Taking the Temperature of Portfolio Companies . 28Conclusion . 30References . 32Appendix: Objectives for Net-Zero Investing . 33 2021 MSCI Inc. All rights reserved. Please refer to the disclaimer at the end of this document.MSCI.COM PAGE 2 OF 35
Net-Zero Alignment September 2021Executive SummaryThe 2015 Paris Agreement bound the world’s nations to limit climate change to anaverage temperature rise of well below 2 C by 2100, and preferably to no more than1.5 C. Meeting that goal means decarbonizing the global economy. Investors have akey role to play in this process and a financial incentive to help make it happen asefficiently as possible. Hence the rise of net-zero investing.Net-zero investing means implementing a decarbonization pathway for a portfolio,using its “emissions budget” to achieve a temperature scenario well below 2 C. Whilean investor could theoretically do this by holding a highly (or increasingly)concentrated portfolio of low- or zero-emissions companies, such an approachwould both be impractical for many large institutions and generally would fail toaddress the larger challenge of decarbonizing the broader economy. In effect, netzero investing means taking action to promote decarbonization of the economy aswell as the portfolio.We investigated three common approaches to net-zero investing to see whether theycan have a real impact on decarbonizing the economy: 1) shifting capital from morecarbon-intensive to less-carbon-intensive investments, theoretically influencingcompanies’ share price, cost of capital and access to capital; 2) engaging withindividual issuers directly, whether through shareholder voting or other stewardshipactivities (sometimes known as “alpha engagement”) to spur faster decarbonizationamong laggards; and 3) directing investments toward low-carbon technology.Policy advocacy for changes that affect the market as a whole, so-called “betaengagement,” is a fourth option, though it is more indirect. Climate change exists inpart because of a broad failure of the market to price in greenhouse gas (GHG)emissions, which has benefited carbon-intensive assets. While governments are bestpositioned to eliminate this free-rider problem, large investors may effect change byadvocating that governments bring about such policies quickly.To achieve a consistent decarbonization and a synchronized shift of capital, votingand engagement in favor of financing renewable technology, a top-down approachmay be needed. For example, active and indexed asset managers may supportinvestors with net-zero-related portfolio construction methodologies, climate-relatedrisk management and reporting services, and support in stewardship.From a portfolio construction perspective, a decarbonization pathway could beimplemented in at least three different ways: Tilting toward low emitters: This approach periodically rebalances towardlow emitters. It is relatively easy to implement — requiring only carbon- 2021 MSCI Inc. All rights reserved. Please refer to the disclaimer at the end of this document.MSCI.COM PAGE 3 OF 35
Net-Zero Alignment September 2021 footprint data — but may lead to more concentrated portfolios and, in thelong run, may result in crowding effects in less-carbon-intensive assets.Tilting toward decarbonization leaders: This approach periodicallyrebalances toward decarbonization leaders. It requires a forward-lookingassessment of companies’ rate of decarbonization. It also requires asufficiently large universe of emission-reducing companies, which wouldhave been a limiting factor in the past.Combined approach: Investors may try to combine both approaches toachieve consistent decarbonization rates over time and mitigate the risk ofcrowding in less-carbon-intensive assets. This combined approach may be anatural outcome over time as the decarbonization of the economy createsmore opportunities for net-zero investing.Our analysis suggests that the four strategic levers that investors have at theirdisposal to accelerate companies’ decarbonization — a shift of capital, activestewardship, financing of low-carbon solutions and policy advocacy — canincentivize companies to lower their carbon footprints. However, our analysis alsoshowed that these levers haven’t yet been used at sufficient scale. A more consistentand coordinated investor effort across all four economic levers may help acceleratechange. 2021 MSCI Inc. All rights reserved. Please refer to the disclaimer at the end of this document.MSCI.COM PAGE 4 OF 35
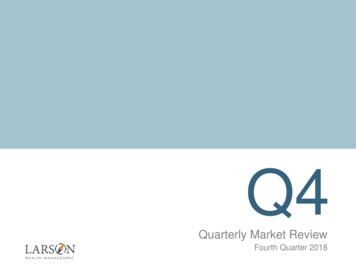
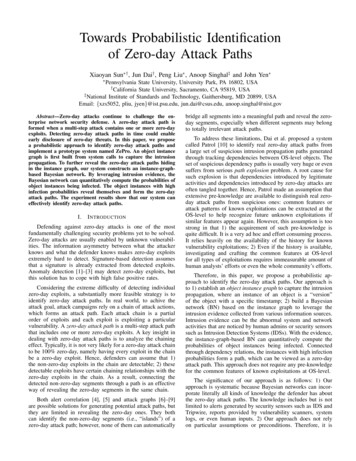
Net-Zero Alignment September 2021Introduction: What is Net-Zero?Climate change is the single greatest challenge humankind has faced and itsconsequences are already all too apparent. There has been an enormous rise inclimate disasters over the past two decades, leading to the deaths of over 1.2 millionpeople and affecting more than 4 billion people in total.1 To safeguard the livability ofour planet for future generations, global political leaders adopted a goal of limitingthe increase in global average temperatures to well below 2 C above pre-industriallevels under the 2015 Paris Agreement.2Efforts to achieve the Paris Agreement goal of limiting temperature rise are nowwidely called “net-zero,” a scenario in which no more greenhouse gas emissionsenter the atmosphere than are removed.It is important to emphasize that to limit global warming well below 2 C, reachingnet-zero emissions in the long run is not sufficient. Greenhouse gas emissionsaccumulate in the atmosphere, so there is a limit to how much we can emit along thejourney to net-zero: The IPCC3 (Intergovernmental Panel on Climate Change) hasestimated the world’s remaining “emissions budget” to be cumulative emissions of400 gigatons (Gt) of C02 to limit warming to 1.5 C and 1,150 Gt of cumulative C02emissions to limit warming to 2 C, with a 67% confidence level (with budgets startingas of Jan. 1, 2020).As shown in Exhibit 1, these emissions budgets are effectively the area under theworld’s decarbonization pathways.4 Depending on the targeted temperature and theassumed shape of the decarbonization pathways, this may result in different net-zeroforecasts for when the world ultimately achieves net-zero emissions. Nevertheless, itis widely recognized that the world needs to reach net-zero by 2050 at the very latest,remaining within its emissions budget — to maximize the likelihood of achieving theobjective of the Paris Agreement.51“Human cost of disasters: An overview of the last 20 years, 2000-2019.” Centre for Research on theEpidemiology of Disasters and UN Office for Disaster Risk Reduction. Nov. 3, 2020.2The IPCC Special Report on Global Warming of 1.5 C uses the reference period 1850–1900 to represent preindustrial temperature. See the “Frequently Asked Questions” section of the report.3“Climate Change 2021: The Physical Science Basis.” 2021. Intergovernmental Panel on Climate Change.Climate4Decarbonization pathways refer to the pace and trajectory of GHG emissions reduction of the economy to staywithin a carbon budget. They include assumptions on policy, technology, and market shifts, among otherfactors.5“Net Zero by 2050.” International Energy Agency, 2021. 2021 MSCI Inc. All rights reserved. Please refer to the disclaimer at the end of this document.MSCI.COM PAGE 5 OF 35
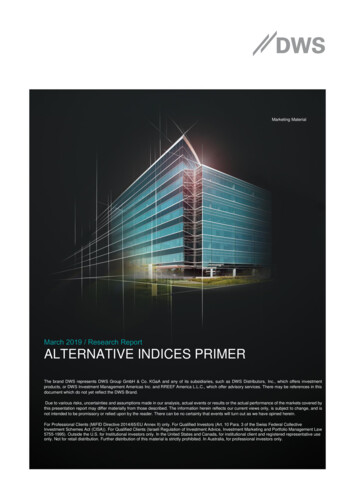
Net-Zero Alignment September 2021Exhibit 1: Global Decarbonization Pathways and Remaining Emissions BudgetsWHY NET-ZERO?The purpose of this series of papers is to provide insights that may support investorsin building their net-zero alignment strategy and its implementation. Given the sizeand nature of the challenge, this requires implementing a net-zero framework thatcovers all relevant areas of the asset management value chain (Exhibit 2).Exhibit 2: MSCI Net-Zero Investment FrameworkIn this first paper of the series, we address the following conceptual questions, whichare linked to the definition of net-zero objectives and their strategic implementation: Does net-zero investing align with investors’ overall interests? Can net-zero investing help lead to a net-zero economy? What are practical considerations for creating a net-zero portfolio that also drivesdecarbonization in the real economy? 2021 MSCI Inc. All rights reserved. Please refer to the disclaimer at the end of this document.MSCI.COM PAGE 6 OF 35
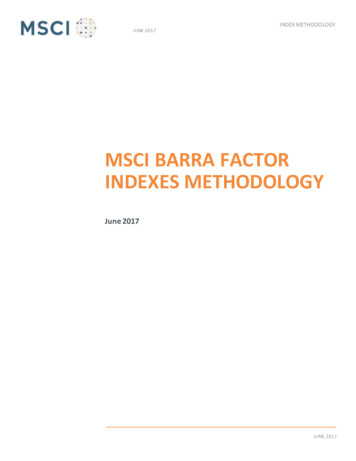
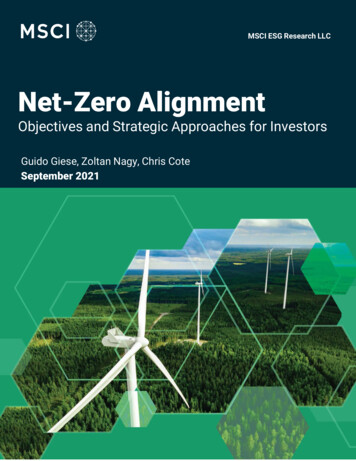
Net-Zero Alignment September 2021Subsequent research will address more practical questions of net-zero investing,such as capital allocation and portfolio-construction methodologies, portfolio riskmanagement frameworks, and stewardship and engagement considerations.Setting Net-Zero Objectives: The Role of CapitalMarkets ParticipantsCapital markets have a crucial role to play in the construction of a net-zero economy,from driving change in existing businesses to financing technological progress inorder to create less-carbon-intensive businesses. The transition to a net-zeroeconomy presents investors with entirely new risks and opportunities. As with theprevious industrial revolutions, investors may expect what the Austrian economistJoseph Schumpeter called a phase of ‘’creative destruction,” where new innovative(low-carbon) technology replaces existing (carbon-intensive) technology. To providea sense of the size of this creative destruction, we simulated the discounted futurecost of implementing a 1.5 C-compliant decarbonization pathway for companies inthe MSCI ACWI Investable Markets Index (IMI), using the MSCI Policy Climate Valueat-Risk methodology.Exhibit 3 shows that the energy, utilities and materials sectors bear the brunt ofexpected decarbonization costs, which were expected to exceed companies’ currentbook values and equal several decades of companies’ current earnings. While someof these decarbonization costs may be offset by generating new earnings fromclean-technology solutions, it seems unlikely that this new revenue will exactly matchthe decarbonization costs in their size and the timing. Therefore, the results in Exhibit3 suggest that the most affected sectors will very likely need fresh capital to financetheir low-carbon transition and to develop new technology that can generate newcarbon-free revenue. 2021 MSCI Inc. All rights reserved. Please refer to the disclaimer at the end of this document.MSCI.COM PAGE 7 OF 35
Net-Zero Alignment September 2021Exhibit 3: Simulated Cost of Implementing a 1.5 C Decarbonization PathwaySource: MSCI ESG Research LLC. Data as of June 30, 2021.The charts show the simulateddiscounted future cost of decarbonization in years of current earnings (left) and in multiples ofcurrent book values (right).This raises two important questions for investors:1. How to best position capital allocations to avoid losses and/or profit from thiseconomic reconstruction?2. To what extent can reducing the carbon intensity of capital allocations help drivethe necessary decarbonization of the global economy?Since the Paris Agreement was signed in 2015, listed companies’ carbon intensityincreasingly has affected financial performance: Giese et al. (2021) found that since2015, the most-carbon-intensive companies in the MSCI ACWI IMI started tounderperform less-carbon-intensive sector peers in terms of both stock performanceand earnings growth (before and after controlling for other equity factors). At thesame time, companies that were less carbon-intensive outperformed the marketafter controlling for other factors. However, these financial effects mainlymaterialized in the most-carbon-intensive companies and the leading companies inlow-carbon solutions; about 75% of MSCI ACWI IMI constituents were little affectedfinancially.The second question is linked to the impact that investors can have on the economy.Ultimately, the bulk of global emissions in the listed equity markets comes notdirectly from the financial sector but from the corporate sector, especially theutilities, materials and energy sectors.6 However, investors can exercise significantinfluence on companies, including those in these carbon-intensive sectors, through6While financial institutions direct Scope 1 emissions and Scope 2 emission are typically relatively lowcompared to other GICS sectors, they can have significant Scope 3 emissions, e.g., through their lendingbusiness. 2021 MSCI Inc. All rights reserved. Please refer to the disclaimer at the end of this document.MSCI.COM PAGE 8 OF 35
Net-Zero Alignment September 2021capital allocation and active ownership, thereby impacting their decarbonizationpathway.There is also a financial benefit linked to this impact argument: Scientific expertshave developed climate scenarios to illustrate potential pathways for the globaleconomy to move toward a net-zero economy. While they differ on their assumptionsand simulated pathways, they concur that the long-term cost-minimizingsolution — i.e., humanity’s best outcome — is to achieve net-zero as quickly aspossible and no later than 2050.7 Therefore, accelerating companies’decarbonization is also a way to minimize the overall negative costs for the globaleconomy and for investors, thus aligning their interests.In other words, while the first question — how to take advantage of the climaterevolution within a portfolio — is about creating ‘’better alpha’’ in an investor’sportfolio, the second question — shifting the real economy onto a net-zero path — isabout creating a better ‘’market beta,’’ alongside better outcomes for humanity andthe planet.If investors focus only on the first question, we could end up with a “divergence”scenario as illustrated in Exhibit 4, in which only some companies within the MSCIACWI IMI become net-zero. Consequently, only very concentrated investmentportfolios that focus on net-zero leaders would be able to reach net-zero. In contrast,the broad market and the economy at large would incur higher costs (monetary,human and environmental) across the global economy. A focus on both questionscould drive a “convergence” scenario in which net-zero investors lead the broadmarket in their decarbonization pathway, but the market eventually catches up —preferably before 2050.7IPCC. 2018. “Summary for Policymakers.” In: Global Warming of 1.5 C. An IPCC Special Report on the impactsof global warming of 1.5 C above pre-industrial levels and related global greenhouse gas emission pathways, inthe context of strengthening the global response to the threat of climate change, sustainable development, andefforts to eradicate poverty.” 2021 MSCI Inc. All rights reserved. Please refer to the disclaimer at the end of this document.MSCI.COM PAGE 9 OF 35
Net-Zero Alignment September 2021Exhibit 4: Net Zero Pathway Scenarios of Capital MarketsDivergence scenarioConvergence scenarioHow can investors help drive convergence? The main strategic levers we haveidentified are: Capital Reallocation: Limiting capital allocated to high-carbon emission entitiesStewardship and Engagement: Using voting and engagement targeted on netzero laggards.Climate Solutions: Directing financing of low-carbon projects and technologythrough private markets, corporate lending and investing in green bonds.Policy Advocacy: Advocating for rules and regulations that internalize the cost ofGHG emissions.In the next section, we examine whether these levers have already helped investorsdecarbonize their portfolios and the economy. 2021 MSCI Inc. All rights reserved. Please refer to the disclaimer at the end of this document.MSCI.COM PAGE 10 OF 35
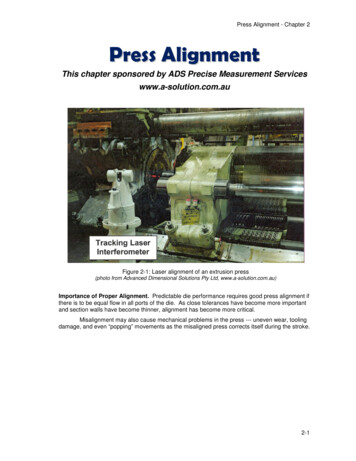
Net-Zero Alignment September 2021Can Investors Drive Convergence?ALLOCATING CAPITAL AWAY FROM HIGH EMITTERSAs a first step, we looked at whether companies’ carbon intensity has affected theirvaluation and cost of capital over time. In short, we found that, since 2014, there hasbeen a statistically significant change in how equity markets priced companies’book value and cost of capital depending on their fossil-fuel exposure.While existing literature analyzes how companies’ overall ESG profile has affectedthe cost of capital in equity markets (El Ghoul et al., 2011; Lodh, 2020), comparableresearch related to climate change is more limited. In this analysis, we focused onglobal equity markets as defined by the MSCI ACWI IMI from October 2014 throughMarch 2021. On a monthly basis, we regressed companies’ price-to-book ratio (P/B)and companies’ cost of equity capital versus their carbon intensity (Scope 1 and 2emissions per USD sales, as reported, or estimated where not reported) asexplanatory variables, using company size, industry and style factors as controlvariables (Exhibit 5).8Exhibit 5: Regression Coefficients of Monthly Cross-Sectional Regression ofCompanies’ P/B and Cost of Equity vs. Emissions IntensitySource: MSCI ESG Research. MSCI ACWI IMI data from October 2014 to March 2021. The chartshows the history of monthly cross-sectional regression coefficients for companies’ price to book(P/B) and cost of equity, regressed versus companies’ Scope 1 and 2 emission intensity.8Scope 1 emissions stem from direct use while Scope 2 emissions are from purchased energy. 2021 MSCI Inc. All rights reserved. Please refer to the disclaimer at the end of this document.MSCI.COM PAGE 11 OF 35
Net-Zero Alignment September 2021While the absolute values of the regression coefficients for P/B and cost of equitycapital were relatively small, we observed two trends: First, carbon-intensivecompanies saw a relative decline in their P/B ratio, all other parameters being equal.This means that financial markets became increasingly cautious in valuingcompanies whose book value had a high likelihood of containing potentially strandedassets due to their involvement in the fossil-fuel value chain.The second observation is that carbon-intensive companies also experienced atrend toward increasing cost of capital. The impact on their cost of capital was notas strong as seen in the previously cited studies looking at ESG ratings, possiblybecause ESG ratings, and in particular governance-related risks, have existed longerand therefore have been priced in by markets, while markets only recently havestarted to price climate change into equity valuations (Giese et al., 2021).Both these trends were statistically significant, as we can see in Exhibit 6.Exhibit 6: T-Statistic of Trend in Regression Coefficient of Companies’ P/B and Costof Equity vs. Emissions IntensitySource: MSCI ESG Research. MSCI ACWI IMI data from October 2014 to March 2021.ENGAGING WITH LAGGARDSAs a second step, we looked for empirical evidence of the effectiveness of investorengagement with individual companies on climate-related targets. We call thisapproach “alpha engagement.”9 Anecdotally, we found that, at least in certaininstances, investor engagement or pressure may cause a company to alter itsbehavior.More broadly, there is established literature highlighting the effectiveness ofcompany engagement in changing company behavior and performance. For9For more on the distinction between alpha and beta engagement, see Lee, L.-E. et al., “2016 ESG Trends toWatch: Power in Numbers.” MSCI. Jan. 11, 2016. 2021 MSCI Inc. All rights reserved. Please refer to the disclaimer at the end of this document.MSCI.COM PAGE 12 OF 35
Net-Zero Alignment September 2021instance, a study on the financial effect of engagement by CalPERS on 188 U.S.listed companies from 1999 to 2013 found abnormally high average stock returns inthe period after successful engagements (Junkin, 2015). Similar results were foundby Bebchuk et al. (2017), who looked at engagement at U.S.-listed companies from2000 till 2013. They found “that activist engagements that produce settlementagreements are associated with higher abnormal stock returns at the time of theactivist’s initial 13D filing. These patterns are overall consistent with the view that themarket views favorably the boardroom composition and other changes that activistsettlements produce, and are inconsistent with the view that such changes can beexpected to be disruptive and detrimental to target shareholders.”However, there exists little substantive research on the effectiveness of engagementwith respect to climate change, in part because not quite five years have elapsedsince the Paris Agreement became effective in November 2016. Nevertheless, somerecent examples of engagement with large fossil-fuel-intensive companies illustratethe degree of leverage investors can have. For instance, in April 2021 Exxon Mobilbowed to shareholder pressure to report its Scope 3 emissions; in addition, activistinvestor Engine No.1 won the election of three board members in response tocomplaints about the company’s lack of initiative regarding climate change.10, 11Another recent example is Equinor ASA of Norway, which announced new and morestringent climate targets following a shareholder petition seeking them.12 Whilethese examples demonstrate the effectiveness of shareholder engagement onclimate-change strategies in specific cases, it is unclear to what extent engagementmay lead to wider systemic changes.To address this question, we first looked at all climate-related shareholder proposalsat U.S. energy and utilities companies from 2018 through July 2021. For bothsectors, the number of climate-related proposals was highest in 2018 (Exhibit 7). Theenergy sector experienced the highest approval rates for climate-related proposals in2020 and 2021 (and a corresponding increase in average percentage votes in favorof the proposals), showing that investors in U.S. energy companies became moreconcerned with climate change risks. In contrast, in the utilities sector the number ofproposals and accepted proposals decreased over time.10”Scope 3 emissions.” ExxonMobil, April 23, 2021.11Phillips, M. “Exxon’s Board Defeat Signals the Rise of Social-Good Activists.” New York Times, June 9, 2021.12See “Proposals from shareholders and responses from the board of directors.” for Equinor ASA.” May 11,2021. 2021 MSCI Inc. All rights reserved. Please refer to the disclaimer at the end of this document.MSCI.COM PAGE 13 OF 35
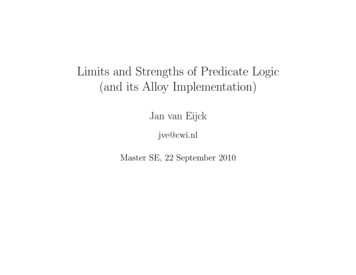
Net-Zero Alignment September 2021Exhibit 7: Number of Approved/Defeated Climate Proposals in US Energy andUtilitiesEnergyUtilitiesSource: MSCI ESG Research. The chart shows the number of defeated and approved climate-relatedshareholder proposals in the U.S. energy and materials sectors (left scale) and the averagepercentage of votes in favor (right scale).These mixed trends in two carbon-intensive sectors suggest that while investorswere able to affect companies’ climate policy in specific cases, engagement had notbeen used at a large scale to drive decarbonization efforts across a broadinvestment universe.An important question is whether coordinated investor actions may help to increasethe frequency and effectiveness of engagement. One such investor-led initiative isClimate Action 100 , which was founded in December 2017 to support moretargeted engagement on climate change. The organization maintains a public list ofthe world’s largest GHG emitters, including 38 U.S. companies. These companiesincluded in their proxy statements on average 8.3 climate-related shareholderproposals from 2017 to 2021. This compares to an average of 3.9 climate proposalsof the 506 U.S. companies in MSCI ACWI IMI that had at least one shareholder 2021 MSCI Inc. All rights reserved. Please refer to the disclaimer at the end of this document.MSCI.COM PAGE 14 OF 35
Net-Zero Alignment September 2021proposal. The average market capitalization of the 38 companies (USD 99.9 billion)was somewhat higher than the larger control group (USD 68.3 billion). While this maynot prove causality, it shows that U.S. companies on the Climate Action 100 listexperienced a higher frequency of shareholder engagement on climate. Suchcoordinated actions may increase as others leverage this list: The Net-Zero AssetOwner Alliance recommends focusing engagement on top emitters.INVESTING IN CLIMATE SOLUTIONSInvestors can help decarbonize the economy by allocating capital away from carbonintensive businesses and by engaging with companies to change their behavior. Thethird main lever for change that we examined is the direction of capital towardbusinesses that can help facilitate the transition to a net-zero economy. Investing incompanies that prioritize the development, sale or deployment of low-carbon techsolutions — e.g., wind turbines and solar, green buildings, agricultural innovations —can reduce emissions in a portfolio and in the economy.We approach this section in three parts: First, we present a case study of the coal-togas transition among U.S. power generators in the 2010s that shows how, under theright circumstances, an industry can undergo a rapid reduction in emissions. Next,we show that companies with higher shares of low-carbon revenue have postedbetter market performance during our study period (i.e., earnings per share andreturns) among carbon-intensive industries such as energy, utilities and materials.Finally, we examine capital expenditure rates in renewable energy in these industriesto see the extent of future investment that may be required.CASE STUDY: COAL TO GAS TRANSITION AMONG US POWER GENERATORSInvestments can help drive the move to a low-carbon society. One key example ofthis is the U.S. utilities sector, where the shift from coal to gas in the U.S. beginningin 2000 led to a reduction in operational carbon emissions (Scopes 1 and 2) amongpower generators. While natural gas is not a renewable or low-carbon technology,generating electricity from natural gas instead of coal can reduce emissions by asmuch as 40%.1313Lifecycle emissions of generating electricity from combined cycle natural gas are 490 CO2 equivalent perkilowatt hour (gCO2e/kWh), compared to 820 gCO2e/kWh from pulverized coal. Source: “Annex III: Technologyspecific Cost and Performance Parameters. Table A.III.2. Emissions of selected electricity supply technologies(gCO2eq/kWh).” Intergovernmental Panel on Climate Change. 2018 2021 MSCI Inc. All rights reserved. Please refer to the disclaimer at the end of this document.MSCI.COM PAGE 15 OF 35
Net-Zero Alignment September 2021A significant shift from coal to gas occurred from 2010–2019 among constituents ofthe MSCI USA IMI with power-generating capacity (Exhibit 8)14 We estimated thatconstituent companies invested USD 83.7 billion to add 86.2 gigawatts (GW) ofnatural gas capacity during this 10-year period.15 Partially as a result of this shiftfrom coal to gas, Scope 1 and 2 CO2 emissions declined among these companies by34% during the same period, from 1.4 gigatons in 2010 to 0.9 gigaton in 2019.Exhibit 8: Electricity Generation Capacity and Scope 1 and 2 Carbon Emissions,2010 – 2019Source: MSCI ESG Research; U.S. Energy Information Administration, as of June 2021. Data based onMSCI USA IMI constituents as of July 2021.Three main factors help explain this outcome: technological advancements, marketfundamentals (supply and demand) and regulatory changes.First, technological advancements — principally the success of hydraulic fracturing(“fracking”) — led to increased availability of natural gas in the U.S.16 For example,1448 constituents of the MSCI USA IMI as of Jul. 14, 2021.15Overnight capital costs of USD 970,000 per MW of natural gas combined cycle capacity. Source: “LevelizedCost of New Generation Resources in the Annual Energy Outlook 2013.” U.S. Energy Information Administration.2013.It is important to note that the advent of fracking has led to other environmental problems, and there iswidespread disagreement on the role natural gas should play in a low-carbon transition. The point here is tosimply illustrate that a shift from coal to gas led to a reduction in emissions from power generation.16 2021 MSCI Inc. All rights reserved. Please refer to the disclaimer at the end of this document.MSCI.COM PAGE 16 OF 35
Net-Zero Alignment September 2021U.S. natural gas production from shale plays, which are fracked to extract oil and gas,increased to 16.65 billion cubic feet per day (bcfd) in 2010, nearly five times greaterthan the 3.63 bcfd produced in 2000.Second, this surge in natura
WHY NET-ZERO? The purpose of this series of papers is to provide insights that may support investors in building their net-zero alignment strategy and its implementation. Given the size and nature of the challenge, this requires implementing a net-zero framework that covers all relevant areas of the asset management value chain (Exhibit 2).