Transcription
Gene Selection for CancerClassification using Support VectorMachinesAixia GuoDepartment of Mathematics, UHMay 08, 2014
Content Motivation Methodology Problem Description and Prior Work Support Vector Machines (SVMs) andRecursive Feature Elimination (RFE) Experimental Results Conclusion
Motivation Cancer vs Normal tissuesMicro-array technology measures expression level of10,000 30,000 genes simultaneously in a singleexperimentMicro-array devices generate bewildering amountsof raw dataMethods are needed to sort out whether cancertissues have distinctive signatures of geneexpression over normal tissues or other types ofcancer tissues
Motivation Cancer vs Normal tissuesMicro-array technology measures expression level of10,000 30,000 genes simultaneously in a singleexperimentMicro-array devices generate bewildering amountsof raw dataMethods are needed to sort out whether cancertissues have distinctive signatures of geneexpression over normal tissues or other types ofcancer tissues
MethodologyAddress the problem by a new method of gene selectionutilizing Support Vector Machine(SVM) methods based onRecursive Feature Elimination (RFE)(1)To select a small subset of genes from broad geneexpression data(2) To build a classifier by using available training examplesfrom cancer and normal patients
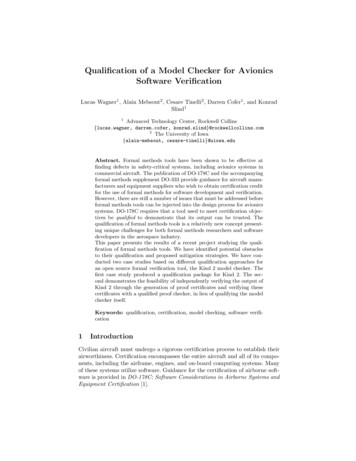
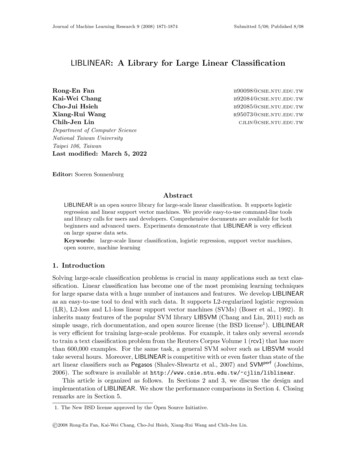
TerminologyGene feature attribute columnPattern: a vector of n components (features)PatientGene 1Gene 2 Gene nClass1100.30200.52 1000.11 220.56500.31 600.75- m150.241000.20 300.33-Example of gene expressions
Prior Works of Space Dimensionality Reduction A common method to reduce feature space dimensionProject on the first few principle directions of the data(see,e.g.Duda, 73)New features obtained are linear combinations of the originalfeatures DisadvantagesNone of the original input features can be discarded New pruning techniques are neededEliminate some of the original input features and retain aminimum subset of features that yield best classificationperformance
Feature-ranking Technique Feature ranking with correlation coefficientsSelect the genes that individually classify best the trainingdataEliminate genes that are useless for discrimination Evaluating how well an individual feature contributes to theseparation (e.g. cancer vs normal) can produce a simplefeature (gene) ranking.
Various correlation coefficients are used as ranking criteria. Thecoefficient used in Golub (1999) is defined as:wi (μi ( ) μi ( ))/(σi ( ) σi ( ))where μi and σi are the mean and standard deviation of thegene expression values of gene i for all the patients of class( ) or class ( ), i 1, . . . n. Large positive wi values indicatestrong correlation with class ( ) whereas large negative wivalues indicate strong correlation with class ( ).
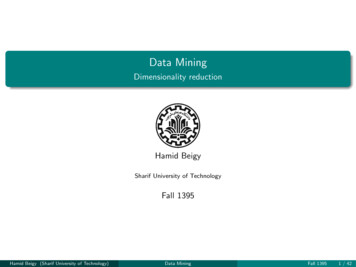
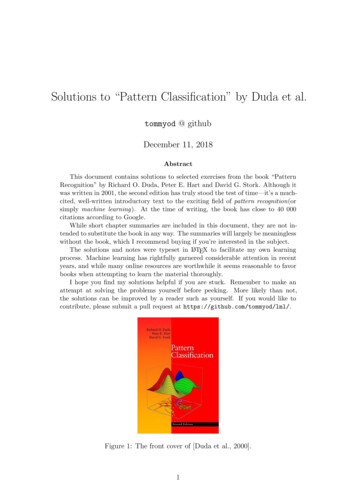
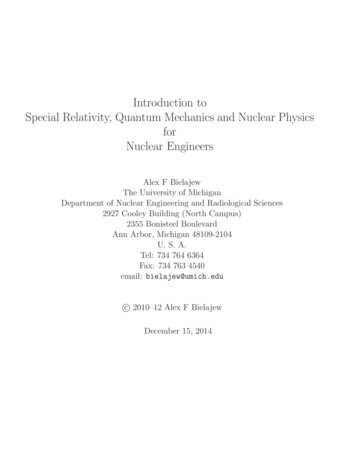
Recursive Feature Elimination1) Train the classifier2) Compute the ranking criterionfor all features3) Remove the featurewith smallest ranking criterion4) Repeat
Feature Ranking with Support Vector machines(SVM) Idea from using the weights of a classifier to produce afeature rankingIn this paper, the classifier used is linear SVMs (Boser,1992; Vapnik, 1998)Presently SVM is one of the best-known classificationtechniques with computational advantages over theircontenders (Cristianini, 1999).
SVM Recursive Feature Elimination (SVM RFE)SVM RFE is an application of RFE using the weight magnitude as rankingcriterion. Below is an outline of the algorithm in the linear case, usingSVM-train in Eq. (5).
Experimental Results1) A small subset of selected features have thebest classification results2) The features selected matter more than theclassifier used3) SVM-RFE selects relevant genes
Gene Expression Dataset and the Classification ProblemLeukemia data is available on-line. The problem is to distinguishbetween two variants of leukemia (ALL and AML).The data is split into two subsets: A training set, used to selectgenes and adjust the weights of the classifiers, and anindependent test set used to estimate the performance of thesystem obtained.Their training set consists of 38 samples (27 ALL and 11 AML)from bone marrow specimens. Their test set has 34 samples (20ALL and 14 AML), prepared under different experimentalconditions and including 24 bone marrow and 10 blood samplespecimens. All samples have 7129 features, corresponding tosome normalized gene expression value extracted from themicro-array image.
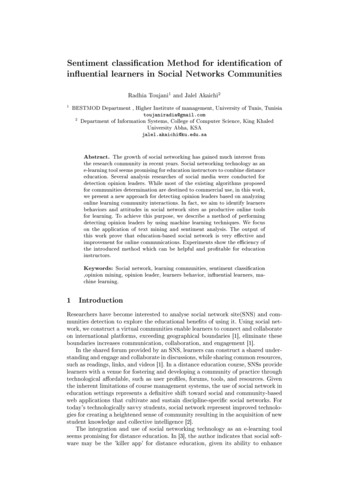
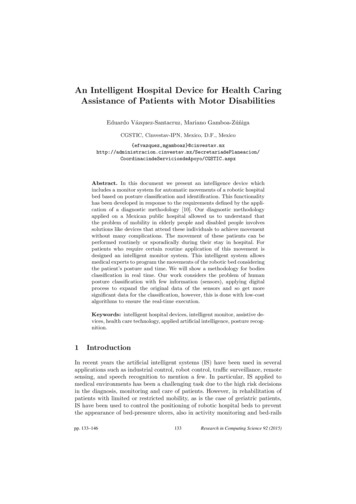
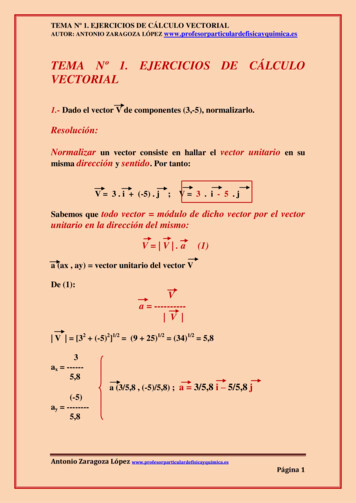
A small subset of selected features have the best classificationresults# of genesTrain accuracyTest accuracyAll .97161.001.0081.001.0040.970.9120.970.8810.920.79
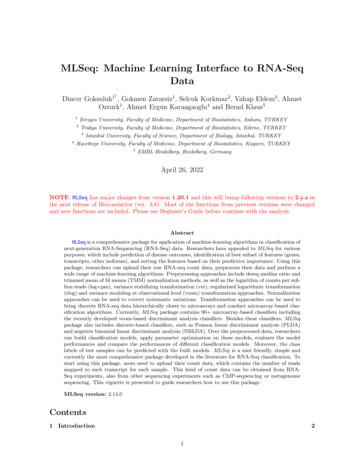
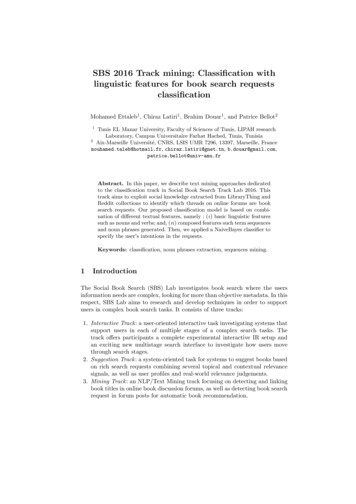
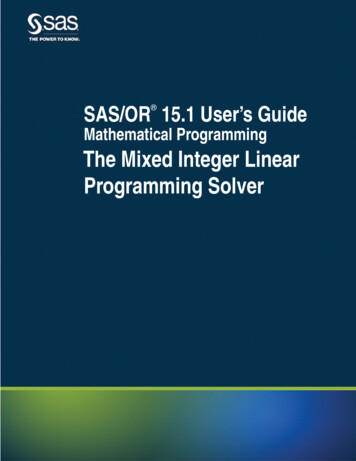
Features selected matter more than the classifier usedFewer genes selected by SVMRFE have better classificationresults comparing to the genesselected by correlation
Features selected matter more than the classifier usedBaseline classifier (not SVM) hasbetter classification results withthe SVM-RFE features comparingto using the baseline genes(correlation selected genes)
SVM-RFE selects relevant genes
Conclusion The genes selected by SVM-RFE yield betterclassification performance (rather than theclassifiers)The selected genes are closely related to thediseasesIn contrast with the baseline method, theirmethod eliminates gene redundancyautomatically and yields better and morecompact gene subsets
References[1] Boser, B., Guyon, I., & Vapnik, V. (1992). An training algorithm for optimalmargin classifiers. In Proceedings of the Fifth Annual Workshop onComputational Learning Theory (pp. 144–152). Pittsburgh: ACM.[2] Cristianini, N. & Shawe-Taylor, J. (1999).An introduction to support vectormachines. Cambridge, MA: Cambridge University Press.[3] Duda, R. O. & Hart, P. E. (1973). Pattern classification and scene analysis.New York: Wiley.[4]Golub, T. R., Slonim, D. K., Tamayo, P., Huard, C., Gaasenbeek, M., Mesirov,J. P., Coller, H., Loh, M. L.,Downing, J. R., Caligiuri, M. A., Bloomfield, C. D., &Lander, E. S. (1999). Molecular classification of cancer:Class discovery andclass prediction by gene expression monitoring. Science, 286, 531–537. Thedata is available on-line at http://www.genome.wi.mit. edu/MPR/data set ALLAML.html.[5] Vapnik, V. N. (1998). Statistical learning theory. Wiley Interscience.
Thank you
e.g. Duda, 73) New features obtained are linear combinations of the original features Disadvantages None of the original input features can be discarded New pruning techniques are needed Eliminate some of the original input features and retain a minimum subset of features that yield best classification performance