Transcription
Commercial Real Estate and the 1990-91 Recession in the United StatesBy David GeltnerMassachusetts Institute of TechnologyDepartment of Urban Studies &Planning, MIT Center for Real EstateFor the Korea Development Institute1st Draft (January 2013)Abstract:This paper presents an historical review of the 1990-91 recession in the United States with aparticular focus on the role of commercial real estate (CRE). It is felt that this particular recessionmay be an exemplar of possible “contagion” between CRE and the real economy, as there was asubstantial crash in CRE pricing which began prior to 1990. The paper also surveys some broadercontext for this question, with a review of American business cycles since World War II, and areview of CRE cyclicality, including a comparison between CRE and housing cyclicality. Thepaper suggests that CRE in general, and in particular the asset pricing spike of the mid to late1980s, was not a major cause of the 1990-91 recession, and indeed that in general CRE, in contrastto housing, tends not to play a major role either in causing, or in helping to recover from, recessionsin the U.S. real economy. However, this is not to say that there is no relationship, or that CREnever has or never could play an important role in recessions. In particular, CRE is an importantasset class within the financial sector, and the financial industry can be vulnerable to (and cancause) pricing bubbles in the CRE asset market. Such a problem did occur in the late 1980s,particularly in the savings and loan crisis, which is reviewed in some depth in this paper. CRE wasmuch more intertwined with the S&L crisis than it was with the 1990-91 recession, as the creditcrunch which followed from the crisis probably played only a secondary role in causing therecession. Though CRE was important, the S&L crisis was much broader and deeper than just areflection of excesses in the CRE industry. The paper concludes with a review of the policyresponses taken to the S&L crisis, especially the FIRREA law of 1989, including someramifications in the CRE finance industry that ended up playing a role in the Global FinancialCrisis of 2008-09.1
Table of Contents1. Post-war U.S. Business Cycles . 41.1. Survey of Eleven Post-war Business Cycles . 41.2. Recession Regimes and a Typology of Recessions . 62. Commercial Real Estate Cyclicality in the U.S. 82.1 Construction Cycles . 92.2 Real Estate Asset Market Pricing Cycles . 102.3 Commercial Real Estate Asset Price Cycles 132.4 Space Market and Asset Market Cycles . 143. The Causes of the 1990-91 Recession and the Role of Commercial Real Estate . 153.1 Literature Review: What the Economists Have Said 153.2 Summarizing the Causes of the 1990-91 Recession . 183.3 The S&L Crisis and the CRE Asset Price Bubble of the 1980s . 213.4 Summarizing the Causes of the S&L Crisis . 263.5 Summary: The Role of CRE . 274. The Policy Response and Its Aftermath . 284.1 Risk Based Capital Requirements . 284.2 FIRREA . 294.3 The RTC and the Birth of the CMBS Industry . 315. Conclusion . 332
Commercial Real Estate and the 1990-91 Recession in the United StatesBy David GeltnerFor the Korea Development Institute1st Draft (January 2013)The Global Financial Crisis of 2007-09 (GFC) has had far-reaching effects on financial,economic and political conditions in the world as well as on policy development in manycountries. The Crisis was clearly caused or at least triggered to a major degree by developmentsin the housing sectors in the U.S. and some European countries. This raises awareness of the rolethat real estate cycles can play in broader financial and economic conditions, in particular,possible “contagion” from the real estate sector to the broader financial sector and real economy.Responding to this consideration, the Korea Development Institute (KDI) in December 2012organized an international symposium on “Real Estate Driven Systemic Risk: Country Cases andTheir Policy Implications.” This paper presents one of the cases examined in that symposium,the case of the commercial real estate cycle of the 1980s in the United States and the ensuingrecession in the American economy in 1990-91.Although the 1990-91 recession in the U.S. was not particularly severe, it was significantand of course painful to those who suffered in it. And while most of the concern about thegeneral relationship between real estate and the broader financial industry and macro-economyfocuses understandably on the housing sector, the 1990-91 U.S. recession was one examplewhere the commercial property sector almost certainly played a larger role than housing. Indeed,if it is possible to blame any economic downturn on commercial real estate, then surely theAmerican 1990-91 recession is one of the prime candidates. This may give this case study aparticular interest. If we cannot blame the 1990-91 U.S. recession on commercial real estate, thenit may be difficult to ever place much blame on commercial real estate (as distinct from housing)as a prime cause of any major macro-economic recession. So, we will keep this question in mindas a sort of lure or quest: How responsible was commercial real estate for the 1990-91 U.S.recession?The intellectual approach in this paper is that of historical research. It does not develop oremploy rigorous or formal (but inevitably narrow) economic or econometric models, but insteadadopts the more holistic approach of the historian, based on relevant data and largely secondarysources of writing about the subject period. The paper is organized into five sections. The firstputs the 1990-91 recession into context by briefly surveying post-war business cycles in the U.S.The second explores the nature of commercial real estate cyclicality in the U.S., with somecontrast to the housing sector. The third section will zero in on the recession of 1990-91 and itscauses, with a particular view to the role of commercial real estate (including the “Savings &Loan Crisis” and resulting “credit crunch”). The fourth section will review the policy responsesrelated to the S&L Crisis, notably the Financial Institutions Reform, Recovery & EnforcementAct of 1989 (FIRREA) and some key consequences thereof. A fifth section will briefly conclude.3
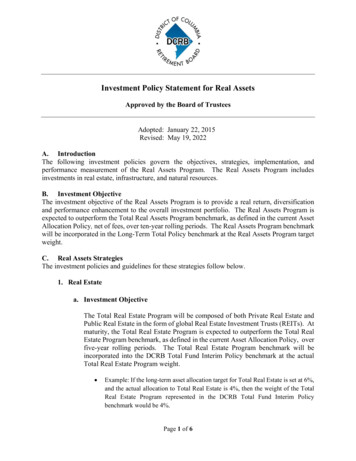
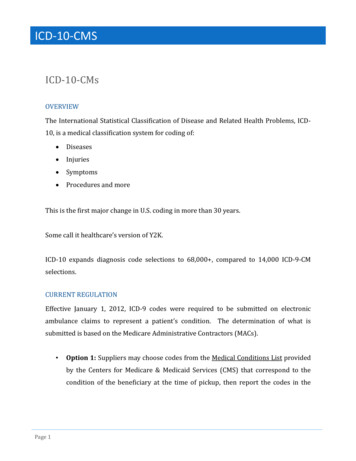
1. Post-war U.S. Business CyclesLet us begin by placing the 1990-91 U.S. recession in its proper context, as an example ofmacro-economic downturns in recent American history. The United States is a very matureeconomy and entered the 20 th century as already one of the most developed and advancedeconomies in the world, a status that if anything it only strengthened by the middle of the 20 thcentury in spite of experiencing an historically deep and long depression in the 1930s. As horrificas World War II was (1941-45 for the U.S.), it did finally propel the U.S. out of the economicdoldrums, and the country entered the second half of the century with a vast industrial andagricultural capacity, a strong financial capital base, a demographic boost in the making with thepost-war “baby boom” starting up,and an appetite for governmentU.S. Real GDP, 1947-20122012 Dollars (Billions):shaded bars recessions expenditure on infrastructuredevelopment especially forSubject1990-91highways to facilitate therecessionburgeoning use of automobiles andthe suburbanization of the growingAmerican middle class. There thenensued a half century of arguablythe greatest prosperity andeconomic expansion in the nation’shistory. This is traced out inExhibit 1, which shows the path ofthe U.S. real GDP from 1947 ibit 1: U.S. Real GDP, 1947-20121.1. Survey of Eleven Post-War Business CyclesExhibit 1 indicates that during the 66 years from 1947 the U.S. gross domestic productgrew eight-fold from 2 trillion to almost 16 trillion per year measured in real terms in constant2012 dollars. During this time theU.S. Non-Farm Employment, 1947-2012population slightly more than(Thousands)Subjectdoubled, from 144 to 314 million,1990-91recessionresulting in an almost quadruplingof the per capita real GDP. Theexhibit also highlights elevenrecessions between 1947 and 2012,as “officially” designated by theNational Bureau of EconomicResearch (NBER), indicated by thevertical gray bands. During theserecessionary periods the GDPdeclined in real terms andemployment fell. Our subjectExhibit 2 U.S. Non-farm Employment, 1947-2012.recession, 1990-91, was the 997199920012003200520072009201104
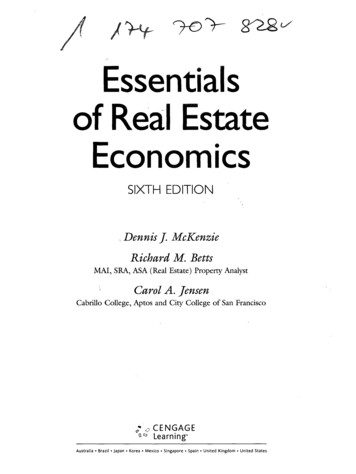
among the eleven, and occurred after the third longest upswing, 92 months from December 1982through June 1990. Of the eleven recessions, that of 1990-91 was the only one for which therewas a popular or general perception that the commercial real estate (CRE) sector may haveplayed an important causal role.Exhibit 2 shows a similar picture, depicting total non-farm employment between 1947and 2012. (Farm employment is very minor.) Non-farm employment grew three-fold, from 44million in 1947 (31 percent of the population) to 133 million in 2012 (42 percent of thepopulation, but stubbornly below the peak of 138 million or 45 percent of the population reachedin 2007). The graph reveals that the 1990-91 recession had a more sluggish recovery inemployment than previous recessions (though less sluggish than the two subsequent recessions).Employment, or its opposite, unemployment, is perhaps the more important measure of thebusiness cycle, rather than GDP, in terms of the impact on most people, and therefore in terms ofpolitical effects through the democratic process.Exhibit 3: Eleven Post-war U.S. Business Cycles, Percentage Magnitude of Decline in Real GDPExhibit 3 shows the elevenpost-warrecessions in terms of theirGFCpercentage magnitudes of decline inRecessionreal GDP from peak to trough of“CRERecession?”each recession. Note that oursubject recession, the one thatputatively may some major causalrole for commercial real estate, isnot among the deeper recessions. Infact, of the eleven, 1990-91 is thethird smallest, with only a 1.4percent drop in real GDP. Theaverage drop among the 11recessions was 2.2 percent. Thechampion of the post-warExh.3recessions as of 2012 was the recentso-called “Great Recession”, the one triggered by the Global Financial Crisis (GFC), which frompeak in 2007 to trough in 2009 saw a drop of 4.7 percent in real GDP. The smallest of the elevenin terms of GDP was the 2001 recession which barely registered any drop at all in GDP (thoughit was more serious in the employment dimension). Other than 2001, the only post-war recessionsmaller than 1990-91 was the one at the end of the long 1960s economic boom, which preceded avery turbulent and difficult economic period during the 1970s and early 1980s. In contrast, theperiod after the 1990-91 recession was very strong, with the longest continuous upswing inmodern U.S. history (10 years from 1991 to 2001) culminating in historically lowunemployment, low inflation, and the first and only Federal Government budget surplus in thepast 40 years.Eleven U.S. Business Cycles Since WW2 Magnitude of GDP Decline (% 821990-9120012007-09The table in Exhibit 4 quantitatively summarizes all eleven post-war recessions in termsof official duration of the recession (in months), GDP decline magnitude, employment declinemagnitude and duration, and duration of the preceding upswing in the economy. The putative“CRE Recession” (if we may somewhat prematurely and over-simplistically label the 1990-91recession by such a moniker) was a generally below-average recession in terms of its severity.5
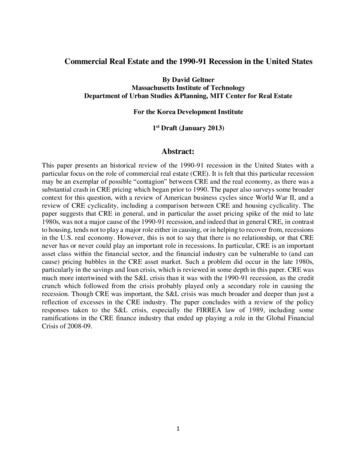
Exhibit 4 Eleven Post-war U.S. Business Cycles, Summary StatisticsEleven U.S. Business Cycles Since WW2 Summary StatisticsRecession Mnths edian10GDPfall EmplFall EmpDeclDur 13.558.42.2%2.8%1245However, it ushered in a new typeof recession characterized bygreater damage to employment,particularly white-collaremployment, and more sluggishemployment recoveries, than hadbeen characteristic of the previouseight recessions.1.2 Recession Regimes anda Typology of RecessionsExhibit 5 highlights theduration of employment declineacross the eleven post-warrecessions, and suggests a typologyof recessions characterizing threeconsecutive “regimes.” The early post-war recessions, including the first four (through the early1960s), were classical industrial inventory cycle recessions. During this period the U.S. economywas still heavily based on manufacturing, and the recessions were caused by the build-up ofexcessive inventory in the industrial supply chains along with slight hiccups in aggregatedemand growth. These recessions tended to be sharp but short-lived, with large lay-offsprimarily of blue-collar workers followed by quick rebounds and strong recovery ofemployment.Exhibit 5 Eleven Post-war U.S. Business Cycles, Duration of EmploymentDecline (months), and Three Regimes of RecessionsThe next four recessions,characterizing the 1970s and earlyFinancial “Bubble”1980s were different. They wereRecessionsfundamentally caused byirresponsible U.S. FederalFiscal & SupplyClassical IndustrialGovernment fiscal policyShock RecessionsInventory Cycleexacerbated by increasing U.S.Recessionsdependence on importedcommodities which made theeconomy vulnerable to internationalcommodity supply shocks. Duringthe 1960s the U.S. Government didnot raise taxes sufficiently to coverthe costs of the unpopular VietnamWar, which led to budget deficitsExh.5that led to a growth in inflation. Atthe same time growing dependence of the U.S. economy on petroleum products which wereincreasingly imported from other countries made the economy susceptible to sharp rises in theinternational price of oil, which occurred in the early 1970s and again at the end of that decade.The end of the dollar gold standard and the Bretton Woods fixed-exchange-rates regime in theEleven U.S. Business Cycles Since WW2 Duration of Employment Decline (months)Three “regimes” of -611969-701973-7519801981-821990-91200162007-09
early 1970s reflected and exacerbated the dollar inflationary pressures. Caused both by fiscalexcess and oil price shocks, the inflation led the central bank, the FRB, to apply tight monetarypolicy to try to control the inflation, and this led to recessions. The 1970s became known as thedecade of “stagflation,” a combination of sluggish economic growth together with inflationarypressures that was new to the U.S. economic scene. By the turn of the decade into the early1980s inflation was running at double digit rates and seemed scarily out of control. The newFederal Reserve Board Chairman appointed by President Carter, Paul Volcker, ultimatelyimplemented a redirection of FRB monetary policy, starting in October 1979, to target moneysupply growth instead of balancing inflation and employment targets. This led to sharp spikes ininterest rates, two severe back-to-back recessions in the early 1980s, but ultimately tamed theinflation monster in the U.S. dollar.The 1990-91 recession was the first of the more recent regime of recessions, those relatedto financial or asset market bubbles. Each of the last three recessions, 1990-91, 2001, and the“Great Recession” of 2007-09, was related to a previous financial or asset market bubble thatburst. For the 1990-91 recession it was the commercial real estate (CRE) market in the 1980s.For the 2001 recession it was the so-called “Dot.Com Bubble” in the stock market of the late1990s. For the 2007-09 recession it was the housing market in the mid-2000s along with therelated and other excesses of the GFC. As we will discuss in more depth later, the 1990-91recession was due in part to the so-called “credit crunch” which grew out of the financial crisisdominated by the collapse of the savings and loan (or “thrift”) industry in the U.S. in the late1980s, which in turn was related to asset price inflation most notably in the CRE sector. As hasbeen famously asserted by Reinhart and Rogoff, recessions caused by financial crises tend to lastlonger than other types of recessions, because of the de-leveraging that must occur and whichtakes time, suppressing aggregate demand and/or constraining liquidity in the meantime.In the U.S. by the 1980s the economy was heavily based on the service sector and onconsumer spending, and that spending was heavily financed by borrowing, excessively so in theyears leading up to the recessions. The result would be recessions that would strike the servicesector and white collar employment for extended periods, as consumer demand growth was heldback by the de-leveraging process during and after the recessions. Even the 2001 recession,which was very mild in terms of GDP decline, exhibited the longest duration of decline inemployment of all the post-war recessions (30 months, even longer than the 25-monthemployment decline of the subsequent GFC-triggered “Great Recession” of 2007-09). In the1990-91 recession employment declined for 11 months, but it took 32 months in total foremployment to recover back to its peak level of before the recession, longer than for anyprevious post-war recession. (Previously the post-war recession that took longest to recover backto previous peak employment was 1981-82 which took 28 months. But the 2001 recession wouldrequire 48 months to get back to its prior employment peak, and the Great Recession still as of2012 has not gotten back even very close to its prior 2007 employment peak after over 60months and counting.)In summary, the “CRE recession” of 1990-91 was not particularly severe, but it wasexemplary of a new type of recession in the U.S., at least, new since the Great Depression, arecession caused or triggered at least in part by a financial crisis, and a recession that would hitthe service sector of the economy more strongly than previous recessions. 1990-91 was also arecession that would have major political consequences, arguably causing the loss of RepublicanGeorge H.W. Bush to Democrat Bill Clinton in the 1992 presidential election. And, as we shall7
discuss later, some of the policy actions adopted to deal with the financial crisis that preceded the1990-91 recession, notably the establishment of the Resolution Trust Corporation (RTC), hadfar-reaching consequences in the CRE finance industry in the following decades, includingpossibly some implications for aspects of the more recent GFC. But let us back up. Is it amisnomer to label 1990-91 the “CRE recession”? How responsible was commercial real estate,really, for the recession? To help us answer that question, let us first examine the nature of CREcyclicality in the United States.2. Commercial Real Estate Cyclicality in the United States.Real estate is widely and popularly considered to be a rather “cyclical” sector of theeconomy. However, most of this conception is focused on the housing sector, and as such, realestate would almost necessarily be cyclical, synchronous with the overall economic businesscycle, because housing is such a large and basic sector of the economy. More to the point, thisconception of cyclicality does not specify a particular direction of causality, whether housingdownturns cause economic downturns or vice versa (and of course this can vary over time, andsuch causality can flow in both directions). But our focus in the present paper is not on housing,but on the commercial real estate (CRE) sector. And we are more concerned with real estate“contagion”, that is, causality flowing from a downturn in the real estate sector to a resultantdownturn in the broader economy.In the United States the CRE sector is most widely viewed as referring to incomeproducing property, a characteristic which enables it to serve readily as an investment asset. Thisdefinition of CRE therefore includes not only “commercial buildings” per se (such as office,industrial, and retail buildings) but also rental housing, as most such housing in the U.S. isdeveloped and owned in the private sector. In practice, an effective delineation of the CRE sectorwould exclude very small rental housing (which in fact includes a fair number of stand-alonesingle-family homes for rent). Typically mortgages on buildings containing fewer than fiveapartment units are treated as “residential” rather than “commercial.” 1Even if we include rental housing as thusly defined within the definition of CRE, it is stilltrue that in the U.S. CRE is a much smaller sector than housing. By asset market value, housingcurrently exceeds 20 trillion, while CRE is probably no more than about 10 trillion.Furthermore, housing is a direct consumption good, a component of “final demand” in theeconomy, whereas CRE is generally a factor of production (including trade and distribution). Inan economy dominated by consumer spending, housing would therefore seem more likely to bein a direct causal relationship to the overall real economy than would CRE. 2 On the other hand,1The definition distinguishing between CRE and housing is essentially trying to get at the degree to which theassets are traded in the investment industry as opposed to serving primarily as long-lived consumption productsproviding housing services but not traded in the investment industry. Of course, the line between these twoconceptions can be rather blurry or multi-dimensional. For example, recently a REIT has been launched to buylarge numbers of single-family homes and rent them out as rental units. Such a REIT is clearly an investment asset.2Housing construction is only one way that the housing sector broadly defined impacts the GDP. Depending onhow it is defined, “housing services consumption” (which includes things like utilities, home furnishings, apartmentrents and homeowners’ imputed rents, etc) may typically amount to more than 10 percent of the GDP (in additionto housing construction, which includes new homebuilding plus remodeling), according to the National Associationof Home Builders.8
CRE is not just a factor of production. It is also an investment asset class, part of the capital assetmarket not unlike stocks and bonds. 3 It is thus possible for CRE to directly impact the financialsector, and through this route CRE may have a stronger and more causal relationship to theoverall real economy than through its direct role as physical capital in the production process.Reductions in the value of CRE assets can undercut financial institutions’ balance sheets, whichin turn reduces their ability to lend money for any purpose, not just CRE. When the financialsector becomes distressed and constrained in its fundamental and vital economic role ofproviding liquidity and leverage, the real economy can suffer as a consequence. Indeed, this ishow it is perceived that some non-trivial portion of the cause of the 1990-91 recession may belaid at the doorstep of the CRE sector in the U.S.With the above general considerations in mind, let us take a look at the evidenceregarding cyclicality, particularly in the CRE sector, but let us begin by also considering thehousing sector.2.1. Construction CyclesOne important potential link between real estate and the overall economy is theconstruction industry, that is, the development of new buildings, be they single-family houses orcommercial buildings. Construction can be a large and labor-intensive industry in any economy,so it can play a major role as a driver of economic growth (or lack thereof). In this role, we comeExhibit 6 Fixed Investment as Percent of GDP, 1947-2012: Non-Residential Structures& ResidentialFixed Investment as Percent of GDP: Non-Residential Structures & Residentialshaded bars GDP recessions 8%7%6%5%4%3%2%back to the point that housing is aconsumption good, part ofaggregate final demand, whereascommercial construction adds to theproduction capacity on the supplyside of the economy (although retailbuildings are very directly linked toconsumer spending, and rentalapartments are clearly housingconsumption).With this in mind, considerExhibit 6, which depicts the shareof building construction in the U.S.GDP separately for residential andnon-residential structures. (Notethat in Exhibit 6, a portion of what we’re generally defining as the CRE sector, namely multifamily rental housing structures, are lumped in with the “residential” category.) The history inExhibit 6 covers the same 1947-2012 period examined previously in Section 1, with its elevenpost-war recessions again delineated by the gray bars. First note that usually is of course is also the case for housing, to the extent that residential mortgages trade directly or indirectly in asecondary market (as has long been the case in the U.S.), or even just to the extent that home mortgages are animportant part of the asset holdings of banks and financial institutions (as is common in many countries). However,in the case of CRE, both the equity and the debt components of the property investment are financial assets andform part of the capital asset market, not just the debt component as in the case of housing.9
construction is a larger share of the economy than non-residential building construction. Over the66-year period housing construction averaged 4.6 percent of GDP while commercial averaged3.6 percent.4In Exhibit 6 it is important to note that housing construction is more cyclical thancommercial building construction. In the early decades the cycles were relatively short, and thehousing share of the economy was relatively large with the post-war demographic-based housingboom. On the other hand, the long upswing in housing construction throughout the 1990s to anear-record peak of over 6 percent of GDP in 2005-06 was rather different, based less ondemographics than was the earlier post-war decades with their shorter housing constructioncycles. The long housing construction boom was propelled in its last years (mid-2000s) by awave of mortgage capital and bubbly pricing, and it finally came to a sudden end in the crashwhich was such a prominent part of the Great Recession of 2007-09. This housing constructioncrash was notable in several respects. The magnitude of the fall, four percent of GDP, wasunprecedented and crippling to the economy. The depth of the drop, to an annual rate of barelyover 2 percent of GDP, was unprecedented in the post-war period, and no doubt reflectedsubstantial excess physical housing supply as well as financial and demand side difficulties. Thepersistence of the housing construction trough was also unprecedented. The Great Recession wasthe first post-war recession in which the economy could not rely on housing construction to playan important helpful role in the recovery out of the recession. 5In Exhibit 6 non-residential building construction appears generally less cyclical and lessrelated to the general business cycle than housing. In particular, we noted that housingconstruction was usually a pretty reliable component of the recovery out of recessions, but thiswas not so for non-residential building construction. CRE construction has tended to lag wellbehind the business cycle recoveries or to follow a more independent path on its own. Mostnotable in the historical pattern of commercial building construction is the prominent peak as apercent of GDP in the late 1970s and early 1980s in spite of the severe double-dip recession atthat time. We will have more to say about this in the next section, but it is notable in Exhibit 6that there has been a general secular decline in CRE construction as a percent of GDP since thatpeak. The biggest subsequent upturn peaked in 2008, clearly after the beginning of the GreatRecession and a full two years after the housing construction boom collapsed prior to the onsetof the recession. In general Exhibit 6 suggests that CRE construction has usually been more avictim of recessions than a cause of them at least in terms of the direct role of the constructionsector in the economy.2.2. Real Estate Asset Market Pricing CyclesA different but potentially equally important perspective on the relationship between realestate and the real economy relates to the asset pricing cycle. Asset market pricing, referring tothe prices at which properties are trading, are not unrelated to construction, as high prices willtend to stimulate development on the one hand while an excessive construction binge on theother hand can lead to physical over-supply which can depress rents and asset prices. But4Some of the non-residential construction included in the exhibit is not actually CRE but reflects institutional andgovernmental structures.5A slight exception was the first phase of the double-dip recession of the early 1980s, when housing constructiondid not rebound after the brief 1980 recession, though it did rebound strongly after the “second dip” in 1982 (andon the other hand commercial construction did grow
the U.S. real GDP from 1947 to 2012. Exhibit 1: U.S. Real GDP, 1947-2012 1.1. Survey of Eleven Post-War Business Cycles Exhibit 1 indicates that during the 66 years from 1947 the U.S. gross domestic product grew eight-fold from 2 trillion to almost 16 trillion per year measured in real terms in constant 2012 dollars. During this time the