Transcription
Rapid Nutrition Assessment Surveyon Food Security, Coping Mechanisms,and Nutrition Services Availed during COVID-19 Pandemicin Selected Areas in the Philippines
ACKNOWLEDGEMENT: Households and respondents coveredBarangay Officials and Community Health WorkersLocal Government Units, Provincial/City Nutrition Action OfficersFNRI-DOST Contract of Service Staff DOST Secretary Fortunato T. dela PeñaDOST Undersecretary for R&D - Dr. Rowena Cristina L. GuevaraDOST Undersecretary for Regional Affairs – Dr. Brenda ManzanoCabinet Secretary Karlo Alexei B. NogralesNational Nutrition CouncilDepartment of HealthRegional and Provincial DOST Officials
THE ENGINES OF DOST – FNRIDr. MARIO V. CAPANZANADr. RODOLFO F. FLORENTINODr. CORAZON VC. BARBA
BACKGROUNDThe rapid nutrition assessment survey (RNAS) provides a snapshot of the food security situation and nutritionperceptions of respondents of selected areas with high, medium andlow risk of COVID-19 conducted from November 3 to December 3, 2020 Results may aid policymakers and program implementers in enhancingand intensifying policies and program implementation and delivery in amore focused and targeted approaches.
How were the areas selected?SURVEY DESIGN: MULTI – STAGE List of areas covered in the 2019 DOST-FNRI Expanded National NutritionSurvey (ENNS) were categorized into Luzon, Visayas, Mindanao. Clustering of Provinces or Highly Urbanized Cities (HUCs) in each majorisland into low-, medium- and high-risk COVID–19 infection. One province and/or HUC was selected from each risk category acrossLuzon, Visayas, and Mindanao. Only households with mobile numbers were included.
What were the areas covered?How many HHs were covered?There were 5,943 eligiblehouseholds, but only 5,717(96.2%) households werecovered due to non-response.Who are the respondents?Household heads,mothers/caregivers, andpregnant with recorded mobilenumbers in 2019 ENNS.*Based on IATF announcement on July 15, 2020 and number ofCOVID-19 positive cases from the DOH NCOV tracker as of July 16,2020
How many individuals were covered?7,240 individuals covered through phone interview, of whom:792 (10.9%) were children under two (0-23 months old)1,995 (27.6%) were preschool-age children (2-5.9 years old)4,305 (59.5%) were school-age children (6-12 years old)148 (2.0%) were pregnant women
RESULTS
Employment30Loss of JobWith New Job 16.7%of the householdheads have lost job and washighest (18.1%) in high riskareas 16.5%had job opportunitiesand was highest in the mediumrisk areas (18.6%). Most jobopportunities were service andagricultural – related.Percentage (%)2518.62016.7 16.516.516.018.115.714.2151050ALLLow RiskMedium RiskHigh Risk
Food insecurity 62.1% of the surveyed100households experienced moderateor severe food insecurity.During pandemic (2020)80Percentage (%) The impact of food insecurity washigher in low and moderate than inthe high risk areas.Before pandemic (2019)62.16040.24065.559.342.659.543.235.320 High risk areas are located inhighly urbanized cities where foodavailability and accessibility mightbe easier either through LGU –government - or private – induceddonations.0All RNAS Areasa BasedMarchLow RiskModerate RiskHigh Riskon FIES with recall period of since the community quarantine started in
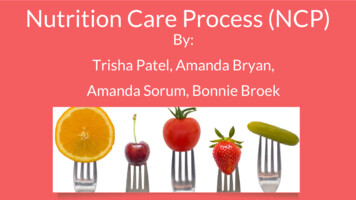
Food insecurity experiences by monthECQMECQ70.060.0MECQ/GCQ /MGCQGCQ eGCQ ry about foodEat just a few kinds of foodate less than you thought you shouldUnable to eat healthy and nutritious foodRan out of foodskip a mealhungry but did not eatwithout eating for a whole dayNovember
56.3%of the households reported having problemaccessing food during communityquarantine period due to:No money tobuy foodNo/limited publictransportationNo money due toLoss of job22.1%21.6%19.5%Limited food storesin the area10.8%Elderly (no othermembers to buy food5.1%
Top food-coping strategies adapted by families71.8%have purchasedfood on credit30.2%bartered food66.3%have borrowed food fromfamily/neighbors/friends21.1%have reduced amount of intake ofadults for children to have more
Food security of households with children and pregnantImpact of food insecurity was highest in households with children (74.7%) andpregnant members (80.8%) than in households without such members.Percentage (%)80100With 0-12 years old childrenWithout 0-12years oldchildren74.768.1604025.3With PregnantWithout Pregnant8031.9Percentage (%)10072.16040202080.827.919.200Food Secure*significant at p 0.05Food InsecureFood SecureFood Insecure
Most Challenging problems* experienced by familiesLost job/business was closed28.4Restricted movement/ No transportation17.0Covid-19 positive/exposed16.7Financial and bills problem13.6Health condition/problem9.9Limited source of food5.7Schooling of child/childrenAnxiety over covid-19/risk of exposure, Losing a family member, calamity04.22.251015Percentage (%)* MultipleResponse202530
Food Assistance:96.6%of the surveyedhouseholds received foodassistance from LGU orprivate sector,of which48.9%received 2-3times of the food assistanceand 42.6% had 3X7.1%5.8% 8.5%Once2-3 times4-5 times29.7%6-7 times48.9% 8 times
Food Assistance Frequency by Risk Level:Increased frequency of “ayuda” was noted in high risk areas, of which 40.1% of thesurveyed households received 4-5 times, 11.6% received 6-7 times.Low RiskHigh RiskModerate .9%25.4%57.6%51.2%Once only2-3 times4-5 times40.1%6-7 times 8 times
Most common food items included in the food packsRice and cereals93.2%Canned and other dry goods(delatang sardinas, corned beef,meat loaf, condiments)Milk and other dairy products(gatas, yogurt, cheese)Instant Coffee31.3%82.6%14.0%
Cash Assistance:4.2%62.9% of the householdsreceived cash assistanceduring the pandemic, ofwhich more than half(58.7%) received onceonly.Once only37.1%58.7%Twice 2 times
Cash Assistance Frequency by risk level:Moderate RiskLow Risk3.5%High Risk3.2%5.4%18.2%40.4%41.2%53.4%56.4%78.2%78.2%of the householdsfrom Low Risk areas received cashassistance only once.Once only41.2%of households frommedium risk areas received cashassistance 2 times.2 times 2 times56.4%of households fromHigh Risk areas received cashassistance 2 times.
Assistance for Food Production:12.5%87.5% of Householdsdid not receive assistancefor food production fromthe government.87.5
Assistance for Food ProductionLow RiskModerate Risk77.6%77.6% of households did not receiveassistance for food production from thegovernment.High Risk89.8%89.8%of households did ceiveproduction.of households did notassistanceforfood
NUTRITION SPECIFIC PROGRAMS: Children 0-122019 Prior to COVID-192020 During 1.611.920.00.0OPT PlusSupplementary FeedingVitamin ASupplementationDeworming
REASONS FOR NON-PARTICIPATION TOOPT Plus48.9%51.0%Did not visit thehealth center dueto lockdownChildren were not weighednor measured for height.33.5%BNS or BarangayHeath Workers didnot visit us12.4%Do not know
Reasons for non-participation to OPT by area100.080.060.040.020.054.350.737.1Did not visit the healthcenter due to lockdown47.4BNS or barangay heathworkers did not visit us32.131.414.517.45.80.0High Risk AreaModerate RiskAreaLow Risk AreaDo not know
Children who received supplementaryfeeding by risk level10091.489.185.3PERCENTAGE (%)8060402008.414.60.2High Risk Area10.60.2Medium Risk AreaNOYESDo not know0.3Low Risk AreaMajority of thechildren in thedifferent areasdid not receivesupplementaryfeeding.
Children (6 mos to 12 years old) who received SupplementaryFeeding.*Type of supplementary foodreceived**11.988.1NOYESFrom those who received supplementaryfeeding (11.9%), the mean duration of feedingwas less than a month ( approx.12 days)%Family food pack (fruit/veg,bread, canned goods, etc)Cooked food54.3Dry ration (rice, milk, ricemongo blend, etc.)20.742.4** Multiple Response*Supplementary feeding received with at least 1 meal a day in the past months since COVID-19 pandemic started
Type of supplementary food received by childrenduring COVID-19HIGH RISK AREAMEDIUM RISK AREALOW RISK AREACookedFood (47.8%)Family FoodPack only* (60.5%)Family FoodPack only*(53.2%)Family FoodPack only* (36.0%)CookedFood (44.0%)CookedFood (36.3%)DryRation** (30.1%)DryRation** (14.9%)DryRation** (26.2%)*Family food pack rice, canned goods, fruit/veg, bread**Dry Ration rice, milk, rice-mongo, etc.
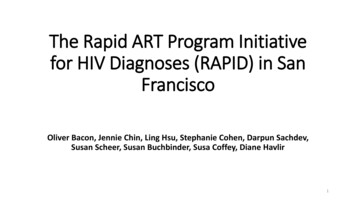
PROVISION OF MICRONUTRIENT POWDER(6-60 months old children)10.6%RECEIVED MICRONUTRIENTPOWDERType of MNP received80.0Nutri-Foods MNPVita Meena t PowderVita MixMicronutrientGrowth Mix (MGM)Others (ex. VITASANGKAP)
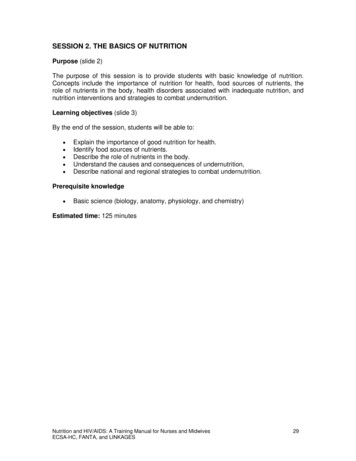
Mother’s Perception towards their 0-12 years old children NSWhy?31.9%“My child isthin/underweight/short”10.7%“MY CHILD IS NOT HEALTHY”29.4%Others(ex. Picky eater)
Stunting occurrence as perceived by mothersThe child is stunted,Why Do you say nko lang""Kulang sanutrisyon"
Mother’s knowledge on the causes of child stunting66.7%Inadequate foodintake/nutrition39.4%Hereditary29.7%Others (ex. Lack of vitamins,lack of sleep)
Mothers who perceived their children to be stuntedby food insecurity level (%)1 out of 5 (19.7%)of the surveyedmothers perceivedtheir children to .0FoodInsecure(ALL)Mild reMore mothers fromthe severely foodinsecure householdperceived theirchildren to bestunted (24.8%)
Children under 6 years old with reported loss of weightduring COVID-19 AllHigh Risk Area Medium Risk Low Risk AreaArea2 in every 10 childrenreported to have lostweight. Mostly are fromthe Medium Risk Area(24.2%).
Children under 6 years old with reported loss ofweight by food insecurity level27.630Percentage (%)2523.423.0Higher proportion ofweight loss amongchildren belonging toseverely food insecurehousehold wereobserved.2015.2151050Food InsecureMild Food InsecureModerate FoodInsecureSeverely FoodInsecure
Access to maternal health services15.5%have Noprenatalcheck up-39.1% expressed fear going to healthfacility-34.8% were not aware of currentpregnancy-13.0% had no money to go to nearesthealth facility-13.0% were busy, had no time, or werenot interested
The Barangay Health Center was reported to be the mostaccessible health facility for maternal health servicesGovernment HospitalBarangay Health CenterPrivate Clinic69.6%23.2%3.2%
Micronutrient supplementation availed by pregnantwomen14.2%Not takingVitamins85.8%TakingVitamins
Types of vitamins and mineral supplements takenduring pregnancy41.7Ferrous Sulfate29.9Single Vitamin/Mineral26.8Multivitamins24.4Calcium Carbonate22.0Iron-Folic AcidFolic AcidSources ofSupplements:15.0Drugstore33.3%Barangay HealthCenter56.6%
Reasons for not taking vitamin/mineral supplements duringpregnancy in the time of COVID-19 pandemicWaiting forprescription ofvitaminsNo money tobuy Vitamins28.6%Waiting forprenatal check-up14.3%28.6%Health Centerswerelockdown9.5%Not interested intaking Vitamins9.5%
Dietary supplementation7.4%Received dietarysupplementation92.6%Did not receivedietarysupplementationTypes of Dietary SupplementationReceived:Family Food Pack 54.6%Fresh Fruits andVegetables 36.4%
Access to pregnancy-related information/messages42.6%Received messages aboutpregnancySources of Messages:57.4%Did not Midwife 57.1%Television 17.5%Social media 14.3%Poster, leaflet, flyer, newspaper,or any printed media 11.1%
Breastfeeding PracticesCOVID-19 did not affect drastically the breastfeeding practice.60.8 %of children 0-5.9 months were exclusively breastfedduring COVID-19 pandemic59.7 %of children 0-23 months were currentlybreastfed during COVID-19 pandemicPERCENTAGE (%)Current breastfeeding100806040200PERCENTAGE (%)Exclusively breastfeeding10080604020052.660.8 *20192020*not significally different56.059.7 *20192020*not significally different
Breastfeeding practicesReturned to work19.0%15.5%61.8 %Decided not to breastfeed9.1%of children 0-23 months hadstopped breastfeedingduring COVID-19 pandemic2.7 %Child did not wantto be breastfedWas not able to go home
Complementary feeding practices20.230.093.3Meeting MinimumDietary DiversityMeeting MinimumMeal FrequencyMeeting MinimumAcceptable DietCOVID-19 did not affect complementary feeding practices. Dietary Diversity Score is a proxy indicator of micronutrient adequacy. Minimum meal frequency is proxy indicator of energy adequacy. Minimum acceptable diet is a proxy of both energy and micronutrient adequacy.
Top complementary foods consumed by children0-23 months19.5 %Mashed vegetables45.6 %Commercial baby food7.6 %Rice14.4 %Porridge/lugao3.2 %Fruits
Access to breastfeeding and complementaryfeeding rted receivingmessages onbreastfeeding andcomplementary feeding13.9%Printed ad22.8%Social mediatelevisionradio7.6%
RNAS TAKE AWAY MESSAGES: Majority of the respondents received “AYUDA” or assistance either incash (62.9%) or foods (96.6%) Breastfeeding, either exclusive or any form of breastfeeding, was stillhigh (60.8% and 59.7%, respectively) High percentage (93.3%) of young children meeting meal frequency Barangay Health Center – most accessible health service facilityduring pregnancy, and source of nutrition messages was mostly fromhealthcare facility
RNAS TAKE AWAY MESSAGES: Loss of job – most concern Increased food insecurity Food insecurity experiences was highest during themonths of April and May Low percentage of respondents have sought health services for childrenLow percentage pregnant women also sought maternal servicesMost frequent recipients of “ayuda” are in the High – risk areas (HUC)Low assistance on food production
RNAS TAKE AWAY MESSAGES: Unemployment, food security, food accessibility, accessto health and nutrition programs for children includingpregnant women are the major issues during thepandemic in these selected areas. If left unsolved These may increase percentages of:-nutrient deficiencies-undernutritionResulting to weakening of the immune system leading to frequent attacksillness e.g. increasing susceptibility to COVID–19 and other viral infectionswhich may lead to tremendous high medical cost, lost opportunities, andeconomic drain.
CALL TO ACTION Donations, government services and benefits must be decentralized from the HighlyUrbanized Cities (HUCs) and extended equitably to provinces with less resources andminimal or no benefactors. Enhance the capabilities and the increase resources of BHS to increase access tohealth services Hire Nutritionists to impart effective messages Improve assistance on food production either as home or community–basedgardening and more efforts on urban gardening is needed. DOST – FNRI to develop more easy to distribute safe and nutritious food products
THE ENGINES OF DOST – FNRIDr. MARIO V. CAPANZANADr. RODOLFO F. FLORENTINODr. CORAZON VC. BARBA
hungry but did not eat without eating for a whole day ECQ MECQ GCQ / MGCQ MECQ/ GCQ / MGCQ GCQ / MGCQ e Food insecurity experiences by month. . Nutri-Foods MNP Vita Meena MNP Vita Mix Micronutrient Growth Mix (MGM) Others (ex. VITA SANGKAP) Type of MNP received. Mother’s