Transcription
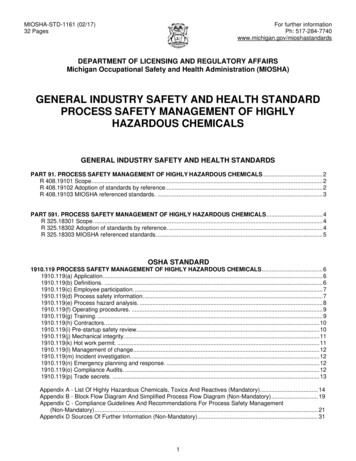
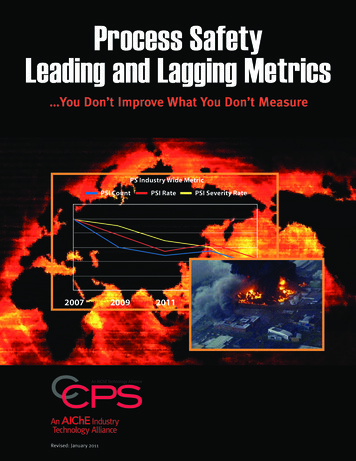
Process SafetyLeading and Lagging Metrics You Don’t Improve What You Don’t MeasurePS Industry Wide Metric2007PSI CountPSI Rate20092011CCPSAn AIChE Technology AllianceCenter for Chemical Process SafetyRevised: January 2011PSI Severity Rate20132015
CCPPSCPSAn AIChE Technology AllianceCenter for Chemical Process SafetyAn AIChE IndustryTechnology AllianceProcess Safety Leading and Lagging MetricsYou Don’t Improve What You Don’t MeasurePrefaceThe Center for Chemical Process Safety (CCPS ) was established in 1985 by the American Institute of ChemicalEngineers (AIChE) for the express purpose of assisting industry in avoiding or mitigating catastrophic chemicalaccidents. More than 130 corporate members around the world drive the activities of CCPS.In 2006, the CCPS Technical Steering Committee authorized the creation of a project committee to develop aGuideline book for the development and use of Leading and Lagging Process Safety Metrics. That committeeidentified that a key breakthrough opportunity for industry was the development of an industry lagging metricthat would become the benchmark across the chemical and petroleum industry for measuring process safetyperformance. To achieve this objective, representatives and members from each of the major chemical andpetroleum trade associations as well as other key global stakeholders were engaged.The outcome of that effort was published in December 2007. Many companies and organizations have used thosemetric definitions since 2008. Those definitions established in 2007 were a key input to the creation of a newANSI/API standard (ANSI/API RP 754), which has been finalized and released in April 2010. CCPS and severalmembers of the original CCPS Metric committee were involved in the API standard committee.CCPS has elected to update the original (December 2007) document describing the CCPS metricrecommendations with minor revisions with the intent to align the CCPS and API documents. The intent isthat if a company or organization utilizes either the CCPS or API definitions for the top tier process safetyincident definitions that they will count the same incidents. However, there are a few principles described inthe CCPS metric document which are not incorporated in the API document (e.g., the description and use of aseverity-weighted metric). Since the API document references the CCPS definition it is important to retain bothdocuments, yet maintain good alignment between the two.There are also a few additions incorporated into the ANSI/API RP 754 document which may not be deemednecessary by all companies or trade associations internationally that have already began utilizing the 2007 CCPSdocument (e.g., the definitions of a “Tier 2” process safety event). This updated CCPS metric document willnote those differences, yet describe those as “optional” metrics or definitions.The ultimate goal of the 2006 CCPS project was to develop and then promote the use of common metrics acrossthe industry and around the world. CCPS continues to support that objective, whether via adoption of the ANSI/API RP 754 definitions or via use of this document.1 American Petroleum Institute, ANSI/API Recommended Practice 754, Process Safety Performance Indicators for the Refining andPetrochemical Industries, First Edition, Washington D.C., 2010.2
For more information on CCPS or these metricsplease visit www.ccpsonline.orgCCPS Process Safety Metrics“You don’t improve what you don’t measure”Introduction 4I. Lagging Metrics. 61.0Process Safety Incident (PSI) (Tier 1 - PSE as per API-754): . 6Process Involvement . 6Reporting Thresholds. 7Location . 9Acute Release . 9Flowchart . 92.03.04.05.06.0Tier 2 Process Safety Events (Tier 2 - PSE as per API 754) . 12Tier 2 Indicator Purpose . 12Process Involvement . 12Tier 2 Indicator Definition and Consequences . 12Definitions. 14Rate Adjusted Metrics . 17Industry Process Safety Metrics . 17Applicability . 187.0Interpretations and Examples . 19II. Leading Metrics . 281.0 Mechanical Integrity . 292.0 Action Items Follow-up . 303.0 Management of Change . 304.0 Process Safety Training and Competency . 335.0 Safety Culture . 336.0 Operating & Maintenance Procedures. 347.0Fatigue Risk Management . 35III. Near Miss Reporting and other Lagging Metrics . 35Definition of a Process Safety Near Miss . 36Examples of Process Safety Near Miss . 36Maximizing Value of Near Miss Reporting . 38Appendix A: UN Dangerous Goods Classification and Listing Chemicals . 38Appendix B: Additional Clarifications regarding UN Dangerous Goods lists & Exceptions .413
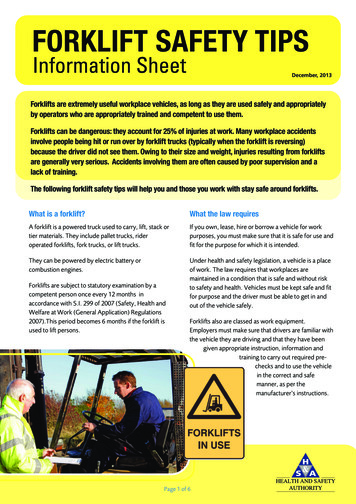
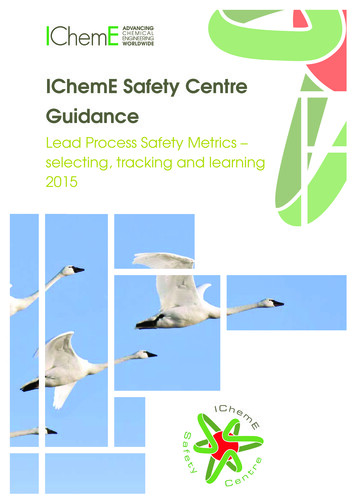
CCPPSCPSAn AIChE Technology AllianceProcess Safety Leading and Lagging MetricsCenter for Chemical Process SafetyYou Don’t Improve What You Don’t MeasureAn AIChE IndustryTechnology AllianceIntroductionAn essential element of any improvement program is the measure of existing and future performance. Therefore, tocontinuously improve upon process safety performance, it is essential that companies in the chemical and petroleumindustries implement effective leading and lagging process safety metrics. This document describes the recommendations assembled by the Center for Chemical Process Safety (CCPS) Process Safety Metric committee for a commonset of company and industry leading and lagging metrics.Within this document is a description of three types of metrics:“Lagging” Metrics – a retrospective set of metrics that are based on incidents that meet the threshold ofseverity that should be reported as part of the industry-wide process safety metric.“Leading” Metrics – a forward looking set of metrics which indicate the performance of the key workprocesses, operating discipline, or layers of protection that prevent incidents“Near Miss” and other internal Lagging Metrics – the description of less severe incidents (i.e., belowthe threshold for inclusion in the industry lagging metric), or unsafe conditions which activated one or morelayers of protection. Although these events are actual events (i.e., a “lagging” metric), they are generallyconsidered to be a good indicator of conditions which could ultimately lead to a more severe incident.These three types of metrics can be considered as measurements at different levels of the “safety pyramid” illustratedin Figure 1. Although Figure 1 is divided into four separate layers (Process safety incidents, Other incidents, Nearmiss, and Unsafe behaviors/Insufficient operating discipline), it is easier to describe metrics in terms of the categoriesshown above. Figure 1 illustrates how each of these four areas is captured under the three sections of this document.It is strongly recommended that all companies incorporate each of these three types of metrics into their internalprocess safety management system. Recommended metrics for each of these categories are included in the threeprimary sections of this document.Figure 1: Process SafetyMetric PyramidCCPS commonLagging indicators,Process Safety Incident: (Tier 1 PSEs as per API 754)incidents which meet the threshold of severity which should bereported as the industry-wide process safety metric.Described in this documentunder the "Near Miss"reporting section.Process Safety Event—Tier 2: (Tier 2 PSEs as per API 754)incidents which didn't meet the definition of PS incidentfor purposes of the industry PS incident metric.(e.g., Loss of Primary Containment Incidents or fires causing Reportable incidentsthat restrict work, require medical treatment or were 10% of the TQ of a PSI)Near Miss: Minor LOPCs or System failureswhich could have led to an incident.(e.g., instrument had failed, pipe wall thickness low)Unsafe Behaviors or insufficientoperating discipline:measurements to ensure that safety protection layersand operating discipline are being maintained.4}}These two types of eventsshould be collected asindependent or integrated"Near Miss" company metrics.Collect for the learningbenefit, improveawareness, and enhancePS Culture.Described in CCPSLeading Metric section.
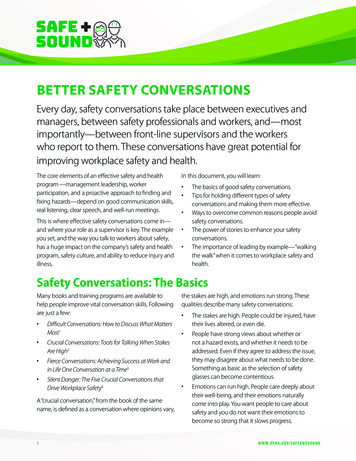
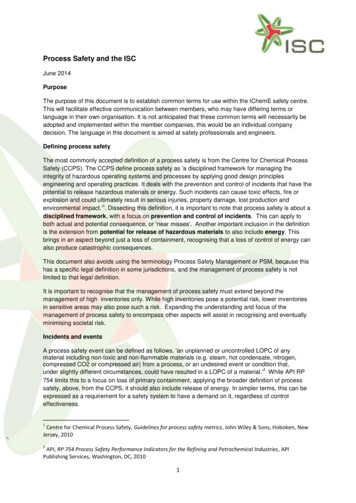
For more information on CCPS or these metricsplease visit www.ccpsonline.orgAnother way to consider metrics is that the incidents at the top of the pyramid reflect situations where failures to themultiple layers of protection which are intended to prevent an incident (both physical layers and work process/operatingprocedure layers) have failed, while the bottom of the pyramid reflects failures or challenges to one or two of these layersof protection – yet other layers continue to function. The multiple layer of protection concept is represented in Figure 2.Figure 2: Swiss Cheese Model Hazards are contained by multipleprotective barriers Barriers may have weaknesses orholes’ When holes align, the hazard passesthrough the barriers resulting in thepotential for adverse consequences. Barriers may be physical engineeredcontainment or behavioral controlsdependent on people Holes can be latent/incipient, oractively opened by peopleIncorporating the layer of protection concept, Figure 1 can then be redrawn as shown in Figure 3, to reflect thatadditional layers of protection or mitigation have failed as you progress from the bottom of the pyramid to the top.Figure 3: Process Safety Pyramid / Failed Protection LayersLEGEND:Barriers or Layer of ProtectionMitigation & EmergencyPreparedness MeasuresFailure of a barrier ormitigation SEQUENCEHAZARDCONSEQUENCEProcessSafteyIncidentTier 2 ProcessSafety Events:LOPCs with lesser significanceNear Miss:Minor LOPCs, System failures whichcould have led to an incidentUnsafe behaviors or insufficientoperating discipline5
CCPPSCPSAn AIChE Technology AllianceCenter for Chemical Process SafetyAn AIChE IndustryTechnology AllianceProcess Safety Leading and Lagging MetricsYou Don’t Improve What You Don’t MeasureI. Lagging MetricsThe BP US Refineries Independent Safety Review Panel (“Baker Panel”)2 and US Chemical Safety Board3 eachrecommended improved industry-wide process safety metrics in their final reports dealing with the 2005 explosion atthe BP Texas City refinery. CCPS member companies also share the vision of a new industry-wide process safety metric,including a common set of definitions and threshold levels that will serve individual companies and industry as a whole byproviding a mechanism to: indicate changes in company or industry performance, to be used to drive continuous improvementin performance; perform company-to-company or industry segment-to-segment benchmarking and serve as a leading indicator of potential process safety issues which could result in a catastrophic event.This section of the document describes a set of definitions and metrics recommended as industry-wide lagging metrics.1.0Process Safety Incident (PSI) (Tier 1 PSE per API RP - 754):For the purposes of the common industry-wide process safety lagging metrics, an incident is reported as a process safetyincident if it meets all four of the following criteria:(1) Process involvement(2) Above minimum reporting threshold(3) Location;(4) Acute releaseProcess InvolvementAn incident satisfies the chemical or chemical process involvement criteria if the following is true:A process must have been directly involved in the damage caused. For this purpose, the term"process" is used broadly to include the equipment and technology needed for chemical, petrochemical and refining production, includ
API RP 754 definitions or via use of this document. 1 American Petroleum Institute, ANSI/API Recommended Practice 754, Process Safety Performance Indicators for the Refining and Petrochemical Industries, First Edition, Washington D.C., 2010. 3 For more information on CCPS or these metrics please visit www.ccpsonline.org CCPS Process Safety Metrics “You don’t improve what you don’t .File Size: 1MBPage Count: 44