Transcription
TMS SOFTWARETMS IntraWeb HTML5 Controls PackDEVELOPERS GUIDETMS IntraWeb HTML5 Controls PackDEVELOPERS GUIDEApril 2017Copyright 2011-2017 by tmssoftware.com bvbaWeb: http://www.tmssoftware.comEmail: info@tmssoftware.com1
TMS SOFTWARETMS IntraWeb HTML5 Controls PackDEVELOPERS GUIDETable of contentsIntroduction. 4Availability . 4List of included components . 6Online references . 6TTIWHTML5Chart . 7TTIWHTML5Chart description . 7TTIWHTML5Chart features . 7TTIWHTML5Chart architecture . 8TTIWHTML5Chart use. 8HTML5 Doctype . 9Chart Types . 10General chart settings . 16Chart series . 16Chart series properties . 19Chart annotations. 21Hints for series values . 23Chart item layer . 23Chart legend . 25Chart script events . 26Chart X-Axis . 28Chart Y-Axis . 29Chart bands . 30Chart methods . 30Chart events . 31THTML5Chart Advanced techniques . 36THTML5Chart demos . 38TTIWHTML5PieChart . 42TTIWHTML5PieChart description . 42TTIWHTML5PieChart features . 422
TMS SOFTWARETMS IntraWeb HTML5 Controls PackDEVELOPERS GUIDETTIWHTML5PieChart architecture . 43TTIWHTML5PieChart use. 43HTML5 Doctype . 44General PieChart settings . 45TTIWHTML5PieChart demos . 52TTIWHTML5Gauge description . 55TTIWHTML5Gauge features . 55TTIWHTML5Gauge architecture . 56TTIWHTML5Gauge use . 57HTML5 Doctype . 57General gauge settings . 59Gauge Arc . 61Gauge Needle . 61Gauge Sections . 62Gauge SetPoints . 63Chart methods . 65Gauge script events . 65Gauge events . 66TTIWHTML5Gauge demo . 67TTIWHTML5LocalStorage . 69TTIWHTML5LocalStorage description . 69TTIWHTML5LocalStorage features . 69TTIWHTML5LocalStorage use . 69HTML5 Doctype . 69General LocalStorage settings . 71TTIWHTML5LocalStorage demos . 733
TMS SOFTWARETMS IntraWeb HTML5 Controls PackDEVELOPERS GUIDEIntroductionThe TMS HTML5 Controls Pack currently includes the TTIWHTML5Chart, TTIWHTML5PieChart,TTIWHTML5Gauge and TIWHTML5LocalStorage components.The TTIWHTML5Chart is a chart component for web application development with the IntraWebframework. The TTIWHTML5Chart uses HTML5/CSS3 to render data as various chart types: bar, line,area, stacked bar, stacked area and combinations of these chart types. By using the HTML5 Canvasand JavaScript code to render charts in any modern browser, no images are used and thereforebandwidth usage is minimal. The chart also heavily implements asynchronous updates and events.Chart series data, chart series properties and general chart properties can all be asynchronouslyupdated. The TTIWHTML5PieChart has similar possibilities but represents pie charts that can haveconfigurable start and end angles. This enables to show 360 pie charts, 180 pie charts or othervariations.The TMS TTIWHTML5Gauge is a gauge component for web application development with theIntraWeb framework. The TTIWHTML5Gauge uses HTML5/CSS3 to render a value in a circular orlinear gauge. By using the HTML5 Canvas and JavaScript code to render a gauge in any modernbrowser, no images are used and therefore bandwidth usage is minimal. The gauge also heavilyimplements asynchronous updates and events. All properties can be updated asynchronously.In this document you will find an overview of the components and their features, code snippets toquickly start using the component and an overview of properties, methods and events.AvailabilityTMS HTML5 Controls Pack is available as VCL component for Delphi and C Builder.TMS HTML5 Controls Pack is available for- Delphi 2009,2010,XE,XE2,XE3,XE4,XE5,XE6,XE7,XE8,10 Seattle,10.1 Berlin,10.2 Tokyo- C Builder 2009,2010,XE,XE2,XE3,XE4,XE5,XE6,XE7,XE8,10 Seattle,10.1 Berlin,10.2 TokyoThe IntraWeb framework 12.0, 12.1, 12.2 or 14.0.x is requiredTMS HTML5 Controls Pack has been designed for and tested with: Windows Vista, and Windows 7, 8,10.4
TMS SOFTWARETMS IntraWeb HTML5 Controls PackDEVELOPERS GUIDECurrent version of the TMS HTML5 Controls Pack has been designed for and tested with MicrosoftInternet Explorer 9, Google Chrome 19, Firefox 5, Apple Safari for Mac OS-X, Apple Safari for iOS,Opera 11, WebKit.5
TMS SOFTWARETMS IntraWeb HTML5 Controls PackDEVELOPERS GUIDEList of included componentsTTIWHTML5Chart: core chart componentTTIWHTML5PieChart: core pie chart componentTTIWHTML5Gauge: core gauge componentTTIWHTML5LocalStorage: core local storage componentOnline referencesTMS software website:http://www.tmssoftware.comTMS HTML5 Controls Pack ls.aspTMS IntraWeb products t iw6
TMS SOFTWARETMS IntraWeb HTML5 Controls PackDEVELOPERS GUIDETTIWHTML5ChartTTIWHTML5Chart descriptionThe TMS TTIWHTML5Chart component is designed to render various chart types in a browser usingHTML5/CSS3/JavaScript. The component currently offers following chart types: bar, area, line,stacked area and stacked bar. Multiple series can be simultaneously shown in the chart.TTIWHTML5Chart features-Different chart modes: area, bar, line, stacked area, stacked bar, xy.-Automatic display of a legend in both vertical and horizontal mode.-Annotations and value labels can be added to series points for any chart type.-A 3D effect can be optionally applied to each chart type.-Square, circle, rectangle or image markers on series points can be set for chart types: line,area, stacked area and xy.-A separate item layer is available to add any type of additional information on the chart at aposition of choice, either on top of the series or below.-Customizable text in X-axis, Y-axis and different X-axis, Y-axis per series.-Automatic Y-axis range calculation or configurable range.-Configurable helper lines and color banding.-Asynchronous updatable single series point or entire series and asynchronous updates ofseries properties, chart properties.-Different asynchronous events to handle clicks on various parts of the chart.-Display of series points values as hint on mouse-over.-Full asynchronous update support.7
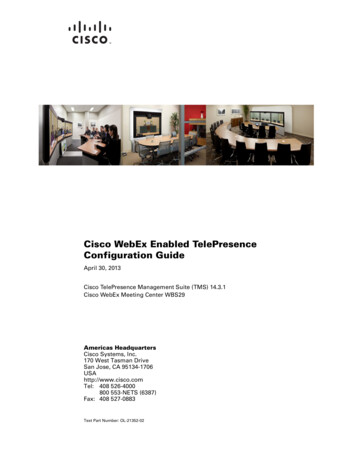
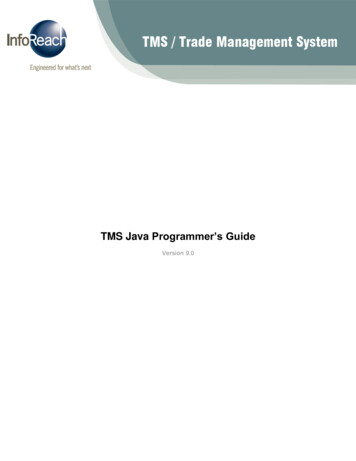
TMS SOFTWARETMS IntraWeb HTML5 Controls PackDEVELOPERS GUIDETTIWHTML5Chart architectureThe core part of the TTIWHTML5Chart is the series collection (1). As many series as required can beadded to the chart via this collection. Each series in this collection can be separately configured. Foreach series, an X-axis (2) and Y-axis (3) can be displayed. Further, a legend (4), caption (5) and statusline (6) are available. Finally, an item layer is a collection of items (7) that can be displayed along theseries, either below or on top of the series is available.TTIWHTML5Chart useGetting startedFrom the Delphi repository select a new IntraWeb application template.This is done by choosing: File - New - Other- VCL for the Web Application Wizard.From the component palette, select TTIWHTML5Chart and drop it on a form. This shows an emptychart. Add series via the collection editor shown upon clicking the property TTIWHTML5Chart.Series.The chart type for each series can here be set via THTML5ChartSerie.SerieType.8
TMS SOFTWARETMS IntraWeb HTML5 Controls PackDEVELOPERS GUIDEHTML5 DoctypeTo correctly enable the use of HTML5 code in a browser that supports this technology, it is requiredto include the HTML5 Doctype: “ !DOCTYPE html ”.In IntraWeb 11.0.47 or later this can be achieved by setting the DocType property of theServerController form.Example:procedure ender:TObject);beginDocType : ' !DOCTYPE HTML ';end;In earlier version of IntraWeb this can be achieved by setting the PageContext.DocType property inyour Form’s Render procedure.Example:procedure TIWForm1.IWAppFormRender(Sender: TObject);beginPageContext.DocType : ' !DOCTYPE html ';end;When using a TIWTemplateProcessorHTML control as the Form’s LayoutMgr, the Doctype definitionmust be placed on the first line in the template html file.Example: !DOCTYPE html HTML HEAD TITLE My Template /TITLE /HEAD BODY {%TIWHTML5Chart1%} /BODY /HTML Please note that including the HTML5 Doctype on a form can influence the appearance andfunctionality of other controls on the same form which are not compatible or not fully compatiblewith this Doctype!9
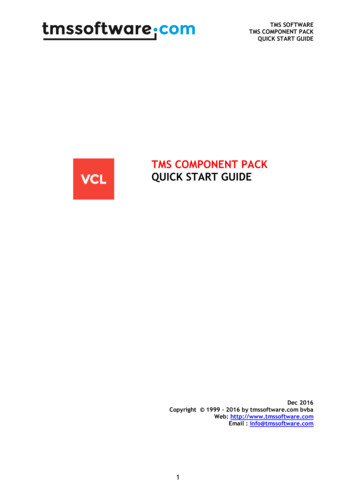
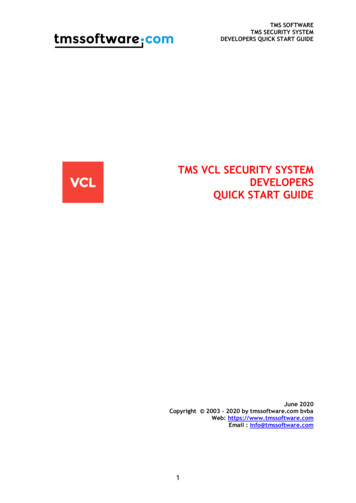
TMS SOFTWARETMS IntraWeb HTML5 Controls PackDEVELOPERS GUIDEChart TypesThis is an overview of the chart types that can currently be set for each series in the chart:-stAreaThe screenshot below shows an example of an area chart type. The chart displays three areaseries with 3D option enabled, with opacity and with value labels. One item is added on theitem layer to show the text “Sales 2011” in a rectangle. The location of the legend is set withChart.Legend.Position lpAbsolute and coordinates set via Chart.Legend.Left /Chart.Legend.Top.10
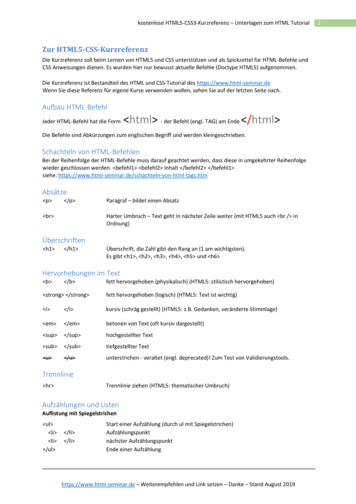
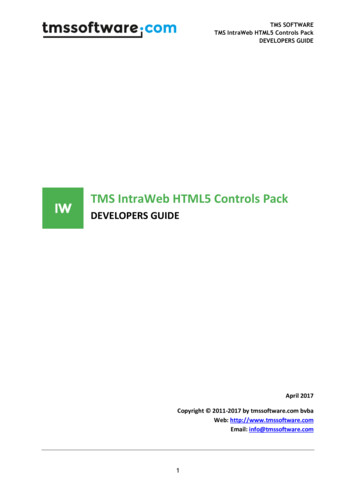
TMS SOFTWARETMS IntraWeb HTML5 Controls PackDEVELOPERS GUIDE-stBarBelow is an example of a bar chart type. This chart displays two series of data, with positiveand negative values. A legend is added and legend items are displayed horizontally, set withChart.Legend.Orientation oHorizontal. One annotation is added to the series 0 at point 5.Note also that in this sample, for each series, the range is set to the same value 80 / -80.This is done via Chart.Series[index].RangeFrom / Chart.Series[index].RangeTo. By specifyingan identical range for all series, the chart has for each series an equal division of values alongthe Y-axis. If values of different series are in an entirely different range, it is no problem todefine different values for Chart.Series[index].RangeFrom / Chart.Series[index].RangeTo foreach series. The Y-axis can in such case display multiple ranges, i.e. a range for eachdisplayed series instead of one common Y-axis as in the sample above.11
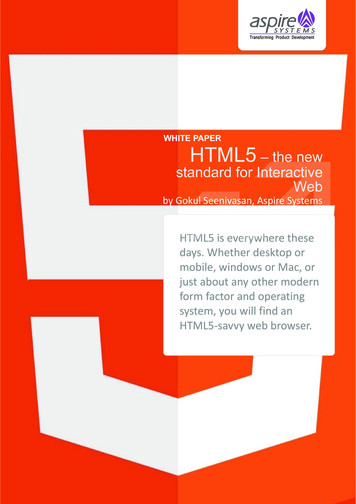
TMS SOFTWARETMS IntraWeb HTML5 Controls PackDEVELOPERS GUIDE-stLineOn the screenshot are 3 series of the line chart type. Square marker type was set for eachseries and value labels are shown. Note also the use of banding in the chart background.Banding is enabled with Chart.Bands.Enabled true and colors for even bands and oddbands are set with Chart.Bands.PrimaryColor / Charts.Bands.SecondaryColor. The color ofthe helper lines is set with Charts.Series[index].Yaxis. Color clWebRed.12
TMS SOFTWARETMS IntraWeb HTML5 Controls PackDEVELOPERS GUIDE-stStackedAreaOn the screenshot below, a stacked area chart is shown consisting of 3 series. The areasrepresent simply the sum of values of the series. The first series values are shown at thebottom, the last series values at the top. In this sample, annotations have been added toeach point in each series.Example code on how to fill the annotations with the values from each series can be found in thesamples paragraph.13
TMS SOFTWARETMS IntraWeb HTML5 Controls PackDEVELOPERS GUIDE-stStackedBarThe stacked bar chart shows 3 series of data with bars on top of each other for each series,summing the value. A 3D effect is enabled on the bar chart as well as opacity. Note that thelabels on each part of the bar can either represent the value of each series or the summedvalue. In this example, the summed value is chosen and this was set with:TIWHTML5Chart.Series[seriesindex].LabelType ltSum.14
TMS SOFTWARETMS IntraWeb HTML5 Controls PackDEVELOPERS GUIDE-stXYOn the screenshot are 3 series of the XY chart type. Circular marker type was set for eachseries. For XY chart types vertical lines are also displayed. Note also the use of positive andnegative values for both the X and Y axis.15
TMS SOFTWARETMS IntraWeb HTML5 Controls PackDEVELOPERS GUIDEGeneral chart settingsTIWHTML5Chart properties-BGColor: Sets start color of the gradient for the chart background.-BGColorTo: Sets end color of the gradient for the chart background.-BGGradientDirection: Sets the gradient direction for the chart background. The gradientdirection can be gdVertical or gdHorizontal.-Caption: Sets the text for the chart.-CommonZeroAxis: When set to true, all zero lines are forced to one position on the chart.This makes sense when comparison of different series is demanded in a chart with positiveand negative values.-HTML5Warning: Sets the message displayed when the browser that is used to render thecontrol does not support HTML5.-SelectedSerieIndex: Sets or gets the index of the selected series. Note that the selectedvalue point within a series is set edIndex: integer.-ShowAnimation: When set to true, the charts are displayed with animation. This means thatwhen values are shown, an animation effect will show these from zero till the actual value.Note that for performance reasons, animation has been disabled for iOS. The CPU of thesemobile devices is not sufficiently powerful to display a smooth animation.-Spacing.Horizontal: Sets the horizontal spacing between the chart and the left/right borderof the control.-Spacing.Vertical: Sets the vertical spacing between the chart and the left/right border ofthe control.Chart seriesAdding/Removing series valuesFirst open the series collection editor by clicking the TTIWHTML5Chart.Series property in the ObjectInspector. From here, series can be added or removed.16
TMS SOFTWARETMS IntraWeb HTML5 Controls PackDEVELOPERS GUIDEThe equivalent in code is:Adding a series:varcs: THTML5ChartSerie:begincs : TIWHTML5Chart1.Series.Add;cs.SerieType : stArea;cs.Name : ‘January’;cs.YAxis.visible : False;Removing a lect a series from the collection and its properties will be shown. The values for a series areorganized under THTML5ChartSerie.Items. Click the property Items to open the series itemscollection editor and from here values can be added or removed. The value is set viaTHTML5ChartSerieItem.Value: double property and the X-axis text is set viaTHTML5ChartSerieItem.XAxis: string property.17
TMS SOFTWARETMS IntraWeb HTML5 Controls PackDEVELOPERS GUIDETo add a new value or remove an existing value programmatically, use the code as shown in theexample below:Adding a value to a series:varcsv: THTML5ChartSerieItem;csv : alue : Random(1000);Removing a value from a lete(pointindex);Customizing series appearanceThe appearance of series can be further controlled via its properties. The following sample setsgradient start and end color, the opacity as well as the line color for the first series of an area chart. Italso sets the delta between values displayed on the Y-axis for this series to a fixed value of 100.beginTIWHTML5Chart1.Series[0].BGColor : clWebRed;TIWHTML5Chart1.Series[0].BGColorTo : clWebYellow;TIWHTML5Chart1.Series[0].LineColor : clWebBlack;TIWHTML5Chart1.Series[0].YAxis.Delta : 100;TIWHTML5Chart1.Series[0].Opacity : 200;end;The following code snippet sets the values that will be displayed in the X-axis for a series and bysetting the XAxis.Rotate property to true, instructs that the chart should render these labels in18
TMS SOFTWARETMS IntraWeb HTML5 Controls PackDEVELOPERS GUIDEvertical direction:for x : 0 to 11 dobeginTIWHTML5Chart1.Series[0].Items[x].XAxis : Months[x];TIWHTML5Chart1.Series[0].XAxis.Rotate : True;end;Chart series propertiesFor each series in the chart, an extensive configuration is possible. This is done via theTHTML5ChartSerie class for instances in the TTIWHTML5Chart.Series collection.THTML5ChartSerie properties-BGColor: Sets start color of the gradient for the series background, i.e. color of bars in a barchart or color of area in an area chart.-BGColorTo: Sets end color of the gradient for the series background.-BGGradientDirection: Sets the gradient direction for the series background. The gradientdirection can be gdVertical or gdHorizontal.-ItemAlignment: Determines the alignment of the item. Now fixed on iaCenter.-THTML5ChartSerieItemoDefined: Indicates if the item is displayed on the chart.oName: Can hold a name for the item.oTag: Stores an integer value. Tag is an integer property that has no predefinedmeaning. It can be used for storing an additional integer value, or it can be typecastto any value such as a component reference or a pointer.oValue: Stores the Y-axis chart value for the actual chart item.oXValue: Stores the X-axis chart value for the actual chart item. *-LabelColor: Sets the label text color.-LabelType: Sets the label type. Following types are defined: ltNormal, ltSum. When ltSum ischosen with a stacked area or stacked bar chart, the shown labels are the sum up to thatpoint in the chart. With ltNormal, the individual values are shown.19
TMS SOFTWARETMS IntraWeb HTML5 Controls PackDEVELOPERS GUIDE-LineColor: Sets the color of the lines in line series types or the border color for bar or areacharts.-LineWidth: Sets the width of the line in line series or the border width for bar or area charts.-MarkerColor: Sets the color for series point markers when used in line or area charts.-MarkerImageUrl: Sets the URL of the image file to use for the marker (when MarkerType isset to mtImage).-MarkerSize: Sets the size of the marker.-MarkerType: Sets the type of marker to use at series points for line or area charts. Followingvalues are defined:mtNone: No marker is displayed.mtCircle: A circular marker is displayed.mtSquare: A square marker is displayed.mtTriangle: A triangular marker is displayed.mtImage: An image is used as marker.-Name: Sets the name for the chart series. The name is used in the legend of the chart.-Opacity: Sets the opacity for the bar or area of a series when these types are used. Opacity isa value between 0 and 255. 0 means fully transparent, 255 means fully opaque.-RangeFrom: Sets the minimum Y-Axis value of a series.-RangeTo: Sets the maximum Y-Axis value of a series. This property can be used to createmanually some headroom on top of the chart, leaving enough space to display a legend.-SelectedBGColor: Sets the color for the series point when it is in selected state.-SelectedIndex: Sets or gets the index of the selected series point.-SelectedMarkerColor: Sets the color of the marker when the series point is in selected state.-SerieType: Sets the chart series type. Following types are defined: stArea, stBar, stLine,stStackedArea, stStackedBar. See the paragraph on series types for more information.-Show3D: When set to true, shows the different series types with a 3D effect.-ShowLabels: When set to true, shows text labels with the series point value.-Tag: Stores an integer value. Tag is an integer property that has no predefined meaning. Itcan be used for storing an additional integer value, or it can be typecast to any value such asa component reference or a pointer.-XAxis:20
TMS SOFTWARETMS IntraWeb HTML5 Controls PackDEVELOPERS GUIDEoDelta: Sets the delta between values where the value and a vertical helper line isdisplayed. When delta is set to zero, this delta is internally calculated as themaximum series value minus the minimum series value in the series divided by 10. *oFont: Sets the default font that will be used for the X-Axis values for the series.oRotate: When set to true, rotates the X-Axis values 90 degrees left for the series.oShowLines: When set to true vertical lines are displayed for the series. *oVisible: When set to true, X-Axis values are displayed for the series.-XRangeFrom: Sets the minimum X-Axis value of a series. *-XRangeTo: Sets the maximum X-Axis value of a series. *-YAxis:oColor: Sets the color of the helper linesoDelta: Sets the delta between values where the value and a horizontal helper line isdisplayed. When delta is set to zero, this delta is internally calculated as themaximum series value minus the minimum series value in the series divided by 10.oFont: Sets the default font that will be used for the Y-Axis.oPosition: Defines the position of the Y-Axis. Possible choices are: apLeft and apRight.oShowLines: When set to true horizontal lines are displayed for the series.oVisible: When set to true, Y-Axis values are displayed for the series.oZeroLineColor: Sets the color of the zero line.oZeroLineWidth: Sets the width of the zero line.* For XY chart types only.Chart annotationsAnnotations offer a way to show additional information, other than the value to a series point. Anannotation can be set as text, displayed in a rectangle with a background colour that can be specifiedand positioned near the series point. All annotations for the chart are bundled in the annotationscollection and accessible via the property: TTIWHTML5Chart.Annotations.The sample below shows an area chart with one red annotation for one individual value (data point 5in series 0).21
TMS SOFTWARETMS IntraWeb HTML5 Controls PackDEVELOPERS GUIDEProgrammatically, an annotation can be added with the following code:varca: THTML5ChartAnnotation;beginca : TIWHTML5Chart1.Annotations.Add;ca.SerieIndex : 0;ca.PointIndex : 5;ca.Caption : 'Annotation value';ca.BGColor : clWebRED;ca.BGColorTo : clWebRED;ca.BorderColor : clWebBLACK;end;THTML5ChartAnnotation properties-BGColor: Sets start color of the gradient for the annotation background.-BGColorTo: Sets end color of the gradient for the annotation background.-BGGradientDirection: Sets the gradient direction for the annotation background. Thegradient direction can be gdVertical or gdHorizontal.22
TMS SOFTWARETMS IntraWeb HTML5 Controls PackDEVELOPERS GUIDE-BorderColor: Defines the border color for the annotation.-Caption: Sets the text for the annotation.-Font: Sets the default font that will be used for the annotation.-Name: Can be set to give the annotation a name.-PointIndex: Sets the data point index within a series to which the annotation belongs.-SerieIndex: Sets the index of the series to which the annotation belongs.-Tag: Stores an integer value. Tag is an integer property that has no predefined meaning. Itcan be used for storing an additional integer value, or it can be typecast to any value such asa component reference or a pointer.Hints for series valuesIt is possible to show the values of series points only when the mouse hovers over the points. Thiscapability is enabled by setting TTIWHTML5Chart.Hint.Visible to true. Further control over theappearance of these hints is found under TTIWHTML5Chart.Hint.THTML5Hint properties-BGColor: Sets start color of the gradient for the hint background.-BGColorTo: Sets end color of the gradient for the hint background.-BGGradientDirection: Sets the gradient direction for the hint background. The gradientdirection can be gdVertical or gdHorizontal.-Caption: Sets the text for the hint.-Font: Sets the default font that will be used for the hint.-LineColor: Sets the color of the border of the hint.-LineWidth: Sets the width of the border of the hint.-Visible: When set to true, enables showing hints for series points.Chart item layer23
TMS SOFTWARETMS IntraWeb HTML5 Controls PackDEVELOPERS GUIDEThe TTIWHTML5Chart.ItemLayer is a collection of items that are positioned on the chart. An item canshow text or an image. The item can be shown below the chart series or above the chart series.Further, the position and the size of the item can be set with Top, Left, Height, Width properties.Note that when Height and Width are zero, the size of the item is calculated automatically to fit thetext set for the item.Adding/Removing item layer itemsAdding or removing an item layer item can be done either programmatically or at design-time.Double-click the TTIWHTML5Cha
TMS IntraWeb HTML5 Controls Pack DEVELOPERS GUIDE 9 HTML5 Doctype To correctly enable the use of HTML5 code in a browser that supports this technology, it is required to include the HTML5 Doctype: " !DOCTYPE html ". In IntraWeb 11.0.47 or later this can be achieved by setting the DocType property of the ServerController form. Example: