Transcription
Credit: Mr. Bayu Taruna Widjaja Putra @ AITWorkshop onTechnology development for climate resilience and efficientuse of resources in the agricultural sector in Thailand26-30 September, 2016The Sirindhorn Science HomeNational Science and Technology Development Agency (NSTDA)Sensors Technology &Precision AgricultureDr. Peeyush SoniAssociate ProfessorAsian Institute of Technology (AIT)Vice PresidentAsian Association for Agricultural Engineering (AAAE)soni@ait.asia1
What are Sensors? American National Standards Institute (ANSI) Definition– A device which provides a usable output in response to a specifiedmeasurandInput SignalOutput SignalSensor A sensor acquires a physical parameter and converts it into a signalsuitable for processing (e.g. optical, electrical, mechanical) A transducer– Microphone, Loud Speaker, Biological Senses (e.g. touch, sight, etc.)2
Detectable PhenomenonStimulusQuantityAcousticWave (amplitude, phase, polarization), Spectrum,Wave VelocityBiological & ChemicalFluid Concentrations (Gas or Liquid)ElectricCharge, Voltage, Current, Electric Field (amplitude,phase, polarization), Conductivity, PermittivityMagneticMagnetic Field (amplitude, phase, polarization), Flux,PermeabilityOpticalRefractive Index, Reflectivity, AbsorptionThermalTemperature, Flux, Specific Heat, Thermal ConductivityMechanicalPosition, Velocity, Acceleration, Force, Strain, Stress,Pressure, Torque3
Choosing a SensorLight Intensity Optical Sensors4
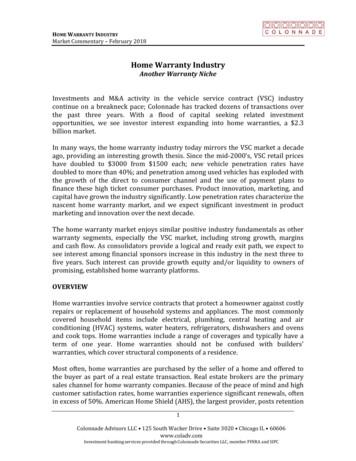
Weather Sensors Cost : THB 20,000 Arduino Based Opensource (including data-logger ThingSpeak)5
6
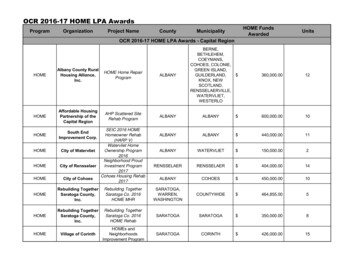
INTEGRATED SENSORSMetrologyDept.Data Collecting (Informationabout comodity, cultivation,pestsand deseases, roads, rivers,administrative area.AgricultureDept.Google/Bing Map12DBMSDBMS65GIS/Services/Web Server3FARM FIELDSURVEYOR4EXPERT11981210IMAGE SENSINGWIRELESSSENSOR :CLIMATE &AGRI SENSORSFARM FIELD7MARKETSend Data to ServerOutgoing Data fron Server / Action7
Variation and Resolution (Sensors)Many soil- and crop properties can vary withinfields: Texture (content of sand, silt, loam or clay) and pH of topsoiland subsoil Soil content of organic matter, of water and of variousminerals Slope and orbital orientation of the soil Density and morphology of crops Crop content of water and of various minerals Infestation of crops by different weeds and by various pests.8
Farmers are great observers !BUTMay not be able to explaintheir observationsAS SUCHProducers welcome scientific information and are eagerto learn from the discussion9
Initial precision agricultural effortswere driven by industrynutrientsOutcome: Spatial variability in crop vigor and yield was only partiallyremovedNeed: Technologies to quantify yield variability Variable-rate multi-nutrient applications were based on soil testingdata GPS was not available10
Soil SurveyBare Soil ImageGrid Soil Sampling(34 samples / ha)Computer Generated Management Zones11
Electro-magnetic induction12
Optimum leaf and soil nutrient levels (FAO, 2004)13
Most individuals agree that - - “seeing is believing”,ANDthe human eye is especially sensitive to green colorsUltraviolet (UV)(NIR)BUTHumans cannot see near infrared light, which is reflected byliving vegetation (also called biomass)AS SUCHFarmers largely base their assessment of crop vigor on“greenness” (related to chlorophyll content and nitrogen status)14
Remember - - - Canopy sensors respond to “living biomass” and “chlorophyllcontent”Treatments / N-ratesN StatusSimilarCanopy sensors can not quantify excess N (directly)ANDSoil background reduces sensitivity15
Sensors can be designed to be sensitive to Greenness (i.e., chlorophyll and nitrogen status in most cases)AND TOnear infrared (NIR) light - (“living vegetation” called biomass)BASICALLYNIR - size of the farm (cumulative indicator of canopy size )(number and size of leaves)Chlorophyll - output potential of leaves via photosynthesisRESULTING INYield and potential profitability- - - - This why we need to measure chlorophyll and biomass16
Basis ofAnalyses &TECHNIQUEs17
Heterogeneity in Fields: Basis of AnalysesTypes of spatial variation in a dimensionless diagram (From Oliver 1999, altered)18
Sensing by Electromagnetic Radiation19
Atmospheric Windows and CloudsThe atmospheric windows (white) show the wavelengths thatpenetrate the cloudless atmosphere of the earth. The gaseousmolecules that can block the transmission of wavelengthranges are indicated.(From NASA Earth Observatory 2010)20
Digital Number, Radiance, and ReflectanceRadiance (w/m² sr nm) Light Source ATM Surface MaterialSensora.Reflectance (Ratio) Surface MaterialLIGHTSourceIrradianceRAW (DN) Light Source Sensor ATM Surface MaterialATMa.WavelengthIrradianceb.b.Wavelength21
Reflection of radar signals from a smooth- orfrom a rough target surface22
Absorbance, reflectance and transmittance ofthe solar radiation spectrum by cloudsData from Liou 1976 , (altered, transmittance added)23
Absorbance, reflectance and transmittance forGround-Based / Near Ground-BasedSensing from satellites on different orbits, from an airplane and from a tractor (FromChuvieco and Huete 2010 and from Heege et al. 2008 , altered)24
Ground-Based /Near Ground-BasedWhy it’s needed25
Ground-Based / Near Ground-BasedWhy it’s needed: Limitations of Aerial/Satellite/Airborne technologies for commercial use forindividual farmer high cost of images from airborne, hilly hill in the plantation area, infrequency of satellite overpasses, risk of images being scattered by clouds delays between image capture and availability of usable data. trees shadesCost, efficiency &reliabilityTechnologyManagementPRECISION AGRICULTURE26
Precision Agriculture (Site-Specific Management) is not a“one-size-fits-all” proposition or universal solution toaddress spatial variability Different field sizesDifferent cropsDifferent soilsUncertainty about climate and water availabilitySpatial variability in nutrient statusAvailability of field equipment is importantImplementation might require technical assistanceHigh yields may not be highly correlated with profitabilitySustainability requires a multi-year analysis27
Perceptions - may not be true, but they are“REAL” in the minds of individualsPrecision Agriculture Perceptions I’m too old to learnToo expensiveMy fields are uniformI’m still farming, so my operation must be sustainableToo much riskI already demonstrate environmental stewardshipTechnical assistance is not available or is unreliable28
Original 4-RsApplied at the field scale - - delineates management zonesRIGHT - PlaceRateTimeFormWhat about the plant environment ?How to create a better environment for plants ?Consider:compactionnutrient placementplant competitionweeds29
Approaches to Precision AgricultureProactive- Plan ahead and lock-in decisionsbased on:soil texture and water holding capacitynutrient informationanticipated weatheryield goalReactive- Monitor weather and crop vigor to make in-seasonadjustments (also called “adaptive management”)according to: available soil wateranticipated weatherestimated nutrient losses thus far in the seasoncrop vigor (sensors or remote sensing)changes in yield potential30
Harnessing Precision Agriculture information is likemaking Som-Tam!Needs multiple ingredients in the right proportions31
Precision Agriculture is about innovationand thinking outside the boxHow would you connect these nine points with four continuous lines ?1423Think outside the box !32
lopeElevationCommon-Sense Relationships Are Important33
Uncertainty of climateWater (rain),Light Intensity143Pests & DiseasesNo plantsmanagement :Weeds56WaterShortageLow Quality &Quantityof Commodities2inappropriatedosage34
Technology UsedSensors,GIS& RSDATABASE.NET andWEB 2.0,MobileTechnologyClimate(ExternalFactor)(DSS)PA High YieldGOALCROP Nutrients,Weeds, PESTSAND DISEASESMANAGEMENT35
Advanced Technologies The growth of non-destructive technologies is very rapid Spectral vegetation indices are widely used for monitoring,analyzing, and mapping temporal and spatial variations invegetation structure as well as certain biophysical parameters Such indices enable assessment and monitoring of biophysicalproperties like soils (Joseph., et al, 2010), pests and diseases andmacronutrients (Joseph., et al, 2010; Schlemmer., et al. 2013). researchers used the technologies like CropSpec (Vali., et al. 2013),SPAD, Spectrometer (Yao., et al. 2014; Wang., et al. 2012; Min., et al.2008; Wei., et al. 2012; Elfatih., et al. 2010; Javier., et al . 2014),GreenSeekers (Ali., et al 2015), CropCircle, and LAI meter toanalyze the crop-plant in many different parameters.36
Weeds, Pests & Diseases Management37
Nutrient Management'Barrel Analogy' using nitrogen as the least available nutrient38
N Nutrient Management(Deciding the location and activities)39
N Nutrient Management(Input Plant position inside field area)Field informationRealtime Climatedata40
N Nutrient Management(Image analysis and DSS via Online)Value (%)Nitrogen Recommendation forindividual Coffee PlantSource: Bayu (2016)41
SENSORS42
INTRODUCTION (Background)Active Nitrogen Sensor (CropSpec)GNSSCropSpec Algorithm:S1 100 * (R – 1)WhereR NIR/ RedEdgeCompared toNDVI (R - 1) / (R 1)S1 value ratio S1 value of an interest areaS1 value of the nitrogen stripS1CAL 47 * S1 / S1REFR is simple ratio of NIR reflectance (800-810 nm) toRedEdge (730-740 nm)43
Active Nitrogen SensorsSpecificationsGreenSeeker CropCircle CropSpec ManufacturerModelData loggerLight SourceN Tech Indus. Inc.RT 200RTCommanderLEDHolland ScientificACS 470GeoSCOUT GLS 400Modulated polychromaticLED arrayTopconIP 67X 20LasersPowerOperationalWavebands12 VDC660/15 (Red) and770/15 (NIR)10 to 17 VDC670/20 (Red) and760/LWP (NIR)10-32 VDC730/10 nm (Red) and800/10 nm (NIR)Foot print/ Field ofview5 60 cm15 57 cm (changes withheight)2-3 metersViewing angleOperating HeightMount32 0.86 metersHandheld or Sprayerboom32/6 0.6-1.2 metersHandheld or Sprayerboom45-55 2-4 metersTractor cabSource: McVeagh et al. (2012).44
Crop Circle ACS-430orAgLeader OptRxFunctions Day or Night45
Variable-Rate N Injection46
TopconHolland Scientific(Ag Leader)NTech Industries(Trimble)47
TopconCrop SpecFoot-printchangeswith plantheight48
Modulation/Demodulation UsingPolychromatic LEDsTARGETUser SelectedFiltersLEDACS-470PD1PD2PD3SENSOR49
Spectrometerwe tested ASEQ INSTRUMENT mini spectrometer which can provide spectral data withinthe range of 300-1000 nm ( USD 1,500)LIGHT MEASUREMENT (COSINE ADAPTER)REFLECTANCE MEASUREMENT% 𝑅 𝑠𝑎𝑚𝑝𝑙𝑒 𝐷 𝑠𝑎𝑚𝑝𝑙𝑒 𝐷 𝑑𝑎𝑟𝑘 100𝐷 𝑆𝑝𝑒𝑐𝑡𝑟𝑎𝑙𝑜𝑛 𝐷 𝑑𝑎𝑟𝑘50
Leaf chlorophyll meters (SPAD)it is exposed to two light sources: (1) a red- (640 nm) and (2) aninfrared light (940 nm) positioned just above the leaf51
Camera asPassive Sensor52
Traditional CCD and CMOS sensors CCD – Charge Coupled Device CMOS – Complimentary Metal OxideSemiconductor CMOS sensors offer higher performance capabilities, and arecommonly found in ultra-high frame rate videography CCDs are more common in consumer camera applications dueto lower cost of development53
CCD vs. CMOS Main differences:CCDCMOSSignal from PixelElectron packetvoltageRelative R&D costLowHighHigherLowerHighModerateModerately fastVery fastModerateVery lowCost to ManufactureDynamic rangeSpeedRelative powerconsumption54
Traditional Film and Foveon Sensors55
The Bayer Array Sensor Extrapolates color data from adjacent pixels Cannot reproduce colors to extreme accuracy without moving a camera tothree positions Less expensive to produce than Foveon sensors56
Working of an RGB CCD sensor57
So, how do they produce images? Photons strike the sensor, and are converted intoelectrical charges Charges of pixels are read– CCDs transport the charge across the chip to be read atone corner of the array– CMOS sensors can read charge at each individual pixel. Analog-to-digital conversion of voltages to digitalvalues58
Most consumer cameras utilize 8-bit pixels– “Bit depth” refers to a sensor’s sensitivity togreyscale depth.– 8 bits per pixel, 3 channels (RGB); 28 256 discretecolors59
What does it mean? This information is sent to a post-processingsystem, which continues to process incomingdata. Post-processing uses numerous algorithms tode-mosaic, reduce image noise, and enhanceedges. Images are compressed and saved into theirrespective format on a hard disk.60
CAMERAS AND TOOLSGray Card:18% ReflectanceFootprint 20x20cmModified Camera(Removed the Hot Mirror)Nikon D70 with InternalFilter RG665Prodisk II & 24 Colors cardJPEG & Pre-processing WBRGB Standard(Unmodified)ASUS ZENFONE 5External Filter5 BandsRGB, RedEdge andNIR61
CAMERA AND IR FILTERModified Camera;Footprint 20x20cmTHB 3000Unmodified Camera (canon IXUS160)ASUS ZENFONE 5Nikon D70 with Internal Filter590 long pass (life pixel)THB 3000External Filter ZOMEI (680nm, 720nm, 760nm and 850nm) CHINA (THB 3000)SCHOOT RG665 USA (USD 80)Dualband Pass Filter (715nm and 815nm) USA (USD 140)Red transparent paper (plastic) BookStore AIT (USD 0.15 / THB 5)Roll Film (negative)62
IR FILTER (Zomei 720, 760, 850)63
CCD SENSOR(Nijland, 2012)64
IR FILTER (SCHOTT 01000120065
IR FILTER (DUAL NIR BANDPASS FILTER) Microscope (25,4 mm)66
IR FILTER (DUAL NIR BANDPASS FILTER) Microscope (25,4 mm)RED EDGE(715-740)1800016000NIR815 4006008001000120067
RED TRANSPARENT PAPER (PLASTIC) BOOK STORE590 nm68
RED TRANSPARENT PAPER590 nmv.s LIFEPIXEL 590nm USA (USD 230)/Wratten25a590 nmSource: astronomy.activeboard.com (2012)69
RED TRANSPARENT PAPER70
ROLL FILM (NEGATIVE FILM)71
SpectrumImage (camera)Reflectance𝐑(𝑰𝒎𝒂𝒈𝒆) 𝐃𝐍 (𝑰𝒎𝒂𝒈𝒆) 𝐑 (𝑮𝒓𝒂𝒚 𝑪𝒂𝒓𝒅)𝐃𝐍 (𝑮𝒓𝒂𝒚 𝑪𝒂𝒓𝒅)72
Camera (Modified camera single Chip filter)(Dworak., et al, 2013)(Poudel. et al., 2013)(Dworak., et al, 2013)73
LIGHT SOURCEHALOGEN 12V50WIMAGENIR CAMERA & PAPER FILTER (Longpass filter590nm) ISO 200NIR CAMERA & PAPER FILTER (Longpass filterSCHOTT 665nm) ISO 200NIR CAMERA & DUALBAND PASS FILTEROMEGAOPTICS(715 & 815nm)ISO 100RGB CAMERA & AUTO ISO74
NIR CAMERA & PAPER FILTER (Longpass filter590nm) ISO 200NIR CAMERA & PAPER FILTER (Longpass filterSCHOTT 665nm) ISO 200NIR CAMERA & DUALBAND PASS FILTEROMEGAOPTICS(715 & 815nm)ISO 100RGB CAMERA & AUTO ISO75
Potential use of the CAMERAChlorophyll Color (NIR / RGB)Nitrogen Color (NIR / RGB)Phosporus Color & Size (NIR/RGB)Potasium Color & Size (NIR/RGB)Water Stress Color (NIR / RGB)Pests and Diseases Color & Shape (NIR / RGB)Sulphur Color (NIR / RGB)Zn, Fe SizePAR, LAI76
CANOPYMEASUREMENT77
Crop canopy sensor research was initiated in 1993Situation: Chlorophyll meters worked well for researchpurposes, but are not practical for commercial fieldsTherefore: Need for mobile devices to provide informationrelated to crop biomass (size of the factory) and canopychlorophyll content (photosynthesis)Introduced in 1990First crop canopy sensors used natural lighting(known as passive sensors)Problems:cloudsshadowschanges in brightness during the dayActive sensor research initiated in 1999Attributes:Chanceto beSolvedgenerated modulated lightno affect of shadowsoperational any time of the daycan be used to facilitate “on-the-go” nutrient applications78
(The use of CropSpec & Camera)Cameras Platform /- 1 meterAdjustable79
(The use of CropSpec & Camera)Cameras Platform80
Image from the canopyCameras Platform81
LEAVESMEASUREMENT82
The use of Spectrometer Spectral measurement the coffeeleaves by using spectrometer Measured the 15 leaves labeled Measure the left and right side of thevein Each side measure 10 times and getaverage83
In-seasonNitrogenManagement84
Understanding the nal Nitrogen Uptake, %755040% of requirement after silking2570-80% of requirement after V8 - 100MayJuneJulyAugSept85
When?How much?How much early?In season?N uptakeSensor basedIn-season NEarly NPlantingV6V9Tasseling86
PhotosynthesisChlorophyllVisibleWavebandsReflects NIRBiomassNear InfraredWavebands(NIR)Sensors Measure Disappearance of red light Abundance of reflected NIRChlorophyll captures VIS light87
Normalize Vegetation Index Valuesto remove “field effects”Compare all data to “Healthy Plants” that have the same:Growth stageCultivar (variety)Previous cropWater managementSoil properties - - - except nutrientsIf one assumes all nutrients are adequate except for N, for example :---------------------------Differences in crop vigor are probably related to plant N status88
Common Vegetation IndicesNDVI (NIR – Red)----------------------------------(NIR Red)NDRE (NIR – Red R Red Edge)Chl Index (NIR – -(Red Edge – Red)Visible / NIR (Red)----------------(NIR)See: Existing VegetationIndices 100 VIs89
Sufficiency IndexRelative “Vigor”(i.e., 92% adequate)“ Target “Reference “Managed Crop”“Happy Crop” SI N-rich (highest 3 consecutive seconds) GreenSeeker N-rich (average) Missouri Virtual reference from field with modest preplant N Holland90
Sensors only Measure Bulk ReflectanceFeSPN- Many factors can influence leaf chlorophyll content 91
Algorithm Comparison“Why not compare nitrogen recommendations using a common dataset ?”Algorithms have been developed using specific sensors that areassociated with recommended agronomic practices Wave-band differencesReference Strategy (normalization)Opportunity for producer inputPreplant N differencesYield (relative, predicted, not used)NUE inputpatents92
PRACTICAL Session1.Use Spectrometer, SPAD, CROPSPEC2.Use CAMERA with different filters (Handheldand DRONE) and EXTRACT RGB from PICTURES3.Apply to appropriate VIs (provided 100 moreVIs)4. Statistical Analysis (SPECTROMETER, SPAD, orCROPSPEC will be as dependent variable), andCAMERA data will be as Independent variable93
94
Arduino Based Opensource (including data-logger ThingSpeak) 5. 6. 7 G IS /S ervices/ Web S erver G oog le/ B ing Map Metrolog y D ept. A g riculture D ept. D ata C ollecting (Inform ation about com odity , cultivation,pests and deseases, roads, rivers, adm inistrative area. DDBBMMSS F A R M F IE L D S U R V E Y O R IMA G E S E N S IN G WIR E L E S S S E N S O R : C L IMA T E & A G R I S E N S .