Transcription
Evaluation of Rutting Distress for Asphalt Concrete MixtureUsing Abaqus ProgramM. FakhriAssistant professor, Department of Civil Engineering, K.N.Toosi University of Technology, Tehran, IranA. TowfighM.Sc. student, Department of Civil Engineering, K.N.Toosi University of Technology, Tehran, IranABSTRACT: Rutting or permanent deformation is one of the most significant problemsassociated with asphalt pavement performance. It is characterized by a permanent change inthe shape of the pavement or pavement layers due to cyclic wheel loads. Quality of asphaltmix (HMA) is one of the main factors that affect the flexible pavement performance. Use ofpoor quality mix and finding their consequences through pavement performance evaluation isoften too costly. Therefore, the remedy is to evaluate the quality of the mix at the design stageof a project. Use of the finite element method (FEM) and other advanced analysis techniquesis suitable for evaluation of pavement response and performance. This research describes amethod of predicting the behavior of various asphalt mixes (surface coarse and binder coarsemixes) and linking these behaviors to an accelerated performance testing tool (Wheel Tracktest). The Wheel Track device is used in this research for asphalt laboratory acceleratedrutting resistance testing and for calibration of material parameters developed in uniaxialrepeated load creep and creep recovery testing. The ABAQUS program is used in thisresearch for the finite element simulation. Two and three dimensional finite element modelswere developed and utilized in order to predict rut depth of the mixtures. Result of thisresearch is a practical framework for developing finite element model to predict ruttingpotential of asphalt concrete mixtures.KEY WORDS: Rutting, wheel track, creep model, abaqus.1 INTRODUCTIONPavements represent the largest component of public investment in transport. At the presentmost pavements in Iran are asphalt pavements. These pavements deteriorate with time due totraffic loading and environmental exposure. Pavement deterioration process is complex andinvolves not only structural fatigue but also many functional distresses of pavement. It resultsfrom the interaction between traffic, climate, material and time. Deterioration is used torepresent the change in pavement performance overtime. The ability of the road to satisfy thedemands of traffic and environment over its design life is referred to as performance (White2002).Asphalt pavement rutting is one of the most commonly observed pavement distresses.Millions of dollars are reportedly spent annually to repair rutted asphalt pavements. As trafficloading increases significantly and more frequent periods of hot weather due to global
warming, the problem of pavement rutting is anticipated to escalate. Improvements of hot-mixasphalt materials, mix designs and methods of pavement evaluation and design includinglaboratory and field testing is considered necessary to provide extended pavement life andsignificant cost savings in pavement maintenance and rehabilitation (White 2002).In the past subgrade deformation was considered to be the primary cause of rutting andmany pavement design methods applied a limiting criterion on vertical strain at the subgradelevel. However recent research indicates that most of the rutting occurs in the upper part ofthe asphalt surfacing layer (European Commission 1999). Therefore in this research finiteelement modeling is used to predict rut depth in asphalt layer of pavement.2 DEFORMATION OF ASPHALT CONCRETE MIXTURES AND CREEP MODELAsphalt is a visco-elasto-plastic material with behavior depending on temperature and rate ofloading. Perl considered the elastic, plastic, viscoelastic and viscoplastic strain components ofasphalt mix behavior in his research on the permanent deformation of the asphalt mixes (Perl1983). Contribution of each component in mixture performance depends on temperature ofthe mixture and rate of loading. At low temperatures, asphalt mix can be considered to behavelike a linear viscoelastic material, but the higher the temperature, the more important andsignificant are the response components which describe the viscoelastic and viscoplasticcomponents (Perl 1983).At elevated temperatures and constant stress or load, asphalt mix will continue to deform ata slow rate. This behavior is called creep (Spencer 1988). At a constant stress and temperature,the rate of creep is approximately constant for a long period of time. After this period of timeand after a certain amount of deformation, the rate of creep increases, and fracture may occur.A creep power law is available in a finite element program namely ABAQUS that was used inthis research. The creep power law model can be used in its “time hardening” form or in thecorresponding “strain hardening” form for pavement rutting ABAQUS simulation. Thetime-hardening form of the creep model was used in this research (Abaqus 2004):ε Aσn tm(1)Where:ε creep strain rate, σ the uniaxial equivalent deviatoric stress, t the total time andA, m, n parameters related to material propertiesThe above function is defined as a power law equation and its use assumes thatviscoplastic strain is the sole contributor to permanent deformation. An instantaneous plasticstrain is neglected in this model (Huang 1995). In this study resilient modulus test was usedfor determining the elastic properties of asphalt mixtures and dynamic creep test was used fordetermining the material creep parameters. Also, results of the wheel track test on mixtureswere used for calibration of the finite element models.3 MATERIALSTwo mixes of aggregate combination and bitumen were used in this study. Coarse aggregateand fine-filler are all from local supplier. For the production of the asphalt concrete mixture a60/70 penetration grade bitumen was used. The characteristic properties of the two materialsare shown in Table 1 and Table 2.
Table 1: Physical characteristics of the materials used in the projectTestTest methodSand Equivalent TestResistance to Degradationby Abrasion and Impact inthe Los Angeles MachineDetermining the Plasticand Plasticity Index LimitPercentage of FracturedParticlesCoating and Stripping ofBitumen-AggregateMixturesMethods for determinationparticle shape ofSoundness of Aggregate byUse of Sodium SulfateTest ResultsCoarsesand adation TypeNumber of tic Index-N.PN.PASTM-D5821One sidetwo side9687-- 95--Elongation indexFlakiness indexCoarse aggregate26-2.5-Fine 04Table 2: Properties of bitumen (PG 60/70)PropertiesTest methodUnitValueSpecific gravity (25 c)ASTM-D70g/cm31.008Penetration (25 c)ASTM-D50.1mm67Softening pointASTM-D36 c49.6Ductility (25 c)Solubility inTrichloroethyleneFlash pointKinematic Viscosity(120 c)Kinematic Viscosity(135 c)Kinematic Viscosity(160 c)ASTM-D113cm 100ASTM-D2042%99.1ASTM-D92 23ASTM-D2170centistokes1514 MIX DESIGN AND MARSHALL PROPERTIES4.1 Aggregate GradationThe aggregate gradation for the dense Asphalt Concrete mix with maximum nominal size 25mm (AC-25) and 19 mm (AC-19), used in this study are as shown in Table 3.
Table 3: Gradation of mixturesSievesize(mm)AC-25Passing Lower-upper(%)limitsSievesize(mm)AC-19Passing 85-210.07552-80.07562-104.2 Optimum Binder ContentThe Marshall method was used in order to determine the optimum binder content of theasphalt mixtures, which was found to be 5.1% and 5.5% by weight of mix for AC-25 andAC-19 respectively. Table 4 shows the volumetric properties of the mixtures at the optimumbinder content.Table 4: the volumetric properties of the mixtures at the optimum binder contentAC-25Bindercontent, perweight ofmix, ility,kgfAirVoids,%223113504Voids inmineralaggregate,(VMA) %14231010173.915.4Void filledwith asphalt,(VFA) %Flow,mm722.6574.72.855 PERFORMANCE TESTS ON BITUMINOUS MIXTURESA series of laboratory tests were designed to assess the fundamental mechanical propertiesand evaluated deformation resistance of mixtures. All the tests were carried out at optimumbitumen content for all mixtures. Since the wheel tracking test was carried out only at atemperature of 60ºC; therefore, the temperature at the other tests and in the rutting analyses isalso fixed at 60ºC.5.1 Resilient Modulus TestResilient modulus of asphalt mixtures was measured by indirect tensile test, is the mostpopular form of stress–strain measurement used to evaluate elastic properties. The testing wasconducted at 60 C. At this high temperature, resilient modulus of asphalt mixtures wasdrastically decreased. Specimen dimensions were 100mm diameter by 70mm thick. Thesespecimens were then tested according to the standard of ASTM-D4123. In the test, a pulseddiametric loading force is applied to a specimen and the resulting total recoverable diametricstrain is then measured from axes 90 degrees from the applied force. Pulse time was chosen1000 ms for high trafficked roads volume. Value of 0.35 for poisson’s ratio is used as aconstant.
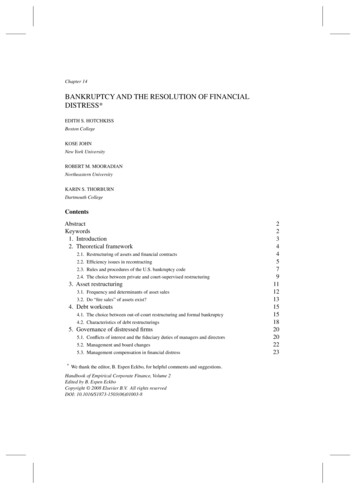
5.2 Dynamic Creep TestStrength of the bituminous mixtures to the plastic deformation may be determined with thedynamic creep test. Permanent deformation of a cylindrical specimen under a uniaxial,dynamic load is measured as a function of time, the specimen dimensions and test conditionswere standardized. Deformation values were measured with time by linear variable transducer(LVDT). Specimen dimensions were 100mm diameter by 70mm thick. These specimens werethen tested according to the standard of BS-DD226. Test was carried out for all mixtures atthe optimal bitumen content at 60 C during 1800 pulse cycles. The test was conducted threetimes with different stresses for each sample. AC-25 Samples and AC-19 Samples wereexposed to 100, 125, 150 kPa and 75, 90, 100 kPa stresses respectively. Lower stresses wereapplied to AC-19 samples because of the sample destruction. For each stress, three replicateswere tested and the average of three tests was reported.5.3 Wheel Tracking TestThe wheel tracking tester and Roller Compactor developed by a Japanese company was usedin this research (Figure 1). The wheel tracking tester was used according to theAASHTO-T324 test procedure. A contact pressure of 500kPa and total wheel load of 760Nwas applied to the 300mm 300mm 50mm slab specimen. The slabs were compacted withroller compactor. The wheel tracking tests were conducted at the 60 C of temperature toevaluate the permanent deformation characteristics of bituminous mixtures.Figure 1: Roller CompactorWheel Tracking Machine6 CREEP PARAMETERS DEVELOPMENTAs noted, the time-hardening form of the creep model was used in this research and thisfunction is defined as a power law equation and its use assumes that viscoplastic strain is thesole contributor to permanent deformation. An instantaneous plastic strain is neglected in thismodel (Huang 1995). It is an indication that the nonrecoverable deformation in the repeatedload creep and creep recovery test depends mainly on the viscoplastic strain component, andthat the plastic strain can be considered insignificant if larger number of pulses are applied.This confirms the observations by Huang (Huang 1995). Therefore, in this researchcumulative permanent strain value that obtained from dynamic creep test is used as aviscoplastic strain to develop creep parameters. The viscoplastic axial strain versus timerelationship for all stress levels for the AC-19 mix is shown in Figure 2. Because all of the
lines in the plot exhibit similar slope, it can be concluded that the viscoplastic strain εvp isproportional to tβ. The slope β is 0.35. The viscoplastic strain is (Perl 1983):Log Viscoplastic Strain (10-4)εVP σ,t,N B σ tβB σ εVP σ,t,Ny 0.342x 0.949R² 0.998y 0.356x 1.010R² 0.9972(2)tβy 0.354x 0.805R² 0.998175 kpa90 kpa100 kpa000.511.522.533.5Log Time(s)Figure 2: Log scale of viscoplastic Strain versus Time Relationship of the AC-19 mixThe εvp / tβ versus stress relationship for the AC-19 mix is shown in Figure 3. It can bedescribed by a second-order polynomial function (Perl 1983):B σ b1 σ b2 σ2(3)Viscoplastic Strain/tβ (10 -4)2015y 0.0008x2 0.0323xR² 0.78161050020406080100120Stress (Kpa)Figure 3: Viscoplastic Strain/tβ versus Stress Relationship of the AC-19 mixTherefore, the rate of the irrecoverable strain can be expressed as (Lai 1973):εvp t β(b1 σ b2 σ2 )tβ-1(4)A creep power law is available in ABAQUS, the finite element program that was used in thisresearch. To define the creep model, the function in Equation 5 is expressed in a power lawform. The creep power law model is as follows (Huang 1995, Hua 2000):
εvp Aσn tm(5)The A, n and m creep power law parameters for the two asphalt mixtures were developed usingregression analysis.7 FINITE ELEMENT MODELINGIn the finite element analysis, the structure and other auxiliary conditions have to be correctlymodeled to obtain reasonable results. This includes various components of the finite elementmodel such as material properties, load conditions, boundary conditions, element type andgeometry of the model.7.1 Modeling of Wheel Tracking TestThe objective of the model is to describe the impact of wheel track device on various asphaltmixes and define what occurs in the asphalt sample during the wheel tracking test. Aschematic of the 3D slice of the wheel track sample is shown in Figure 4. No sideconfinement was applied in the 3D slice model.Figure 4: Schematic of the 3D slice of the wheel track sampleAs shown in Figure 4, 300mm (in length) 28.5mm (in width) and 50mm (in height)rectangular bituminous mixture structure was constructed to simulate the wheel tracking test.The average length of the wheel footprint of 28.5 mm is used for modeling. A uniformloading pressure of 500 kPa is used in the analysis. The creep model available in the plasticitygroup of ABAQUS software was used for the rutting simulation and the A, n and mparameters were entered. The modulus of elasticity and Poisson’s ratio were also entered foreach mix. The Poisson’s ratio at temperature of 60ºC is calculated using the following formulagiven in MEPDG (NCHRP 2004):μac (0.15 0.35)/(1 e (-1.63 3.84x10⁻⁶Eac))Where:(6)μac Poisson’s ratio of asphalt mix at a specific temperatureEac modulus of asphalt mix at a specific temperature (psi)Simulating an actual wheel track loading sequence can be a difficult task in finite elementmodeling. Alternatively, a simplified loading method was introduced and used by Huang(1995) and subsequently by Pan (1997), Hua (2000), and Fang (2000, 2004). With this simple
approach, the load is first applied over the entire length of the wheel path. The totalcumulative loading time is then estimated using the number of wheel passes and the timerequired for traversing the tire print of the wheel during a single pass. The time for a singlepass is estimated based on the tire print length and the wheel velocity. This simpler approachdrastically reduces the computational time the load is applied by using a single step. A seriesof finite element analyses were performed with decreasing element size to determine thesuitable mesh size.7.2 Calibration against Measured Rutting in Wheel Tracking TestThe n parameter is stress related. As the rut resistance testing in the wheel track device isconducted at a constant loading stress of 500 kPa, the n parameter is fixed at the initial levelshown in Table 5. Parameter A is the value of the y-axis intercept while parameter m is relatedto the slope of the strain-time relationship curve in a log-log scale (White 2002). Initially onlyparameter A is adjusted to match the rutting depth measured after 8000 passes. Afteradjustment of the parameter A, if the rutting predicted in ABAQUS was not overlapped themeasured rutting, the adjustment of parameter m, controlling the slope, is also required.Figure 5 compare the measured rut depth versus number of cycle relationship with ruttingpredicted in ABAQUS for the AC-25 mix at the cycle of loading of about 250, 500, 1000,2000, 4000, 6000 and 8000. Table 5 shows the final elastic and creep parameters.Permanent deformation 10002000300040005000600070008000Number of cycleFigure 5: Rutting measured in wheel track and predicted in ABAQUS for the AC-25 Mix.Table 5: Final elastic and creep parameters of mixesAC-25Material ParametersElasticCreepModulus Poisson sAn(Kpa)Ratio( 7.481.71m
7.3 Simulation of Asphalt Concrete Layers of Pavement and Rut Depth PredictionIt is assumed in the model that a single 50 mm layer of AC-19 asphalt wearing course isplaced over the double 70 mm layers of AC-25 asphalt base course so that rutting could occuronly in the asphalt layer. It is also assumed that the layer of HMA is fully bonded with theunderlaying layer so that no movement of the HMA layer can occur on the surface of the baselayer.In this study load was modeled using Goodyear G159A 11R22.5 tires in a dual-tireconfiguration with an 80 kN standard axle load and a 620 kPa tire inflation pressure. In thisconfiguration, each tire carries a load of 20 kN because there are four tires on an axle. Figure5 shows the simplified contact area for a single axle with dual tires. Contact stresses areassumed to be constant within a given rectangular area (White 2002).The asphalt mixes’ elastic and calibrated creep parameters, shown in Table 5, are used inthe modeling of the asphalt concrete layers performance. Similarly for the wheel trackmodeling the time of loading is calculated. ABAQUS simulations are completed for 5 millionand 10 million ESAL’s traffic loading. The assumed speeds of commercial vehicles are 60, 70and 80 km/hour. It is also assumed that, asphalt pavements may rut during summer periodwith the starting point being at the end of spring and the rutting period can last potentially 4months ending at the beginning of fall. As the dual wheel system is symmetric, only half ofthe system is modeled. The distance between the two wheel tires in a dual wheel system is120 mm. The contact pressure is as shown in the tire model in Figure 6.Figure 6: Simplification of tire footprintAs the three middle areas are longer by about 15 percent, an additional loading time is usedfor these areas. The loading is applied in two steps. In Step 1, the contact pressures shown inFigure 5 are applied over the entire tire width for a period of time based on the length of theoutside areas of the tire model. In Step 2, the contact pressure is applied only in the threemiddle areas of the tire for an additional period.As the wheel tire wanders within the wheel path, it causes the upheaval outside the tire tomigrate away from the wheel path (White 2002). In a National Pooled Fund Study (PFS) atthe Indiana Department of Transportation/Purdue University Accelerated Pavement TestFacility, rutting for the single-wheel-path loading (i.e. with no wander) was about 1.7 timesthat of rutting with 250 mm wander (White 2002). A wander rut depth reduction factor of 1.7is assumed in this research. Table 6 shows a summary of the predicted pavement rutting withwander reduction, downward rut depth, height of the upheaval and the total rut depth ofpavements with all five mixes.
8 CONCLUSIONSIn this research a method of predicting the behavior of various asphalt mixes was describedand linking this behavior to an accelerated performance testing tool (wheel track test) andpavement performance. Various laboratory test methods of determining asphalt mixcharacteristics were examined in terms of their use in performance prediction. Detailedanalysis completed in this research indicates that asphalt rutting occurs mainly due to itsnonlinear viscoplastic nature. A finite element method (FEM) was selected to be used in thisresearch as it allows for the evaluation of nonlinear viscoplastic behavior of asphalt mixes.The result is a framework for developing material parameters in laboratory testing that can beused in FEM modeling of accelerated performance testing and pavement performance. Therelationship between the predicted rut depth in ABAQUS and field measurement was goodand between the predicted value and measured value was not much difference.Table 6: Summary of Predicted Total Pavement RuttingTraffic Loading(million nt RuttingPredicted in ABAQUS (mm)Total RutDownward RutUpheaval RutDepth ( )DepthDepth 88.630.4218.229.2Total PredictedPavement Rut Depthwith Wheel WanderReduction (mm)15.114.313.618.817.917.29 REFERENCESAbaqus Inc., 2004. Abaqus Version 6.5, Analysis User’s Manual.European Commission, 1999. Cost 333 Development of New Pavement Design Method - FinalReport of the Action. Brussels, Belgium.Hua, J., 2000. Finite Element Modeling and Analysis of Accelerated Pavement Testing Devicesand Rutting Phenomenon. Ph.D. Thesis, Purdue University.Huang, H., 1995. Analysis of Accelerated Pavement Tests and Finite Element Modeling ofRutting Phenomenon. Ph.D. Thesis, Purdue University.Lai J., 1973. Irrecoverable and Recoverable Nonlinear Viscoelastic Properties of AsphaltConcrete. Transportation Research Record 468, National Research Council, WashingtonD.C., p 73-88.National Cooperative Highway Research Program, 2004. Guide for Mechanistic- EmpiricalDesign of New and Rehabilitated Pavement Structures. NCHRP, Part 2 – Design Inputs,Chapter 2 Material Characterization”, 2004.Perl, M., 1983. Visco-Elasto-Plastic Constitutive Law for a Bituminous Mixture UnderRepeated Loading. Transportation Research Record 911, National Research Council,Washington, D.C., p 21-27.Spencer, A.J.M., 1988. Continuum Mechanics. Longman Scientific & Technical.Von Quintus, H.L., 1994. Performance Prediction Models In the Superpave Mix DesignSystem. Strategic Highway Research Program, SHRP-A-699, Washington, D.C.White, T.D., 2002. Contributions of Pavement Structural Layers to Rutting of Hot Mix AsphaltPavements. Transportation Research Board, National Research Council, NationalCooperative Highway Research Program, NCHRP Report 468, Washington, D.C.
KEY WORDS: Rutting, wheel track, creep model, abaqus. 1 INTRODUCTION Pavements represent the largest component of public investment in transport. At the present most pavements in Iran are asphalt pavements. These pavements deteriorate with time due to traffic loading and environmental exposure. Pavement deterioration process is complex and