Transcription
2016CRIMINAL JUSTICE TREND REPORT SERIES:Driving Under Influence
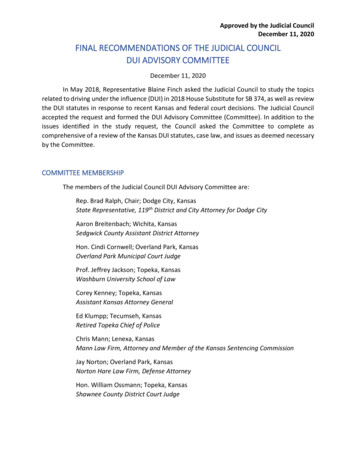
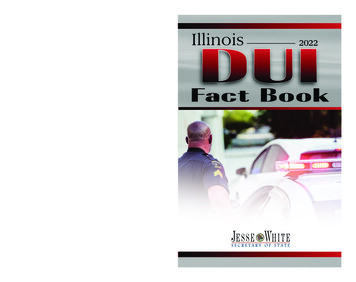
Driving Under Influence: 2016DrivingUnderInfluenceDriving under the influence (DUI) is driving, operating, orphysically controlling the movement of a vehicle under theinfluence of alcoholic beverages or narcotic drugs. DUI isa Part II offense.ArrestsThere were 46,752 DUI arrests in 2016, which represented approximately 365.7 DUIarrests per 100,000 Pennsylvanians. The total number of DUI arrests decreased by 0.9percent from 2015 and by 9.3 percent since 2007 (Figure 1). The rate at which DUIarrests occurred per person decreased by 0.8 percent since 2015 and by 11.8 percentsince 2007. In the past decade, DUI arrests peaked in 2008 at 54,114 and a rate of434.7.Figure 1. DUI arrests arrests in blue (left axis) and rate of DUI arrests per 100,000 persons inyellow (right axis) in Pennsylvania.Table 1. Total arrests and rate of arrests for DUIs in Pennsylvania from 2007 to 2016. Data from1990 to 2016 can be found in Appendix 398.0Source: Pennsylvania State Police, Uniform Crime ReportRates computed using U.S. Census Bureau Population 68.5201646,752365.7Page 2
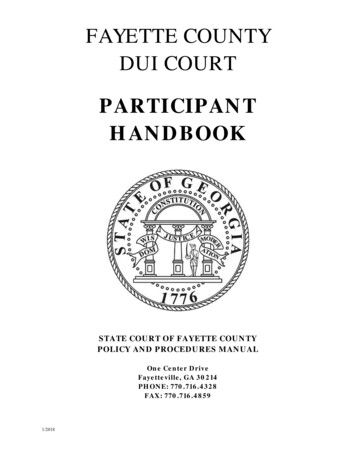
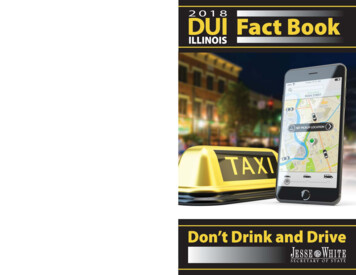
Driving Under Influence: 2016Pennsylvania (365.7) ranked highest compared to its surrounding states in terms of DUIarrests (Figure 2). Delaware (37.3), Ohio (168.2), New Jersey (260.0), New York (275.3),Maryland (342.6), and West Virginia (353.8) all ranked lower than the state.Pennsylvania ranked above both the rate for the Northeast (284.6) and the nationalaverage (313.6).Figure 2. DUI arrest rates for Pennsylvania, surrounding states, and United States, 2016.The DUI arrest rate trend decreased in Pennsylvania, the Northeast Region, and theU.S. in the past decade. Since 2007, DUI arrests fell by 11.8 percent in Pennsylvania, by12.9 percent in the Northeast, and by 33.0 percent in the U.S. (Figure 3). Pennsylvaniadecreased the least amount among these groups, keeping it as the highest rate of allthree groups.Figure 3. DUI arrest rate for Pennsylvania, Northeast, and United States, 2007 to 2016.Source: Pennsylvania State Police, Uniform Crime ReportRates computed using U.S. Census Bureau Population EstimatesPage 3
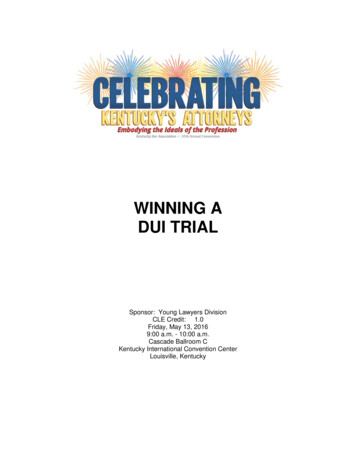
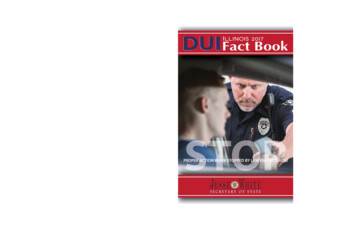
Driving Under Influence: 2016Figure 4. DUI arrest rate by county in Pennsylvania, 2016.The state’s average DUI arrest rate was 365.7 per 100,000 population in 2016 (Figure4). The five counties with the highest DUI arrest rates in 2016 were Carbon (847.6),Monroe (587.6), Dauphin (571.8), Wyoming (566.8), and Armstrong (565.5). The fivecounties with the lowest DUI arrest rates in 2015 were Allegheny (278.4), Philadelphia(271.6), Union (177.8), Montour (130.8), and Sullivan (48.9).Table 2. DUI arrest rate by county, 1.9393.9566.8454.5Source: Pennsylvania State Police, Uniform Crime ReportRates computed using U.S. Census Bureau Population EstimatesPage 4
Driving Under Influence: 2016Appendix ATable A1. Total arrests and rates of arrest for DUIs in Pennsylvania from 1990 to .7Source: Pennsylvania State Police, Uniform Crime ReportRates computed using U.S. Census Bureau Population EstimatesPage 5
In the past decade, DUI arrests peaked in 2008 at 54,114 and a rate of 434.7. Figure 1. DUI arrests arrests in blue (left axis) and rate of DUI arrests per 100,000 persons in yellow (right axis) in Pennsylvania. Table 1. Total arrests and rate of arrests for DUIs in Pennsylvania from 2007 to 2016. Data from 1990 to 2016 can be found in Appendix A.