Transcription
Analyzing Machine Learning Workloads Using aDetailed GPU SimulatorJonathan Lew* , Deval Shah* , Suchita Pati** , Shaylin Cattell* , Mengchi Zhang† , Amruth Sandhupatla* ,Christopher Ng* , Negar Goli* , Matthew D. Sinclair** , Timothy G. Rogers† , Tor Aamodt*arXiv:1811.08933v1 [cs.DC] 18 Nov 2018*Electrical and Computer Engineering, University of British Columbia{jonathan.lew, shaylin.cattell, cng123}@alumni.ubc.ca{devalshah, amruth, negargoli93, aamodt}@ece.ubc.ca**Computer Science, University of Wisconsin-Madison{spati, sinclair}@cs.wisc.edu† Electrical and Computer Engineering, Purdue University{zhan2308, timrogers}@purdue.eduAbstract—Most deep neural networks deployed today aretrained using GPUs via high-level frameworks such as TensorFlow [1] and PyTorch [2]. This paper describes changes we madeto the GPGPU-Sim simulator [3], [4] to enable it to run PyTorchby running PTX kernels included in NVIDIA’s cuDNN [5] library.We use the resulting modified simulator, which we plan tomake available publicly with this paper, to study some simpledeep learning workloads. With our changes to GPGPU-Sim’sfunctional simulation model we find GPGPU-Sim performancemodel running a cuDNN enabled implementation of LeNet forMNIST reports results within 30% of real hardware. UsingGPGPU-Sim’s AerialVision performance analysis tool we observethat cuDNN API calls contain many varying phases and appearto include potentially inefficient microarchitecture behavior suchas DRAM partition bank camping, at least when executed onGPGPU-Sim’s current performance model.Index Terms—GPGPU-Sim, Simulator, CNN, CuDNN, GPU,PyTorchI. I NTRODUCTIONMachine learning is being employed to tackle a rapidlygrowing set of problems. In recent years deep neural networks(DNNs) have made striking advances in accuracy. TrainingDNNs requires massive amounts of computational power,which is currently predominantly done with graphics processorunits (GPUs). While industry has rapidly introduced changesto GPU architectures to support machine learning training,such as Tensor Cores and NVLINK introduced in the NVIDIAVolta architecture [6], academic researchers have largely focused on designing inference accelerators. Although the focusof academic researchers is to exploit the strong potentialfor neural network deployment in mobile platforms (e.g.,iPhone X, Huawei) and small embedded devices [7]–[10],another reason for the lack of academic research on optimizingGPUs for machine learning may be the lack of support incurrent architecture simulators for running these workloads.This paper takes an important step towards addressing thisshortcoming.Popular machine learning frameworks such as TensorFlowand PyTorch typically expose a high-level python applicationprogramming interface (API) to developers. Calls to this APIinvoke computation on a GPU via specialized precompiledlibraries such as cuBLAS [11] and cuDNN [5]. To achievethe highest levels of performance these libraries are typicallyprovided by hardware vendors. These libraries take advantage of the vendor’s detailed knowledge of their product’smicroarchitecture, which is typically not fully described inpublicly available documentation. As a result, popular opensource GPU architecture simulators such as GPGPU-Sim [3],[4] are unable to run applications that make use of theseprecompiled libraries. Indeed, we confirmed with the maintainers of GPGPU-Sim that a key limitation of the currentlyavailable version of GPGPU-Sim is the lack of support forapplications that use precompiled libraries. In this paper, wefocus on enabling support for cuDNN as cuDNN enables thehighest performance on NVIDIA GPUs via implementation ofspecialized algorithms such as Winograd [12].One limitation of this work is a lack of support forNVIDIA’s tensor cores which is a consequence of the factthat the intermediate-level PTX assembly code [13] embeddedwithin NVIDIA’s cuDNN library does not include tensor coreoperations. Instead, the cuDNN library appears to containhand tuned machine-level SASS assembly code for supportingtensor cores. This is a limitation because the current versionof GPGPU-Sim only supports executing SASS code for oldergeneration GPUs. We believe that the updated GPGPU-Simframework we provide is still of significant value as the limiteddynamic range of 16-bit floating-point provided in NVIDIATensor Cores can result in convergence issues unless specialsteps are taken [14]. As a consequence, many machine learningresearchers still use cuDNN APIs that avoid using TensorCores. While NVIDIA’s CUTLASS [15] enables use of TensorCores, it does not implement highly optimized kernels suchas Winograd which can provide large performance gains forconvolutional neural networks (CNNs) that have small filtersizes.Overall, we make the following contributions in this paper:
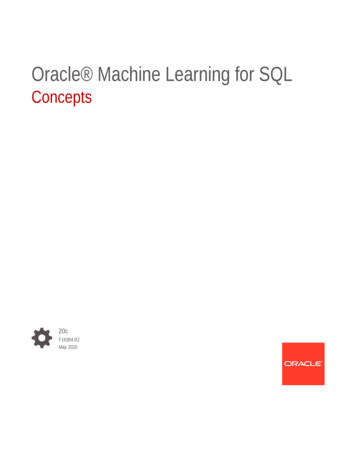
We modify GPGPU-Sim to enable running cuDNN. Inturn, this enables us to run PyTorch and should enablerunning other high-level frameworks such as TensorFlow.We introduce a new methodology to identify bugs in thefunctional simulation implementation of GPGPU-Sim.As the runtime of architecture simulators is many ordersof magnitude slower than hardware and machine learningworkloads can run for days, we introduce checkpointingsupport to GPGPU-Sim.Using our modified GPGPU-Sim we analyze oneof NVIDIA’s cuDNN application samples modelingLeNet [16] trained with the MNIST dataset.II. BACKGROUNDThis section provides background on machine learningframeworks and their implementation as well as GPU simulators.A. Machine Learning FrameworksEnthusiasm for employing machine learning in practicefollowed AlexNet [17] achieving an impressive 15.3% top5 test error rate on image classification, far out-performingstate-of-the-art models at that time. AlexNet was trained forseveral days on two GPUs, although it was observed thatthe amount of GPU memory and training time limited thenetwork’s size. Follow on work proposed more sophisticatedapproaches such as VGGNet [18], GoogleNet [19], ResidualNetworks [20] and DenseNets [21], which have surpassedhumans in classification accuracy. This result was achievedby combining huge datasets and GPUs. Prior research hasshown that GPU can be 4 to 50 faster than CPUs [22]–[25]. Thus, GPUs play an important role in accelerating theexecution times of CNNs [26].Subsequently, companies have provided more optimizedhardware and software for running machine learning workloads on GPUs. For example, NVIDIA has introduced specialized cores known as Tensor Cores, high bandwidth NVLINKfor communication between GPUs, and optimized their software stack (e.g., CUDA, cuBLAS, and cuDNN). Matrix multiplication is the key underlying operation behind most of theneural network computations and a highly optimized GPUcode to implement traditional matrix multiplication operationhas a time complexity of O(n3 ) [26]. Faster alternativesinclude the Winograd and Strassen [27] algorithms. Here,the Strassen’s algorithm has a time-complexity of O(n2.81 )whereas Winograd has a complexity of O(n2.38 ). As Winogradis faster than Strassen’s algorithm, it is used in librariessuch as cuDNN, which are exploited by frameworks such asTensorflow and PyTorch.B. GPU Performance Simulators1) NVProf: The most closely related tool to GPGPUSim is NVProf [28], NVIDIA’s command-line profiler forCUDA programs. NVProf and GPGPU-Sim give many similarstatistics, including instructions per cycle and the number ofinstructions executed for certain types of instructions suchas loads and stores. They also track basic memory andstall information. NVProf is useful in many cases since itprovides fast, accurate results from the hardware itself. Severalrecent papers have used tools like NVProf to profile machinelearning workloads [29]–[31]. However, since these papersuse profilers, unlike our work they can only provide higherlevel analysis about the behaviors of the applications. Incomparison, GPGPU-Sim provides detailed information onmemory usage, power, efficiency, can easily be extended toprovide additional statistics, and can output useful plots ofrelevant statistics using AerialVision [32].2) Simulation: Some prior work has also simulated machine learning workloads, but these papers used private simulators [33]–[36]. Since these simulators are not publiclyavailable and few details are available, it is difficult to comparetheir approaches to ours. In comparison, we simulate machinelearning workloads at high fidelity in the widely used, publiclyavailable GPGPU-Sim. Moreover, the fact that other papersuse disparate architectural simulators for machine learningworkloads makes it crucial to provide better, publicly availabletools for simulating machine learning workloads.III. I MPLEMENTATIONThis section describes the modifications that were requiredto simulate cuDNN and PyTorch applications in GPGPUSim. We use regression tests and NVIDIA’s cuDNN MNISTexample to verify the functional correctness of our changes.Some of the the key changes we discuss are: (1) adding support for precompiled GPU kernel libraries, (2) implementingsome missing CUDA Runtime and CUDA API functions, (3)finding and fixing bugs in the existing functional simulatorthat prevented correct execution, and (4) adding support forcheckpointing simulation. Figure 1 shows the control flow ofGPGPU-Sim with our modifications.A. Support for kernels in external CUDA librariesThe existing version of GPGPU-Sim first extracts all PTXcode embedded within an application from the binary usingan NVIDIA supplied program called cuobjdump. Next,GPGPU-Sim combines the extracted PTX into a single PTXfile that is then parsed by GPGPU-Sim’s program loader.Unfortunately, this approach causes two issues when tryingto run cuDNN enabled applications:First, we found that cuDNN programs and programmingframeworks that use cuDNN are typically dynamically linkedto the cuDNN library. However, current versions of cuobjdump do not resolve dynamic linked libraries before searchingfor PTX code. Thus, GPGPU-Sim fails to launch kernels contained in dynamically linked libraries. There are two potentialsolutions to this: either modify GPGPU-Sim to search throughany dynamically linked libraries (using ldd), or rebuild theCUDA application and statically link against the externallibrary. In this paper, we followed the latter approach, as shownin Figure 1 ( 1 ).Second, cuDNN includes code and variables with the samenames in multiple source files. After combining all the PTX
Fig. 1. GPGPU-Sim’s Control Flow with modifications for cuDNN.extracted from the application binary into a single file, thesemultiple definitions resulted in errors when parsed by GPGPUSim’s program loader. Thus, we modified GPGPU-Sim toextract and process each embedded PTX file separately ( 2 ).B. Additional CUDA Language SupportNVIDIA’s CUDA enables overlapping memory copies fromCPU to GPU with computation on the GPU via a constructknown as streams (similar to a command queue in OpenCL).We found that cuDNN uses multiple streams to overlapmemory transfers with computation. Although GPGPU-Simalready supports streams, we found it did not support all therequired API functions. Thus, we added support for cudaStreamWaitEvent, an API call that allows a stream to waitfor an event to occur before continuing execution.Additionally, we also added support for PTX instructionsthat were not implemented in the current version of GPGPUSim, but are used by cuDNN. For example, we found thatcuDNN uses the bit reverse instruction (brev.type d,a;), which was introduced in PTX version 2.0, for FFTbased convolutional kernels [5], [37]. Thus, we added animplementation for this instruction, which is used to outputthe bits of its input in reverse order.Moreover, in the process of developing our debugging tool(discussed further in Section III-D), we found that we hadto add an alternative CUDA API call for launching kernels:cuLaunchKernel. The CUDA Runtime API equivalent iscudaLaunch, which was already supported by GPGPU-Sim.C. Texture ReferencesTo represent textures, GPGPU-Sim uses a system of texturenames, texture references (texref), cudaArrays, textureInfos,and textureReferenceAttrs. A given texture name maps to atexture reference, and a given texture reference maps to aset of cudaArray, textureInfo, and textureReferenceAttr. Thisaligns with the APIs cudaRegisterTexture to map a nameto a texref; cudaBindTextureToArray to map a texref to aset of cudaArray, textureInfo, and textureReferenceAttr; andunbindTexture to unbind a cudaArray from a texref. A textureinstruction in CUDA kernels accesses this data by looking itup with the texture name.Although textures were already supported in GPGPU-Sim,MNIST registered multiple texrefs to the same name. Thiscaused conflicts in the map and as a result, data was lost.Consequently, some texture instructions would fail becausethey could not find the cudaArray they were looking for. Toresolve this problem, we mapped the texture names to a setof texrefs and also mapped texture names directly to their associated cudaArrays, textureInfos, and textureReferenceAttrs.Thus, texture instructions now use texture name to look upcudaArrays, textureInfos, and textureReferenceAttrs.We also encountered another problem with textures wherethe program called bindTextureToArray on the same texrefwith different cudaArrays multiple times. To resolve this,we assume the program meant to first unbind the existingcudaArray from the texref, and then bind the new cudaArrayto the texref.D. Debugging Functional Simulation ErrorsAlthough the existing GPGPU-Sim simulator correctly runsa large number of CUDA applications such as those found inRodinia [38], machine learning workloads presented additionalcomplexities. After the changes discussed in Sections III-AIII-C, GPGPU-Sim could run MNIST to completion but generated incorrect results. This presented us with a big challenge:How to find which instruction(s) out of billions of executedinstructions was incorrect?The developers of GPGPU-Sim gave us some help byexplaining the process they followed to getting GPGPUSim working [4]: first, they validated individual instructionsone-by-one by comparing execution on real GPU hardwarewith execution on GPGPU-Sim. Then, once each instructionappeared to work, they started with getting smaller applications (e.g., template from the CUDA SDK) running andprogressively ran larger applications. While adding applications, they used GNU’s gcov tool to compare the coverageanalysis of the simulator for correctly simulated applicationsand new, incorrectly simulated applications. By comparingthese, performing “differential coverage analysis”, they wereable to narrow down which part of the functional simulatorhad a bug.Thus, we first attempted to solve the functional correctnessissues by employing a similar differential coverage analysis.We compared the coverage of the functional simulator whenrunning the regression tests on GPGPU-Sim’s Github pagewith the results obtained running MNIST. Using this approach,we identified that GPGPU-Sim’s implementation of the bit
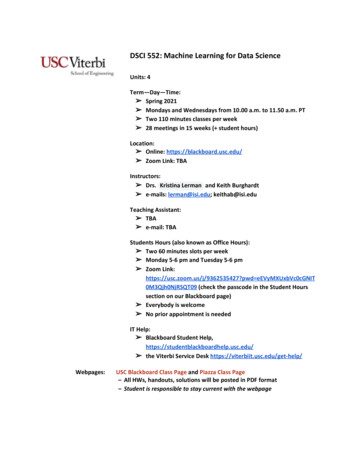
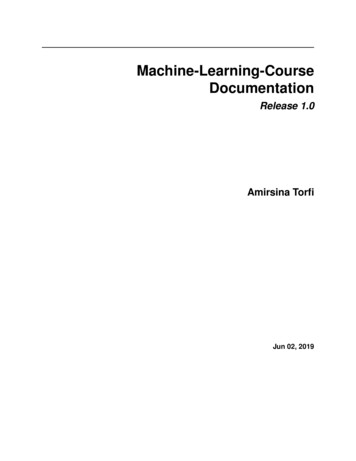
CUDNNXYZ( )GPU HWGPGPU-SimParamKernel 1void fft2d r2c 32x32(float2*, int, int, . )OutputKernel 2ptxjitptxjitvoid fft2d r2c 32x32void fft2d r2c 32x32Kernel 1PTX InstructionKernel 1PTX Instruction101Kernel nOutputBuffer001OutputBufferFig. 2. Identifying the first incorrectly executing kernel within a multi-kernel library function callModified PTX InstructionsCUDNN CallKernel 1Kernel 2.Kernel nPTX Instructions( Unmodeified)sub.s32 %r121, %r114, %r120;st.global.s32 [%rd30], %r121add.u64 %rd30, %rd30, 4;ptxjitDebuggingdiv.u32 %r148, %r2, %r121;Toolsub.s32 %r121, %r114, %r120;st.global.s32 [%rd30], %r148div.u32 %r148, %r2, %r121;add.u64 %rd30, %rd30, 4;rem.u32 %r149, %r2, %r121;rem.u32 %r149, %r2, %r121;st.global.s32 [%rd30], %r149add.u64 %rd30, %rd30, 4;ptxjitRun it onGPURun it onGPGPU-SimFaulty InstructionCompareStored Value ofAdded StoreInstructionsrem.u32 %r149, %r2, %r121Fig. 3. Identifying the first incorrectly executing instruction within the first incorrectly executing kernelfield extract instruction (bfe.type d, a, b, c;) hadsubtle errors for signed inputs. Thus, we modified GPGPUSim’s bit field extract instruction implementation to correctlyhandle signed 32-bit and 64-bit integer inputs. However,after this change, GPGPU-Sim’s result for MNIST was stillincorrect. We found no other other lines that were exercised bycuDNN and not exercised by the regression tests that appearedto involve incorrectly executing instructions.We then developed a new approach to debugging functionalsimulation errors in GPGPU-Sim that was ultimately successful in finding the remaining error. We believe this approach andthe resulting debug tool, which we plan to make available withthis paper, will be useful to other researchers encounteringincorrect results when running new applications in GPGPUSim. At a high level, we compare the execution of everyinstruction executed by GPGPU-Sim to the result obtainedfrom executing that instruction on hardware, then flag the firstinstruction with an error. An important practical complicationwe encountered is that every high level API call in cuDNNlaunches several kernels onto the GPU. Thus, in practice, wefollowed a three-step process: first identify which cuDNN APIcall results in incorrect results, then identify which GPU kernellaunched within that API call is executing incorrectly, andfinally identify the first instruction in that kernel that executedincorrectly.To identify which cuDNN API call was incorrect, wecompare the result buffers on GPGPU-Sim versus the hardware by adding calls to cudaMemcpy to MNIST. However,having identified an incorrect API call, finding which specifickernel of our cuDNN enabled application was responsiblefor an incorrect result is non-trivial because we do not havesource code for cuDNN. Thus, we changed to GPGPU-Sim tooptionally capture and save all relevant data to a file. As shownin Figure 2, this data corresponds to the data which is beingcopied to the GPU before a kernel is launched, along with theparameters passed into the kernel as GPGPU-Sim runs.Armed with this data, and using our debugging framework,the extracted PTX, and a version of the ptxjit CUDA SDKexample, we systematically launch each kernel from the failingcuDNN API call onto both GPGPU-Sim and a real GPU.We assume that any kernel parameter that is a pointer maypoint to an output buffer. We also modified GPGPU-Sim toobtain the size of any GPU memory buffers pointed to bythese pointers. Then, after the extracted kernel executes weuse cudaMemcpy to transfer all buffers back to the CPUso they can be output to a log and compared. By comparingthe buffers after each kernel, we can identify which kernelexecuted incorrectly.Next, as illustrated in Figure 3 we instrumented the extracted PTX for just the incorrectly executing kernel so thatthe results of each executed instruction that writes a value toa register is saved into a new global array in GPU memory.At the end of the kernel execution, this array is transferred toCPU memory and written to a log file. Comparing GPGPUSim execution of this modified kernel versus GPU hardwarehelps the user to identify the first instruction that executedincorrectly. To help automate the process of adding storeinstructions to a kernel, we developed an LLVM-based toolto modify a kernel.Using the above approach we found that the first kernelin cudnnConvolutionForward had an error when executing a remainder instruction. Specifically, the remainderinstruction “rem.u32 %r149, %r2, %r121;” inside thekernel “fft2d r2c 32x32” generated a different result inGPGPU-Sim versus hardware. In the existing GPGPU-Simthis instruction is implemented by the function rem implusing the code:data.u64 src1 data.u64 % src2 data.u64;In GPGPU-Sim, data, src1 data, and src2 data areC/C “union” type called ptx reg t which, among others,contains fields named “.u32” for holding 32-bit unsigned
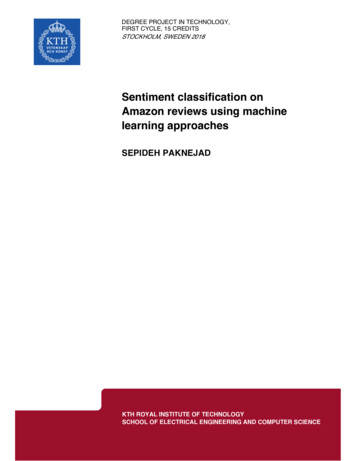
values and “.u64” for unsigned 64-bit values. Thus, this codeis incorrect in some cases because it does not take into accountsigned vs. unsigned operations and 32- vs. 64-bit values. Toresolve the problem, we added a switch statement take accountof the type specifier and signed operations, e.g., .u32 andinstead use the code such as:data.u32 src1 data.u32 % src2 data.u32;when type is “.u32” anddata.s32 src1 data.s32 % src2 data.s32;when type is “.s32”. After making this change, cuDNN wasable to run 32-bit floating-point applications correctly.1) FP16 Support: Much research on hardware support fordeep learning, particularly for inference, focuses on reducedprecision. NVIDIA supports 16-bit floating-point on both theirregular ALUs and in their Tensor Cores and cuDNN has 16bit (FP16) versions of the algorithms it supports for deeplearning. Accordingly, we added FP16 support in GPGPUSim, including instructions that convert FP32 to FP16 and backusing an open source library.However, when we ran MNIST in FP16 mode, it producedincorrect results. We traced this problem back to a subtle issuewith multiply instructions, followed by either a subtract or anadd, being optimized by the NVIDIA assembler into fusedmultiply-add (FMA) SASS instructions. The FMA instructionretains additional precision between multiplication and addition, which results in a mismatch between GPGPU-Sim andexecution on GPU hardware. Thus, correctly simulating codewith 16-bit floating-point instructions is left to future work.We expect our debugging strategy mentioned above will be ofhelp in this regard but will need to be modified to account forrounding errors.2) Timing-Model Deadlocks: We also fixed bugs in thememory model and in GPUWattch code that caused cuDNNenabled programs to deadlock GPGPU-Sim’s timing model.E. PyTorch and TensorFlowAfter successfully running 32-bit MNIST with correct outputs, we turned our attention to supporting PyTorch and TensorFlow. PyTorch’s calls invoke functions in its shared library,C.so. A regular PyTorch build uses rpath to link this C.sodynamically to a hard-coded path to the CUDA RuntimeLibrary installed on the machine. We removed all these rpathlinks, so that it would forced to look for a shared library at runtime. Then we changed the search paths in our environmentso that it would find GPGPU-Sim’s libcudart.so. Finally,we used cuDNN’s shared library libcudnn.so to get thesource of the corresponding PTX.When an application imports Torch, the library libcudart.so is loaded, which invokes a series of initializationfunctions in GPGPU-Sim and GPUWattch. A thread exit inGPUWattch caused another library load, which created adeadlock. We solved this by removing the thread exit.We took a similar approach to try to get Tensorflowto run in GPGPU-Sim. We managed to get TensorFlowto call CUDA Runtime API, but unfortunately TensorFlowtries to launch PTX that is not in libcudnn.so. Toget around this, we attempted to use TensorFlow’s pywrap tensorflow internal.so’s PTX. However, thisfile it uses syntax that is not supported by GPGPU-Sim toinitialize arrays using curly braces ({}). Thus, adding thissupport is left to future work.F. Checkpointing supportGPGPU-Sim can be run either in the Performance simulation mode or in the Functional simulation mode. TheFunctional simulation mode only executes the application andgives functionality correctness of the application, but doesn’tgive any performance statistics. The Performance simulationmode collects all statistics and gives an estimate of thenumber of GPU clock cycle on actual hardware. However, thePerformance simulation mode is generally 7-8 times slowerthan the Functional simulation mode. Run-time of architecturesimulator is significantly slower than the actual hardware andaccordingly a typical cuDNN/Pytorch application might takevery long time to run on GPGPU-Sim. For example, MNISTtakes 1.25 hours on GPGPU-Sim’s Performance mode toclassify three images. This is much longer than a real GPUtakes, and the user may only be interested in the performanceanalysis of a particular part of the program rather than theentire program. Thus, we added checkpoint-resume functionsto GPGPU-Sim. The flow of checkpointing is explained in theFigure 4 and the flow of the implementation is explained inthe Figure 5.CTA 0CTA 1CTA 0CTA 1CTA 0CTA 1CTA MCTA M 1YInstructions/CTACTA N-1CTA NKernel 1CTA M tCTA N-1CTA NKernel xFunctional simulationCTA N-1CTA NKernel KPerformance simulationFig. 4. Checkpointing in GPGPU-Sim: Instead of running entire the application in the Performance mode, the user can run the application in theFunctional simulation mode until some point, as shown in Figure 4, and savethe necessary data to resume in files. Then the user can resume from this pointin Performance simulation mode. Parameters to define checkpoint positionsuch as x, M , t and y, as shown in Figure 4, can be defined by the user inGPGPU-Sim config file.We support checkpointing at bound kernel boundaries and aCTA boundary within a kernel. At the end of each kernel, wesave the computational results to the GPU’s global memory.This makes it possible to resume execution from any kernelwhich has been executed before the checkpoint. For a checkpoint at a specific CTA M within a kernel x, all the kernelswith kernel id x are executed normally and the state ofthe GPU’s global memory is saved to a file. For kernel xany of the M 1 CTAs before the desired checkpoint pointare executed normally. However, for CTAs M to M t, y
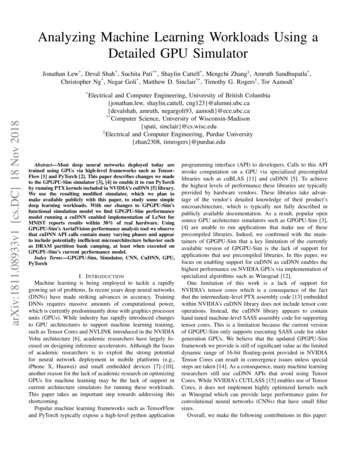
Kernelid xYesCudaLaunchNoCudaLaunchKernelid xYesLoad Data2NoInitialize CTAInitialize CTAKernel xSkip kernel runYesCTA M t &&kernel xCTA M t &&kernel xNoYesExecute YInstructions/CTACTA M &&kernel xNoNoCTA NiYesExecute CTAIncrementCTAYesStore Data2Kernel ExitNoCTA NiCheckpoint FlowData1 :CTA CTA MNoLoad Data1Execute Full CTAIncrementCTAStore Data1NoYesYesKernel ExitResume FlowRegister file and local memory per thread, SIMT stack per warp, Shared memory per CTAData2 : Global memory per KernelFig. 5. Block diagram for Checkpoint and resume flow. Here parameters x, t, M and Y can be configured by the user and explained in figure 4. Ni is thetotal number of CTA in the specific kernel.HardwareSimulation100%90%80%Relative Execution TImeinstructions (y x) per CTA are executed. In order to resumefrom that point, we also need to checkpoint the register dataand local memory data for each active thread, the SIMT stack(which is used to handle branch divergence within a warp [3])for each active warp, and the shared memory for each CTA.All kernels with kernel id x are not executed.To resume at a given checkpoint, all kernels with a kernel id x are skipped but the GPU global memory is restoredfor each kernel since the program might call cudaMemcpybetween two kernels and perform computation on this data.For kernel x, all CTAs M are skipped for computation.CTAs M to M t are initialized and the register data, localmemory, SIMT stack, and shared memory are restored for thecorresponding threads, warps and CTAs.70%60%50%40%30%20%10%0%MNISTFig. 6. Correlating execution time for MNIST.IV. C ORRELATIONDuring the process of updating GPGPU-Sim to run machine learning workloads (Section III), we also used a 32-bitfloating-point version of MNIST to correlate GPGPU-Sim’sexecution time with a GeForce GTX 1050. We use MNIST toperform the correlation because it is relatively simple and usesa wide variety of cuDNN layers such as LRN and Winograd.Additionally, MNIST contains self-checking code at the end ofthe application, which helps ensure the functional correctnessof our implementation.We correlated GPGPU-Sim’s performance with real GPUsby comparing the number of GPU cycles with those reportedby NVProf. Figures 6 and 7 show the overall correlation forMNIST and the correlation for select kernels, respectively.We selected these kernels because they show the largestdiscrepancies. For the kernels we do not show, GPGPU-Simachieves very high correlation with the real GPU. Overall,GPGPU-Sim provides a correlation of 72%. Inspecting theper-kernel results shows that the overall discrepancy is heavilyaffected by a few kernels such as CGEMM, Winograd, andLRN. Thus, improving support for these kernels will makethe overall correlation even better.A. Power ConsumptionFigure 8 breaks down MNIST’s power consumption into6 key categories: core, L1 cache, L2 cache, NOC, DRAM,and Idle. As expected for relatively computationally intensiveCNNs like MNIST, on average the core (in particular theALUs) consume 65% of the power. However, on averageIdle power consumes a further 25% of the total power.This represents a tuning opportunity for future architecturalexploration, which is enabled by this work.V. C ASE S TUDIESA. MethodologyIn this section, we study another simple cuDNN program from the NVIDIA examples, conv sample. We chooseconv sample because it performs forward, backward data,and backward filter convolutions, which are common machinelearning operations. Using conv sample, we iterated over
Hardware160SimulatorRelative Execution Time140120100806040200LRNCGEMMGEMV2TWinogradfft2d r2c 32x32 fft2d r2c 16x16 fft2d c2r 32x32Fig. 9. Forward Convolution (FFT) DRAM Efficiency PlotFig. 7. Select per-kernel, execution time correlation results for MNIST. Theseresults are a subset of the kernels in Figure 6.CoreL1 CacheL2 CacheNOCDRAMIdle10090Avg Power (W)8070605040302010Fig. 10. Forward Convolution (FFT) DRAM Utilization Plot0MNISTFig. 8. Average power consumption for a 32-bit floating-point version ofMNIST, subdivided into 6 components of the simulated GPU.the various cuDNN algorithms available for each type ofconvolution. For forward convolution, we ran FFT, FFT Tiling,GEMM, Implicit GEMM, Winograd, and Winograd Nonfused.For backward data convolution, we ran Algorithm 0, Algorithm 1, FFT Tiling, Winograd, and Winograd Nonfused. Forbackward filter convolution, we ran Algorithm 0, Algorithm 1,Algorithm 3, FFT, FFT Tiling,
source GPU architecture simulators such as GPGPU-Sim [3], [4] are unable to run applications that make use of these precompiled libraries. Indeed, we confirmed with the main-tainers of GPGPU-Sim that a key limitation of the currently available version of GPGPU-Sim is the lack of support for applications that use precompiled libraries. In this .