Transcription
LUDWIGMAXIMILIANSUNIVERSITÄTMÜNCHENINSTITUTE FORINFORMATICSDATABASESYSTEMSGROUP16th ACM SIGKDD Conference on Knowledge Discovery and Data MiningOutlier Detection TechniquesHans-Peter Kriegel, Peer Kröger, Arthur ZimekLudwig-Maximilians-Universität MünchenMunich, zimek}@dbs.ifi.lmu.deTutorial Notes: KDD 2010, Washington, D.C.
DATABASESYSTEMSGROUPGeneral Issues1. Please feel free to ask questions at any time during thepresentationt ti2. Aim of the tutorial: get the big picture– NOT in terms of a long list of methods and algorithms– BUT in terms of the basic approaches to modeling outliers– Sample algorithms for these basic approaches will be sketched The selection of the presented algorithms is somewhat arbitraryPlease don’tdon t mind if your favorite algorithm is missingAnyway you should be able to classify any other algorithm not coveredhere by means of which of the basic approaches is implemented3. The revised version of tutorial notes will soon be availableon our websitesKriegel/Kröger/Zimek: Outlier Detection Techniques (KDD 2010)2
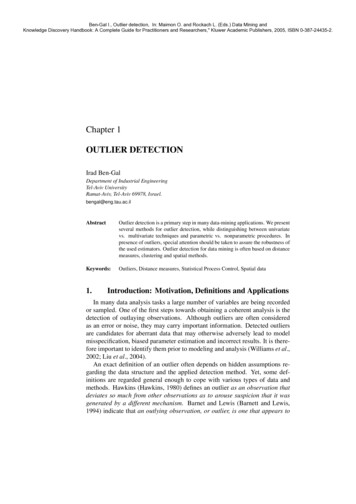
DATABASESYSTEMSGROUPIntroductionWhat is an outlier?Definition of Hawkins [Hawkins 1980]:“An outlier is an observation which deviates so much from the otherobservations as to arouse suspicions that it was generated by a differentmechanism”Statistics-based intuition– Normalo a data objects followo o a “generatingge e at g mechanism”,ec a s , ee.g.g sosomeegiven statistical process– Abnormal objects deviate from this generating mechanismKriegel/Kröger/Zimek: Outlier Detection Techniques (KDD 2010)3
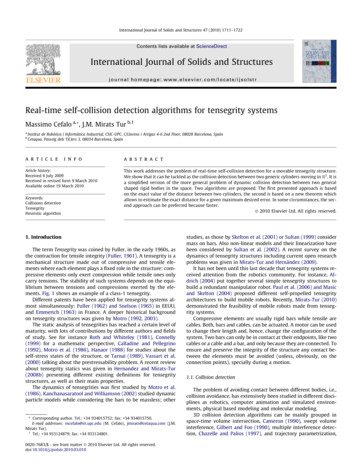
DATABASESYSTEMSGROUPIntroduction Example: Hadlum vsvs. Hadlum (1949) [Barnett 1978] The birth of a child to Mrs.Hadlum happened 349 daysafter Mr. Hadlum left formilitary service.service Average human gestationperiod is 280 days (40weeks). Statistically, 349 days is anoutlier.Kriegel/Kröger/Zimek: Outlier Detection Techniques (KDD 2010)4
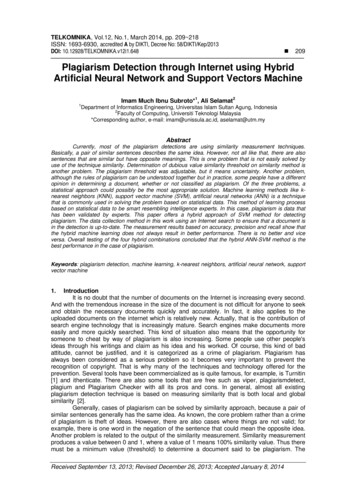
IntroductionDATABASESYSTEMSGROUP Example: Hadlum vsvs. Hadlum (1949) [Barnett 1978] blue: statistical basis (13634observations of gestation periods) green: assumed underlyingGaussian process Very low probability for the birth ofMrs. Hadlums child for beinggenerated by this process red: assumption of Mr. Hadlum(another Gaussian processresponsible for the observed birth,where the gestation period startslater) Under this assumptionass mption thegestation period has an averageduration and the specific birthdayhas highesthighest-possiblepossible probabilityKriegel/Kröger/Zimek: Outlier Detection Techniques (KDD 2010)5
DATABASESYSTEMSGROUPIntroduction Sample applications of outlier detection– Fraud detection Purchasing behavior of a credit card owner usually changes when thecard is stolen Abnormal buying patterns can characterize credit card abuse– Medicine Unusual symptoms or test results may indicate potential health problemsof a patient WhetherWh th a particularti l testt t resultlt isi abnormalbl may dependdd on otherthcharacteristics of the patients (e.g. gender, age, )– Public health The occurrence of a particular disease, e.g. tetanus, scattered acrossvarious hospitals of a city indicate problems with the correspondingvaccinationi ti program iin ththatt cityit Whether an occurrence is abnormal depends on different aspects likefrequency,qy, spatialpcorrelation,, etc.Kriegel/Kröger/Zimek: Outlier Detection Techniques (KDD 2010)6
DATABASESYSTEMSGROUPIntroduction Sample applications of outlier detection (cont.)– Sports statistics In many sports, various parameters are recorded for players in order toevaluate the players’players performances Outstanding (in a positive as well as a negative sense) players may beidentified as having abnormal parameter values Sometimes, players show abnormal values only on a subset or a specialcombination of the recorded parameters– Detecting measurement errors Data derived from sensors (e.g. in a given scientific experiment) maycontain measurement errors Abnormal values could provide an indication of a measurement error Removing such errors can be important in other data mining and dataanalysis tasks “One person‘s noise could be another person‘s signal.”– Kriegel/Kröger/Zimek: Outlier Detection Techniques (KDD 2010)7
DATABASESYSTEMSGROUPIntroduction Discussion of the basic intuition based on Hawkins– Data is usually multivariate,i.e., multi-dimensional basicb i modeld l iis univariate,i i ti.e., 1-dimensional– There is usually more than one generatingmechanism/statistical process underlyingthe “normal”normal data basic model assumes only one “normal”generating mechanism– Anomalies may represent a different class (generating mechanism) ofobjects,j, so there mayy be a largeg class of similar objectsjthat are theoutliers basic model assumes that outliers are rare observationsKriegel/Kröger/Zimek: Outlier Detection Techniques (KDD 2010)8
DATABASESYSTEMSGROUPIntroduction Consequences:– A lot of models and approaches have evolved in the past years inorder to exceed these assumptions– It is not easy to keep track with this evolution– New models often involve typical, sometimes new, though usuallyhidden assumptions and restrictionsKriegel/Kröger/Zimek: Outlier Detection Techniques (KDD 2010)9
DATABASESYSTEMSGROUPIntroduction General application scenarios– Supervised scenario In some applications, training data with normal and abnormal dataobjects are provided There may be multiple normal and/or abnormal classes Often, the classification problem is highly imbalanced– Semi-supervised Scenario In some applications, only training data for the normal class(es) (or onlyth abnormalthebl class(es))l( )) are providedid d– Unsupervised Scenario In most applications there are no training data available In this tutorialtutorial, we focus on the unsupervised scenarioKriegel/Kröger/Zimek: Outlier Detection Techniques (KDD 2010)10
DATABASESYSTEMSGROUPIntroduction Are outliers just a side product of some clusteringalgorithms?l ith ?– Many clustering algorithms do not assign all points to clusters butaccount for noise objects– Look for outliers by applying one of those algorithms and retrieve thenoise set– Problem: Clustering algorithms are optimized to find clusters rather than outliers Accuracy of outlier detection depends on how good the clusteringalgorithml ith capturestththe structuret toff clustersl t A set of many abnormal data objects that are similar to each other wouldgas a cluster rather than as noise/outliersbe recognizedKriegel/Kröger/Zimek: Outlier Detection Techniques (KDD 2010)11
DATABASESYSTEMSGROUPIntroduction We will focus on three different classification approaches– Global versus local outlier detectionConsiders the set of reference objects relative to which each point’soutlierness is judged“outlierness”– Labelingg versus scoringg outliersConsiders the output of an algorithm– Modeling propertiesConsiders the concepts based on which “outlierness” is modeledNOTE: we focus on models and methods for Euclidean data but manyof those can be also used for other data types (because they onlyrequire a distance measure)Kriegel/Kröger/Zimek: Outlier Detection Techniques (KDD 2010)12
DATABASESYSTEMSGROUPIntroduction Global versus local approaches– Considers the resolution of the reference set w.r.t. which the“outlierness” of a particular data object is determined– Global approaches The reference set contains all other data objectsas c assumption:assu pt o ttheree e issoonlyyoonee normalo a mechanismec a s Basic Basic problem: other outliers are also in the reference set and may falsifythe results– Local approaches The reference contains a (small) subset of data objects No assumption on the number of normal mechanisms Basic problem: how to choose a proper reference set– NOTE: Some approaches are somewhat in between The resolution of the reference set is varied e.g. from only a single object(local) to the entire database (global) automatically or by a user-definediinputt parametertKriegel/Kröger/Zimek: Outlier Detection Techniques (KDD 2010)13
DATABASESYSTEMSGROUPIntroduction Labeling versus scoring– Considers the output of an outlier detection algorithm– Labeling approaches BinaryBioutputt t Data objects are labeled either as normal or outlier– Scoring approaches Continuous outputjan outlier score is computedp((e.g.g the pprobabilityy for For each objectbeing an outlier) Data objects can be sorted according to their scores– NotesN t Many scoring approaches focus on determining the top-n outliers(parameter n is usually given by the user) Scoring approaches can usually also produce binary output if necessary(e.g. by defining a suitable threshold on the scoring values)Kriegel/Kröger/Zimek: Outlier Detection Techniques (KDD 2010)14
DATABASESYSTEMSGROUPIntroduction Approaches classified by the properties of the underlyingmodelingd li approachh– Model-based Approaches RationalR til– Apply a model to represent normal data points– Outliers are points that do not fit to that model Sample approaches––––Probabilistic tests based on statistical modelsD th bDepth-basedd approacheshDeviation-based approachesSome subspace outlier detection approachesKriegel/Kröger/Zimek: Outlier Detection Techniques (KDD 2010)15
DATABASESYSTEMSGROUPIntroduction– Proximity-based Approaches Rational– Examine the spatial proximity of each object in the data space– If the proximity of an object considerably deviates from the proximity of otherobjects it is considered an outlier Sample approaches– DistanceDistance-basedbased approaches– Density-based approaches– Some subspace outlier detection approaches– Angle-based approaches Rational– Examine the spectrum of pairwise angles between a given point and all otherpoints– Outliers are points that have a spectrum featuring high fluctuationKriegel/Kröger/Zimek: Outlier Detection Techniques (KDD 2010)16
duction Statistical TestsDepth-based ApproachesDeviation-based ApproachesDistance-basedDistancebased ApproachesDensity-based ApproachesHigh dimensional imek: Outlier Detection Techniques (KDD 2010)Model-basedProximity-basedAdaptation of different modelsto a special problem17
DATABASESYSTEMSGROUPStatistical Tests General idea– Given a certain kind of statistical distribution (e.g., Gaussian)– Compute the parameters assuming all data points have beengenerated by such a statistical distribution (e(e.g.,g mean and standarddeviation)– Outliers are points that have a low probability to be generated by theoverall distribution (e.g., deviate more than 3 times the standarddeviation from the mean)– See e.g. Barnett’s discussion of Hadlum vs. Hadlum Basic assumption– Normal data objects follow a (known) distribution and occur in a highprobability region of this model– Outliers deviate strongly from this distributionKriegel/Kröger/Zimek: Outlier Detection Techniques (KDD 2010)18
Statistical TestsDATABASESYSTEMSGROUP A huge number of different tests are available differing in– Type of data distribution (e.g. Gaussian)– Number of variables, i.e., dimensions of the data objects(univariate/multivariate)– Number of distributions (mixture models)– Parametric versus non-parametric (e(e.g.g histogram-based) Example on the following slides––––Gaussian distributionMultivariate1 modelParametricKriegel/Kröger/Zimek: Outlier Detection Techniques (KDD 2010)19
DATABASESYSTEMSGROUPStatistical Tests Probability density function of a multivariate normaldi t ib tidistributionN ( x) 1(2π )d Σ e( x μ ) T Σ 1 ( x μ ) 2– μ is the mean value of all points (usually data is normalized such thatμ 0)– Σ is the covariance matrix from the mean– MDist ( x, μ ) ( x μ ) T Σ 1 ( x μ ) is the Mahalanobis distance ofpoint x to μ– MDist follows a χ2-distribution with d degrees of freedom (d datadimensionality)– All points x, with MDist(x,μ) χ2(0,975)[ 3.σ]Kriegel/Kröger/Zimek: Outlier Detection Techniques (KDD 2010)20
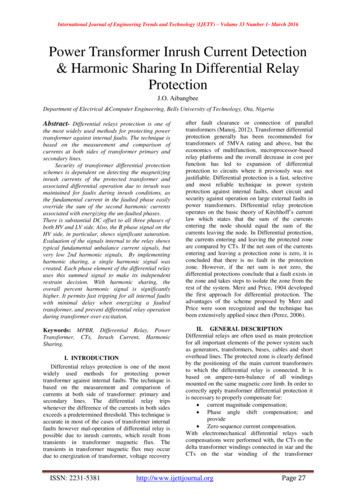
DATABASESYSTEMSGROUPStatistical Tests Visualization (2D) [Tan et al. 2006]Kriegel/Kröger/Zimek: Outlier Detection Techniques (KDD 2010)21
DATABASESYSTEMSGROUPStatistical Tests Problems– Curse of dimensionality The larger the degree of freedom, the more similar the MDist values forall pointsx-axis: observed MDist valuesy-axis: frequency of observationKriegel/Kröger/Zimek: Outlier Detection Techniques (KDD 2010)22
Statistical TestsDATABASESYSTEMSGROUP Problems (cont.)– Robustness Mean and standard deviation are very sensitive to outliers These values are computed for the complete data set (including potentialoutliers) The MDist is used to determine outliers although the MDist values areinfluenced by these outliers Minimum Covariance Determinant [Rousseeuw and Leroy 1987]minimizes the influence of outliers on the Mahalanobis distance Discussion––––DataDt didistributiont ib ti iis fifixeddLow flexibility (no mixture model)Global methodOutputs a label but can also output a scoreKriegel/Kröger/Zimek: Outlier Detection Techniques (KDD 2010)μDB23
duction Statistical Tests Depth-based ApproachesDeviation-based ApproachesDistance-basedDistancebased ApproachesDensity-based ApproachesHigh dimensional imek: Outlier Detection Techniques (KDD 2010)24
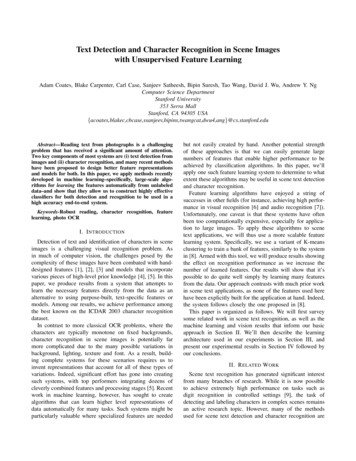
DATABASESYSTEMSGROUPDepth-based Approaches General idea– Search for outliers at the border ofthe data space but independent ofstatisticalt ti ti l didistributionst ib ti– Organize data objects inconvex hull layers– Outliers are objects on outer layers Basic assumptionPicture taken from [Johnson et al. 1998]– Outliers are located at the border of the data space– Normal objects are in the center of the data spaceKriegel/Kröger/Zimek: Outlier Detection Techniques (KDD 2010)25
DATABASESYSTEMSG
Please feel free to ask questions at any time during the presenttitation 2. Aim of the tutorial: get the big picture – NOT in terms of a long list of methods and algorithms – BUT in terms of the basic approaches to modeling outliers – Sample algorithms for these basic approaches will be sketched The selection of the presented algorithms is somewhat arbitrary Please donPlease don .