Transcription
SANDIA REPORTSAND2021-5919Printed May 2021Performance Metrics to EvaluateUtility Resilience InvestmentsDesigning Resilient Communities: AConsequence-Based Approach for GridInvestment Report SeriesSynapse Energy Economics:Jennifer KallayAlice NapoleonBen HavumakiJamie HallCaitlin OdomAsa Hopkins, PhDMelissa WhitedTim WoolfMax ChangSandia National Laboratories:Robert BroderickRobert Jeffers, PhDBrooke Marshall GarciaPrepared bySandia National LaboratoriesAlbuquerque, New Mexico87185 and Livermore,California 94550
Issued by Sandia National Laboratories, operated for the United States Department of Energy by NationalTechnology & Engineering Solutions of Sandia, LLC.NOTICE: This report was prepared as an account of work sponsored by an agency of the United StatesGovernment. Neither the United States Government, nor any agency thereof, nor any of their employees, nor any oftheir contractors, subcontractors, or their employees, make any warranty, express or implied, or assume any legalliability or responsibility for the accuracy, completeness, or usefulness of any information, apparatus, product, orprocess disclosed, or represent that its use would not infringe privately owned rights. Reference herein to any specificcommercial product, process, or service by trade name, trademark, manufacturer, or otherwise, does not necessarilyconstitute or imply its endorsement, recommendation, or favoring by the United States Government, any agencythereof, or any of their contractors or subcontractors. The views and opinions expressed herein do not necessarilystate or reflect those of the United States Government, any agency thereof, or any of their contractors.Printed in the United States of America. This report has been reproduced directly from the best available copy.Available to DOE and DOE contractors fromU.S. Department of EnergyOffice of Scientific and Technical InformationP.O. Box 62Oak Ridge, TN 37831Telephone:Facsimile:E-Mail:Online ordering:(865) 576-8401(865) hAvailable to the public fromU.S. Department of CommerceNational Technical Information Service5301 Shawnee RdAlexandria, VA 22312Telephone:Facsimile:E-Mail:Online order:(800) 553-6847(703) lp/order-methods/2
ABSTRACTIn 2019, Sandia National Laboratories (Sandia) contracted Synapse Energy Economics(Synapse) to research the integration of community and electric grid resilience investmentplanning. Synapse produced a series of reports to explore the challenges and opportunitiesin several key areas, including benefit-cost analysis, performance metrics, microgrids, andregulatory mechanisms. This report focuses on performance metrics. Performance metricsdefine the information that utilities, regulators, and other stakeholders can use to monitorand improve grid performance of resiliency investments.Electric grid resilience can be improved through investments, such as transmission anddistribution systems, generation, and automation and controls. However, the data to trackand report the performance of these grid resilience efforts are still in development. Todate, there is no industry consensus on the data to evaluate the performance ofinvestments intended to create a more resilient electric system. The purpose of this reportis to guide jurisdictions to take the important step of defining and establishingperformance metrics for resilience that are tailored to their needs and situation. First, weexplain the performance mechanism development process. Next, we describe sevenprinciples for developing well-designed performance metrics. Lastly, we provide a menuof performance metrics for grid resilience and discuss their applicability.Using these materials, jurisdictions can determine where they are in the process of definingand setting performance metrics, define next steps, and take action to improve theirunderstanding of current resilience performance and capture opportunities to improve.The menu of performance metrics for grid resilience described in this report is alsoprovided as an accompanying Excel-based tool which takes the form of a performancemetric reporting template. We encourage utilities to take the lead on collecting, organizing,and reporting this data to their regulators and stakeholders in public proceedings, withsupport from community and institutional partners.3
4
CONTENTSAbstract . 3Contents . 5List of Figures. 5List of Tables . 5Executive Summary . 7Acronyms and Definitions . 91. Introduction . 111.1. Purpose . 111.2. Report Organization . 122. Performance Mechanism Development Process . 133. Principles for Well-Designed Performance Metrics . 164. Proposed Resilience Performance Metrics . 184.1. Menu of Grid Resilience Performance Metrics . 194.2. Connection to the Principles . 285. Next Steps . 33References . 35Appendix A.ENERGY INVESTMENTS WITH RESILIENCE BENEFITS:PERFORMANCE METRICS REPORTING TOOL . 36A.1. Annual Performance Metrics, Event Level Reporting . 36A.2. Annual Performance Metrics, Customer Level Reporting . 37A.3. Annual Performance Metrics, System Level Reporting . 38A.4. Resilience Events Metrics, Event Level Reporting . 39A.5. Resilience Events Metrics, Customer Level Reporting . 40A.6. Resilience Events Metrics, System Level Reporting . 41A.7. Data Definitions. 42Distribution. 43LIST OF FIGURESFigure 1. Performance Mechanism Development Process.13Figure 2. Annual Performance Metrics, Event-Level Reporting .20Figure 3. Annual Performance Metrics, Customer-Level Reporting .21Figure 4. Annual Performance Metrics, System-Level Reporting .23Figure 5. Resilience Event Performance Metrics, Event-Level Reporting.25Figure 6. Resilience Event Performance Metrics, Customer-Level Reporting .26Figure 7. Resilience Event Performance Metrics, System-Level Reporting .27LIST OF TABLESTable 1. Principles for Well-Designed Performance Metrics , .17Table 2. Proposed Reporting Timing and Frequency .305
6
EXECUTIVE SUMMARYIn 2019, Sandia National Laboratories (Sandia) contracted Synapse Energy Economics (Synapse) toresearch the integration of community and electric utility resilience investment planning. 1 Theresearch was funded by the U.S. Department of Energy (DOE) and conducted as part of the GridModernization Laboratory Consortium (GMLC), under the project named Designing ResilientCommunities: A Consequence-Based Approach for Grid Investment (DRC).The primary objective of the DRC project is to understand and provide guidance on the challengesand opportunities facing communities and electric utilities seeking to coordinate energy-relatedresilience efforts. 2 The project seeks to demonstrate an actionable path toward designing resilientcommunities through consequence-based approaches to grid planning and investment, and throughfield validation of technologies with partners that enable distributed and clean resources to improvecommunity resilience. As part of the DRC project, Sandia is partnering with a variety ofgovernment, industry, and university partners to develop and test a framework for communityresilience planning focused on modernization of the electric grid.In support of DRC, Synapse produced a series of reports to explore challenges and opportunities inseveral key areas, including benefit-cost analysis, performance metrics, microgrids, and regulatorymechanisms. This report focuses on performance metrics. Performance metrics define theinformation that utilities, regulators, and other stakeholders can use to monitor grid performance ofresiliency investments. The purpose of this report is to guide jurisdictions to take the important stepof defining and establishing performance metrics for resilience. We do this by providing: A roadmap of the performance mechanism development process, which identifies and namesthe steps in the process, discusses the sequence of the steps, defines key terminology associatedwith each step, and categorizes the steps as necessary or optional; A list and discussion of seven principles for developing well-designed performance metrics; A menu of performance metrics for grid resilience and associated discussion, for considerationby utilities and their regulators; and An Excel based tool visualizing these performance metrics in the form of reporting templatesfor utilities to use to track their performance and provide ongoing updates to regulators andother stakeholders.In the benefit-cost analysis report, titled Application of a Standard Approach to Benefit-Cost Analysis forElectric Grid Resilience Investments, 3 we describe how regulators can direct utilities to take the lead oncollecting and organizing resilience data by establishing resilience performance metrics. In thatreport, some of these metrics are proposed to evaluate different resilience solutions as part ofbenefit-cost analysis. We suggest that utilities act as a central repository for the data and lead thereporting of the metrics. We acknowledge that utilities will not have access to all the data and willneed to partner with other stakeholders to obtain key pieces of data. We identify communities as aIn this research, municipal governments are considered communities due to their broad lens into local, public effortsand investments as well as their decision-making authority. Municipal governments include communities that are bothurban and rural and both large and small.2 Department of Energy. New GMLC Lab Call Awards for Resilient Distribution Systems. September 4, 2017. Available ll-awards-resilient-distribution-systems.3 Sandia National Laboratories. Application of a Standard Approach to Benefit-Cost Analysis for Electric Grid Resilience Investments.Executive Summary. Figure 1.17
key data source and propose that communities provide existing data to utilities directly. We alsoidentify the need for utilities, communities, and other stakeholders such as research institutions toconduct research and analysis to address additional data and capability gaps.There is no established set of standard performance metrics for resilience, and many of the metricsthat have been proposed in the literature require extensive data, modeling, and analysis. The menuof metrics contained in this report, and included in the attached Excel-based tool, is intended toprovide a starting point for utilities, regulators, and stakeholders to develop metrics that are tailoredto the needs and data available in a given jurisdiction, and which can be quantified with reasonableeffort. Because these metrics are achievable, they may serve as a bridge between today’s state-of-theart for resilience quantification and a more optimal ideal proposed by the literature. These metricsfocus on annual event-level, customer-level, and system-level performance, while also breaking outperformance into important customer and geographic subsegments.Once roles and responsibilities for developing resilience performance metrics are established, theutilities responsible for leading the effort can propose resilience performance metrics to theirregulators.1. Regulators and utilities can start by holding a technical session to review the suggestions inthe Excel-based tool and identify resilience performance metrics of interest.2. Once a regulator approves the utilities’ proposed resilience performance metric reportingtemplate, utilities can populate the metrics using actual data and review the calculations andoutputs with regulators and other stakeholders at a second technical session.3. Utilities can formally file baseline performance metrics in the proceeding of their regulators’choosing and with a frequency that makes sense for that jurisdiction.4. Once the baseline data is established, the utility, regulator and other stakeholders can worktogether to identify performance metrics that need improvement and discuss the level ofimprovement desired.5. Utilities can explore many investment options to achieve the goals. Utilities can offerprograms to promote customer implementation of measures that achieve the desiredimprovement. Utilities can also implement measures directly to achieve the desired levels ofimprovement. Utility investment proposals should identify the resilience performancemetrics of interest and the impacts of the potential investments on the resilienceperformance metrics.6. After utilities select investments to pursue and implement the measures, resilienceperformance metrics can demonstrate the impact of the investments.Ongoing review and update of the performance metrics can document progress, allow foradjustments, and identify new opportunities over time. The extent of beneficial impacts can taketime – potentially many decades – and therefore this process may require longer time frames thantypical for other investments.8
ACRONYMS AND DEFINITIONSAcronym or TermDefinitionIEEEInstitute of Electrical and Electronics EngineersAll daysIncludes major and resilience event daysBaseline periodThe time period over which data such as the utility’s past performance, theperformance of peer utilities, or other indicators of desirable performance levelsis collected and used for context and comparison with data from the reportingperiod.BTMBehind-the-meter. On the customer-owned portion of the grid.CAIDICustomer Average Interruption Duration Index. A measure of the duration andfrequency of electric grid outages calculated by dividing the total duration ofcustomer interruptions by the total number of customers interrupted.CAIFICustomer Average Interruption Frequency Index. A measure used in electricalreliability analysis. It is designed to show trends in customers interrupted andhelps to show the number of customers affected out of the whole customerbase.Critical customersCustomers who are prioritized for restoration.Critical communityservicesCustomers that provide a critical, or life-sustaining, good or service that isaccessible to others.Critical individualservicesCritical customers that do not provide a community service, such as vulnerableresidential customers who require additional individual attention due to higherhealth risks or lower mobility.Exogenous factorsOutcomes over which the utility has little to no control.High consequencegeographiesContiguous and non-contiguous geographies, such as communities or portionsof communities across states and larger utility service territories, with a highlevel of expected consequence from threats or events.Medium consequencegeographiesContiguous and non-contiguous geographies, such as communities or portionsof communities across states and larger utility service territories, with a mediumlevel of expected consequence.FOMFront-of-meter. On the utility-owned portion of the grid.Functioning islandableresourcesIslandable resources that offer any relief during an event.Islandable resourcesThe ability to disconnect a resource from the local utility grid and use theresource to power local load.Major event daysAs defined by IEEE Major Event Standard 1366, a day in which the daily SAIDIexceeds a threshold value, TMED which is calculated as 2.5 standarddeviations higher than the statistical mean SAIDI for days with any interruptionsin the past five years.Maximum affectedThe highest number affected at any point during an event.Normal event daysDays in which the electric utility grid does not experience disruptions fromthreats.Performance areasGoals that can be addressed through utility investments in electric gridimprovements.9
Acronym or cial motivators that might be needed in specific instances, such as tocorrect an especially strong utility financial disincentive to achieve someperformance targets.Performance metricsMetrics define the information that utilities, regulators, and other stakeholderscan use to monitor grid performance.PerformancestandardsMinimum performance requirements that set baselines for acceptableperformance.Performance targetsDesired levels of performance outcomes that exceed minimum performancestandards.Post resilience eventdaysA multiyear period after event, similar in duration to the pre resilience eventdays period. For this report we assumed 5 years.Pre resilience eventdaysA relatively recent, multiyear period prior to the event. For this report weassumed 5 years.ResilienceThe ability to prepare for and adapt to changing conditions and withstand andrecover rapidly from disruptions 4Resilience eventA subset of events defined by Institute of Electrical and Electronics Engineers(IEEE’s) Major Event Standard 1366 that have a lower probability of occurring,but are longer-lasting, higher-consequence and more spatially widespreadwhen they occur.Resilience event daysThe period over which outages are occurring and caused by the sameunderlying threat or event.Reporting PeriodThe time period over which utility performance data is collected and comparedwith data from the baseline period.SAIDISystem Average Interruption Duration Index. A measure of the duration ofelectric grid outages calculated by dividing the total duration of customerinterruptions by the total number of customers served.SAIFISystem Average Interruption Frequency Index. A measure of the frequency ofelectric grid outages calculated by dividing the total number of customerinterruptions by the total number of customers served.4 U.S. Office of the Press Secretary. Presidential Policy Directive/PPD-21 -- Critical Infrastructure Security and Resilience. February12, 2013. Available at: al-infrastructure-security-and-resil.10
1.INTRODUCTION1.1.PurposeThe increase in the frequency and severity of natural disasters and the increased risk of cybersecuritybreaches is driving broad interest in energy investments with resilience benefits. Electric gridresilience can be improved by investments in the transmission and distribution systems, generation,automation and controls, and cross-cutting measures such as planning, training, microgrids, andperformance measurement and evaluation. Resilience events can be caused by physical,climatological, and man-made hazards. However, the data to track and report the performance ofthese grid resilience efforts are still in development. To date, there is no industry consensus on thedata to evaluate the performance of investments intended to create a more resilient electric system.The purpose of this report is to guide jurisdictions to take the important step of defining andestablishing performance metrics for resilience. The report provides several essential pieces ofcontent:1. a visualization and explanation of a performance mechanism development process;2. a list and details of seven principles for developing well-designed performance metrics;3. a menu of performance metrics for grid resilience; and4. an Excel-based tool to organize the calculation and reporting process.The accompanying Excel-based tool takes the form of a performance metric reporting template. Weintend for utilities to complete this reporting template and provide it to their regulators andstakeholders in public proceedings. The tool contains three sections. The first section (AnnualPerformance Metrics) provides a suite of resilience performance metrics for annual review. Thesecond section (Resilience Event Performance Metrics) provides a suite of performance metrics forreview of each resilience event in the year when it occurs, and in the years directly following eachevent. A resilience event is a subset of events defined by Institute of Electrical and ElectronicsEngineers (IEEE’s) Major Event Standard 1366, that have a lower probability of occurring, but arelonger-lasting, higher-consequence and more spatially widespread when they occur. 5 We alsoprovide a Data Definitions section to explain the terminology that appears in the template.We suggest many metrics that can be produced immediately, and some more challenging ones forCompleting this template and reporting its contents is intended to be an exercise, not an endpoint.utilities and communities to work towards over the years to come. Some of the more detailedcustomer, temporal, and geographical segmentation we propose will need to be defined, and thedefinitions documented, before calculations can begin. A few of these metrics may require dataabout customer-sited equipment that is not tracked by utilities today. Though this data may not havebeen provided previously, we believe it is worthwhile for utilities, regulators, and stakeholders towork together to produce it. Completing this template and reporting its contents is intended to bean exercise, not an endpoint.IEEE Guide for Electric Power Distribution Reliability Indices," in IEEE Std 1366-2012 (Revision of IEEE Std 13662003) , vol., no., pp.1-43, 31 May 2012, doi: 10.1109/IEEESTD.2012.6209381.511
1.2.Report OrganizationThe remainder of this report is organized as follows: Section 2 lays out a performance mechanism development process; Section 3 describes seven principles for well-designed performance metrics; Section 4 proposes a menu of grid resilience performance metrics and discusses how theymeet the principles described in Section 3; and, Section 5 discusses next steps.An Excel-based tool with the proposed performance metric reporting templates accompanies thisreport.12
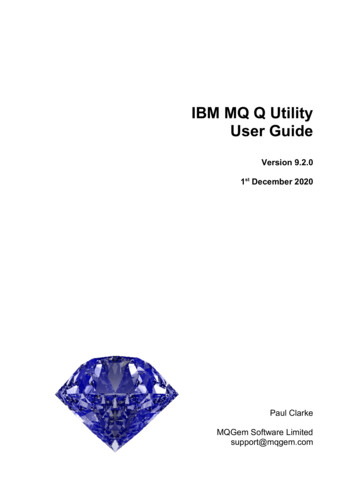
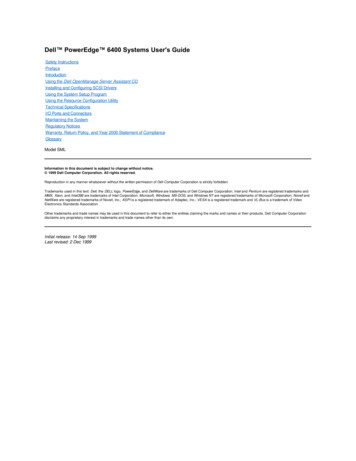
2.PERFORMANCE MECHANISM DEVELOPMENT PROCESSPerformance metrics are one step in a performance mechanism development process to monitorand improve performance in areas of interest. Understanding the steps in this process is critical tounderstanding progress to date, next steps, and future opportunities. The figure below provides anillustration of the process described in more detail in the section that follows.Figure 1. Performance Mechanism Development Process13
There are four steps in the performance mechanism development process. The steps are intended tobe followed in sequence and the process is iterative to ensure continued relevance and applicability.The first step is identifying and prioritizing performance areas. Performance areas can beaddressed through utility investments in electric grid improvements.For this report, we focus on resilience performance areas such as: avoiding or reducing consequences to key electric infrastructure; avoiding or reducing consequences to priority customers; avoiding or reducing consequences in key geographic areas.Improvements to each performance area can reduce economic, social, and/or national securityconsequences. For example, eliminating or lessening utility electric infrastructure damages canreduce the resilience event recovery costs for ratepayers. Targeting resilience investments to certaincustomers or geographies with a greater need for these services can decrease the consequence ofoutages from economic, social and national security perspectives.Performance areas should be clearly documented in Step 1 and referenced in discussions in Step 2.After performance areas are identified andprioritized, performance metrics shouldbe developed in the second step toaddress the performance areas. Metricsdefine the information that utilities,regulators, and other stakeholders can useto monitor grid performance.Metrics define the information that utilities, regulators, andother stakeholders can use to monitor grid performance.Monitoring performance can be simple. For example, it can be simple to publicly report existingdata that is already collected and used internally. Also, it may not be too difficult to aggregate ordisaggregate existing data and develop new calculations based on this data. However, in some cases,the utility may need to track new data and new data sets can take more time and effort to build. Ifthe data are new, it should be noted, but should not impede the identification of this data. Also, atthis point in the process, there may be uncertainty as to whether the data will be useful. This shouldalso not impede the identification of this data as Step 3 provides the opportunity to remove, change,or add metrics as utilities, regulators, and other stakeholders increase their knowledge andexperience.During Step 3, performance data is collected, and metrics populated and reviewed. Stakeholdersalso tackle the important task of setting baselines. Baselines are data used on a going-forward basisfor context and comparison. They can be based on the utility’s past performance 6, the performanceof peer utilities, or other indicators of desirable performance levels. Baselines are useful forunderstanding and evaluating fluctuations in the data over time. Stakeholders can use this data todetermine if the observed fluctuations are acceptable, or if changes are desired or necessary. The actof illustrating and discussing the metrics and baselines among stakeholders can drive improvementsthrough coordination and collaboration. In many cases this is enough to improve performance.It may also be worthwhile for utilities to provide resilience event reporting for resilience events that happened in therecent past.614
The act of illustrating and discussing the metrics and baselines can drive improvements through coordination andcollaboration. In many cases this is enough to improve performance.In some cases, the level of desired improvement cannot be reached without additional regulatoryguidance. Step 4, an optional step, offers several additional mechanisms to encourage improvedutility performance. First, performance standards can be established to set baselines for acceptableperformance. Performance standards are minimum performance requirements. Today,NERC requirements exist that provide for transmission system resilience, so we recommendthis process focus on setting requirements for distribution system resilience as the scope isvery different. However, it is important to keep the transmission system resilience standardsin mind as distribution system resilience standards are developed so the standards are wellcoordinated and reinforce one another. The process can stop after standards are set, or theprocess can continue to the next step. Next, performance targets can be established in specific instances, such as to encourageutilities to attain higher performance levels in priority areas. Performance targets are desiredlevels of performance outcomes that exceed minimum performance standards. The processcan stop after targets are set, or the process can continue to the next step. Lastly, performance incentives and/or penalties can be established in specific instances,such as to correct an especially strong utility financial disincentive to achieve a target.Performance incentives and/or penalties a
the Excel-based tool and identify resilience performance metrics of interest. 2. Once a regulator approves the utilities' proposed resilience performance metric reporting template, utilities can populate the metrics using actual data and review the calculations and outputs with regulators and other stakeholders at a second technical session. 3.