Transcription
QJDalladFort Worth International AirportPerimeter TaxiwayDemonstrationKaren BuondonnoKimberlea PriceJuly 2003Document is available to the publicthrough the National Technical InformationService, Springfield, Virginia 22161U .S. Department of TransportationFederal Aviation Administrationa,William J. Hughes Technical CenterAtlantic City InternationalAirport, NJ 08405
NOTICEThis document is disseminated under thesponsorship of the U.S. Department ofTransportation in the interest of informationexchange. The United States Governmentassumes no liability for the contents or usethereof.The United States Governmentdoes not endorse products or manufacturers.Trade or manufacturers’ names appearherein solely because they are consideredessential to the objective of this report. Thisdocument doesnot constitute FAAcertification policy.
Technical Report Documentation Page2. Government Accession No.1. Report No.3. Recipient’s Catalog No.DOT/FAA/CT-TN03/194. Title and Subtitle5. Report DateDallas/Fort Worth International Airport Perimeter Taxiway DemonstrationJuly 20036. Performing Organization CodeACB-3307.8. Performing Organization Report No.Author(s)DOT/FAA/CT-TN03/19Karen Buondonno and Kimberlea Price, ACB-3309. Performing Organization Name and Address10. Work Unit No. (TRAIS)Federal Aviation AdministrationWilliam J. Hughes Technical CenterAtlantic City International Airport, NJ 0840511. Contract or Grant No.12. Sponsoring Agency Name and Address13. Type of Report and Period CoveredFederal Aviation AdministrationSouthwest Region Charter Program Office, ASC-1C2601 Meacham BoulevardFort Worth, Texas 76137-4298Technical Note14. Sponsoring Agency CodeASC-1C, ASC-100, and DFWFederal Aviation AdministrationOffice of System Capacity, ASC-100800 Independence Ave., S.W.Washington, DC 2059115. Supplementary NotesCo-sponsor: DFW International Airport, 3122 E. 30th Street, DFW Airport, TX 75261-942816. AbstractCurrently, the Dallas/Fort Worth International Airport (DFW) experiences about 1,700 runway crossings per day, which contribute toarrival and departure delays and the potential for runway incursions. In an effort to enhance DFW operations, a perimeter taxiway (PT)concept was proposed that included new PTs on the East and West sides of the airport. DFW, the Federal Aviation Administration, andthe National Aeronautics and Space Administration (NASA) conducted a real-time human-in-the-loop simulation that demonstrated theeffect of adding new PTs to DFW. The demonstration was conducted in February 2003 at the NASA Ames Research Center (ARC).The primary objective was to provide the airlines, air traffic controllers, pilots, and their associated unions the opportunity to observeand participate in a demonstration of the proposed airport improvements at high fidelity levels with the goal of gaining their acceptanceof PTs. The secondary objective was to collect and analyze operational data to derive descriptive statistics. NASA ARC facilities wereused to simulate DFW tower and flight deck operations. The simulators were integrated and ran simultaneously for all runs during 4days of demonstration. Five Certified Professional Controllers from DFW and seven representatives from the airlines participated.Two taxiway configurations were simulated to represent the current DFW configuration and the proposed configuration with the newPTs. All controller and pilot participants agreed the demonstration was a good representation of operations at DFW and the proposednew taxiways. Overall, the data collected from the participants and the simulators demonstrated that the PTs would improve operationsat DFW, if implemented. Improvements were observed in many areas including average departure rates, average outbound taxiduration and associated runway occupancy times, average inbound and outbound stop rates and duration times, the number of runwaycrossings, and the amount of controller and pilot communications.17. Key Words18. Distribution StatementDFW, Perimeter Taxiways, DAPT Demonstration, Virtual RealityDemonstration, Real-Time SimulationThis document is available to the public throughthe National Technical Information Service,Springfield, Virginia, 2216119. Security Classif. (of this report)20. Security Classif. (of this page)21. No. of PagesUnclassifiedForm DOT F 1700.7 (8-72)Unclassified60Reproduction of completed page authorized22. Price
AcknowledgmentsThe authors wish to acknowledge several people who contributed their expert talent and manylong hours to this endeavor. Without their hard work and outstanding support, thisdemonstration would not have been a success.DFW - Larry Bauman, Jim Crites, Ken Capps, Victor Nartz, Star Ormand, Allen ParraDFW Tower/TRACON - Greg Juro, Mark Mulder, Dean Paxton, Phil RussellFAA ASC - Frank SoloninkaFAA ASW - Rick Compton, Paul Erway, Ronnie UhlenhakerFAA ACB - Jerry HadleyNASA ARC - Dave Astill, Debbie Ballinger, Nancy Dorighi, Marlene Hooten, Jerry Jones, MikeMadson, Boris Rabin, Terry Rager, Cedric WalkerNorthrup Grumman - Dave Brown, Diane Carpenter, Bob Cornell, Doug Ernest, Jim Gibson,Claudine Herbelin, Jim Miller, Chris Murphy, Charlie Ross, Ghislain Saillant, Nancy Tucker,Rob VossWe would also like to thank the following organizations for their support and participation:DFW ATCT controllers, FAA Flight Standards Service (AFS), FAA Office of Runway Safety(ARI), the Airline Pilots Association (ALPA), the Allied Pilots Association (APA), AmericanAirlines, American Eagle Airlines, Atlantic Southeast Airlines, Comair, Delta Airlines, andUnited Parcel Service Airlines.iii
iv
Table of ContentsPageAcknowledgments. iiiExecutive Summary . ix1. Introduction. 11.1 Background . 11.2 Objectives . 32. Method . 42.1 Limitations and Constraints . 73. Results. 93.1 Subjective Data . 93.1.1 ATC Results. 103.1.2 Pilot Results . 233.2 Subjective Results Summary . 283.3 Objective Data . 293.3.1 Arrival and Departure Data. 293.3.2 Communications Data. 353.3.3 Communications Summary. 463.4 Objective Results Summary. 464. Conclusion . 475. Experiment Working Group Observations . 47Acronyms. 49v
List of IllustrationsFiguresPageFigure 1. DFW current configuration. . 2Figure 2. DFW with proposed PTs. . 3Figure 3. PT arrivals standard taxi routes. . 6Figure 4. PT departures standard taxi route. . 7Figure 5. Q1- Rate your ability to move aircraft “to and from the runways” during this run. . 11Figure 6. Q2- Rate your overall level of situation awareness during this run. . 12Figure 7. Q3- Rate your situation awareness for current aircraft locations during this run. . 12Figure 8. Q4- Rate your situation awareness for projected aircraft locations during this run. 13Figure 9. Q5- How much coordination was required with other controllers during this run?. 13Figure 10. Q6- Rate the difficulty of this run. . 14Figure 11. Q7- What was the level of traffic complexity under your control during this run? . 15Figure 12. Q8- How would you rate the overall level of efficiency of this operation? . 16Figure 13. Q9- Rate the performance of the pseudo-pilots in terms of their responding to yourcontrol instructions, providing readbacks, etc. . 16Figure 14. Q1-. What effect, if any, did the new PTs have on the amount of frequencycommunications? . 18Figure 15. Q2- Did your communication strategies change when you were able to utilize thePTs?. 18Figure 16. Q3- What effect, if any, did the PTs have on your control strategies?. 19Figure 17. Q4- Based upon your experience in the demonstration, do you feel that adding thePTs improves operations at DFW? . 20Figure 18. Q5- Rate the realism of the overall demonstration experience compared to actualATC operations. 21Figure 19. Q6- Rate the realism of the simulated hardware compared to actual equipment. . 21Figure 20. Q7- Rate the realism of the simulated software compared to actual functionality. . 22Figure 21. Q8- Rate the realism of the simulated traffic runs compared to actual NAS traffic. . 22Figure 22. Q9- Rate the realism of the simulated airport compared to the actual airport . 23Figure 23. Q1- Based on your experience in the demonstration, do you feel that adding the PTsimproves operations at DFW? . 25Figure 24. Q2- Rate the realism of the overall demonstration experience compared to actualoperations. 26Figure 25. Q3- Rate the realism of the simulated hardware compared to actual equipment. 26Figure 26. Q4- Rate the realism of the simulated software compared to actual functionality. . 27vi
Figure 27. Q5- Rate the realism of the simulated traffic runs compared to actual NAS traffic. . 27Figure 28. Q6- Rate the realism of the simulated airport compared to the actual airport. . 28Figure 29. Overall departure rates. . 30Figure 30. 13L departure rates. . 31Figure 31. 17R departure rates. 31Figure 32. LE1 frequency transmissions per hour. . 40Figure 33. LE1 frequency time spent talking. 41Figure 34. LE1 frequency length of transmissions. . 42Figure 35. LE1 frequency time between transmission starts. . 43Figure 36. LE1 frequency number of words per hour. . 43Figure 37. LE1 frequency number of words per transmission. 44Figure 38. LE1 frequency speed of speech. 45TablesPageTable 1. Summary of the Demonstration Design. 4Table 2. Summary of Runs . 9Table 3. ATC Post-Run Questionnaire Summary. 10Table 4. ATC Post Demonstration Questionnaire Summary. 17Table 5. Pilot End of Day Questionnaire Summary . 25Table 6. Objective Data . 29Table 7. Arrivals and Departures that Crossed to/from the West-side . 30Table 8. BL Arrival/Departure Data in 10-Minute Increments . 32Table 9. PT Arrival/Departure Data in 10-Minute Increments. 32Table 10. Description of Inbound Taxi Duration. 32Table 11. Inbound Taxi Duration. 33Table 12. Description of Outbound Taxi Duration. 33Table 13. Outbound Taxi Duration and Departure Runway Occupancy Data . 34Table 14. Aircraft Stop Rates and Duration. 35Table 15. Baseline Runway Crossing Data. 35Table 16. Positions and Frequencies. 36Table 17. Summary of Communication Results (Controllers and Pilots Combined). 37Table 18. Summary of Communication Results for Controllers (only). 38Table 19. Summary of Communication Results for Pilots (only) . 39vii
viii
Executive SummaryCurrently, the Dallas/Fort Worth International Airport (DFW) typically experiences about 1,700runway crossings per day, which contribute to arrival and departure delays and the potential forrunway incursions. In an effort to enhance DFW operations, a perimeter taxiway (PT) conceptwas proposed that would include new PTs on the East and West sides of the airport. Many fasttime simulations and paper studies have been conducted that support the cost benefit, efficiency,and safety aspects of the proposed airport improvements. However, prior to the Dallas/FortWorth International Airport Perimeter Taxiway (DAPT) Demonstration, the improvements hadnot been observed or assessed in an operational setting using high fidelity simulation with humanoperators. Therefore, a partnership effort involving DFW, the Federal Aviation Administration(FAA), and the National Aeronautics and Space Administration (NASA) was formed to conducta real-time human-in-the-loop simulation that demonstrated the effect of adding new PTs toDFW. The DAPT Demonstration was conducted in February 2003, at the NASA AmesResearch Center (ARC) in Moffett Field, California. The FAA William J. Hughes TechnicalCenter acted as Principal Investigator and provided support for the research team.The primary objective of this endeavor was to provide the airlines, air traffic controllers, pilots,and their associated unions (i.e., the National Air Traffic Controllers Association, Airline PilotsAssociations, and Allied Pilots Association) the opportunity to observe and participate in ademonstration of the proposed airport improvements at high fidelity levels with the goal ofgaining their acceptance of PTs. In particular, there were four “views” of special interest for thedemonstration 1) the controller view, 2) the pilot-on-taxi view, 3) the pilot-on-arrival view, and4) the pilot-on-departure view. The secondary objective was to collect and analyze operationaldata for the purpose of deriving descriptive statistics for runway crossings, taxi times, and pilotand controller transmissions.NASA ARC’s FutureFlight Central (FFC) Facility and Crew Vehicle Systems Research Facility(CVSRF) were used to simulate DFW tower operations and flight deck operations respectively,at high fidelity levels. FFC and CVSRF were integrated and ran simultaneously for all runs.There were 4 days of demonstrations (including training). East-side, South flow, day time trafficoperations at DFW were simulated. Traffic scenarios were created using DFW operations datamodified as needed to create future demand levels and the desired traffic mix.Five Certified Professional Controllers from DFW staffed the FFC simulator. Two taxiwayconfigurations were simulated during 13 runs. The Baseline (BL) condition represented currentDFW configuration, whereas the PT condition included the proposed new PTs, the extension ofRunways 17C, and a new high speed exit on 17C (exiting to the East).One staff pilot and seven representatives from the airlines flew the Boeing 747-400 flightsimulator. The participating pilots engaged in at least 1 of the 4 days of the demonstration.Pilots were encouraged to experience all “views” defined in the objective of the demonstration,in addition to certain predefined typical views.Controller and pilot subjective ratings, objective data captured from the simulators, andcommunications data were obtained throughout the demonstration. The objective data capturedincluded taxi time durations, various arrival and departure data, runway occupancy times,inbound and outbound taxi statistics, runway crossing data, and pilot and controllercommunications data.ix
In general, the subjective and objective data demonstrated that the PTs would improve operationsat DFW, if implemented. The results revealed many interesting distinctions between the BL andPT conditions. However, because this was a demonstration, it is imperative to recognize that allresults should be used and interpreted with caution.All controller and pilot participants agreed the demonstration was a good representation ofoperations at DFW and the proposed new taxiways, and all perceived a marked improvementfrom BL to PT conditions. The participating controllers believed that the implementation of PTsin the demonstration enabled an overall more efficient operation. They felt the PTs provided fora smoother flow of traffic, afforded better ability to move aircraft to and from the runways,improved situation awareness, and decreased workload demands. Pilot participants thought thePTs improved efficiency and increased safety by reducing the potential for runway incursions.They also speculated that PTs would improve airline performance rates and reduce both pilot andcontroller workload due to less frequency congestion and a reduction in hold-short instructions.The objective data resulting from the demonstration supported the participants’ verbalcomments. Both indicated that the PTs would improve operations at DFW if implemented.Arrival rates for the BL and PT conditions remained consistent (by design), but there was asubstantial increase in the departure rate per hour for the PT condition. The average inbound taxiduration increased in the PT condition. However, the average outbound taxi duration andassociated runway occupancy times showed improvements with PTs compared to BL runs, as didinbound and outbound stop rates and duration times. Furthermore, by design, PTs completelyeliminated runway crossings at DFW in the demonstration.Controller and pilot communications for the most critical frequency were clearly reduced withthe addition of PTs. On the Local East 1 (LE1) frequency, significantly fewer transmissionswere made (22% relative reduction) with fewer words spoken (27% relative reduction). Thisresulted in the controllers and pilots spending less time on frequency (24% relative reduction)when compared to BL runs. Words were also spoken slightly slower on average during PT runs.In addition to being operationally relevant, these results were also statistically significant for theLE1 frequency. Such findings were consistent with controller debrief comments; controllers feltthat the volume of communications was significantly reduced and that they used less verbiagebecause concerns about crossings and reliance on pilot readbacks were alleviated. Many of thepositive data results were also apparent in the findings of the other frequencies, but generally to alesser degree.Based on the results of the data collected from the demonstration, it was clear that all objectivesof the exercise were met successfully. The controllers and pilots were afforded the opportunityto observe and experience the proposed airport improvements with realism and high fidelity, anda considerable amount of valuable data was available for analysis and is presented in this report.x
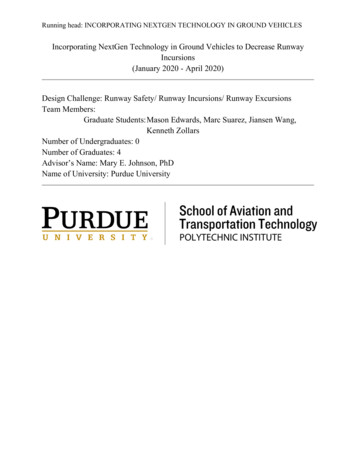
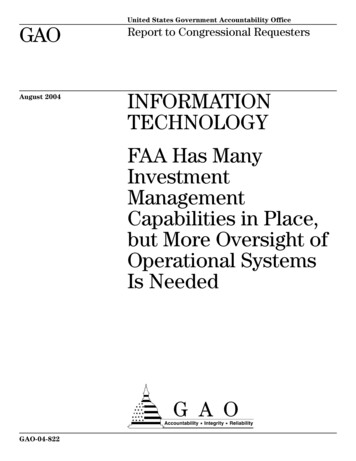
1. IntroductionThis report describes the results of a real-time human-in-the-loop (HITL) simulation thatdemonstrated the effect of adding new perimeter taxiways to the Dallas/Fort Worth InternationalAirport (DFW). The Dallas/Fort Worth International Airport Perimeter Taxiway (DAPT)Demonstration was a partnership effort involving DFW, the Federal Aviation Administration(FAA), and the National Aeronautics and Space Administration (NASA). The DAPTDemonstration was conducted February 10-13, 2003, at the NASA Ames Research Center(ARC) in Moffett Field, California. The data presented in this report are results from controllerand pilot subjective ratings, objective data captured from the simulators, and communicationsdata.This research endeavor was primarily designed to be a demonstration and was not focused onproviding data with high fidelity or statistical rigor (i.e., there is limited power for the use ofstatistical data analysis). The data provide a snapshot of the impact of the proposed DFWperimeter taxiway (PT) operation with human operators (i.e., controllers and pilots) included. Itis acknowledged that the data sample is small, participants were limited, and the runs were ofvariable length. Due to the variable run lengths, objective data were often converted to hourlyrates. Inferential statistics were used as appropriate. For most of the data, however, inspectionof descriptive statistics (e.g., frequencies, medians, and means) was used as the primary methodfor evaluation.Because this was a demonstration, it is imperative that all results presented are to be used andinterpreted with great caution. Results should not be generalized or accepted as conclusive.In addition to this report, an informational video of the demonstration and proposed airportimprovements was developed and will be shared with the National Air Traffic ControllersAssociation (NATCA), International Civil Aviation Organization (ICAO), National Academy ofSciences, International Council of Airports, Airline Pilots Associations (ALPA), the Allied PilotsAssociation (APA), and others. The video can be obtained by contacting DFW(perimetertaxiways@dfwairport.com).1.1 BackgroundCurrently DFW typically experiences approximately 1,700 runway crossings per day. Theexisting configuration at DFW requires that aircraft arriving on the East-side Runway 17C-35Ccross the departure Runway 17R-35L, and aircraft arriving on 17L-35R cross both the arrivalRunway 17C-35C and the departure Runway 17R-35L. The aircraft arriving on Runway 31Rmust also cross both Runways 35C and 35L. Similarly, the aircraft arriving on the West-sideRunway 13R must cross both the arrival Runway 18R-36L and the departure Runway 18L-36R,and aircraft arriving on 18R-36L must cross the departure Runway 18L-36R. Figure 1 depictsthe DFW runways, terminals, three control towers, and existing taxiways and bridges.1
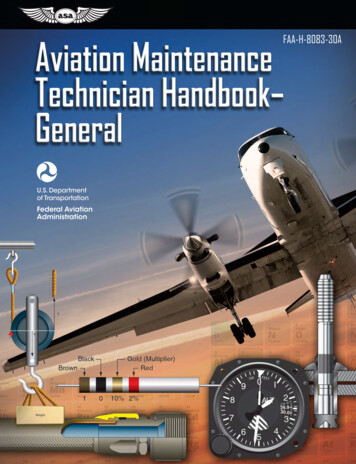
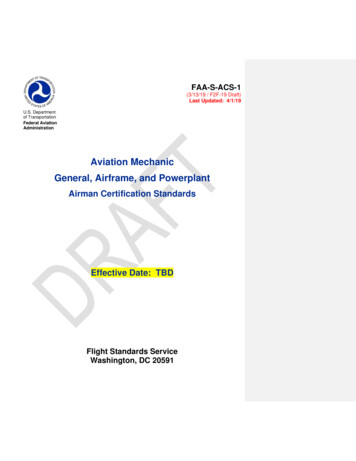
Figure 1. DFW current configuration.Under current operations, the local controller must conduct all runway crossings before theaircraft can be released to the ground controller. This situation increases the local controller’sworkload in meeting airport demand mainly due to frequency congestion and challenges thelocal controller to fully utilize the available runways. During major arrival and/or departurepushes, tradeoffs are sometimes made to safely balance all operations. When the local controllermaintains the airport departure demand, runway crossings for arriving aircraft can be delayeddue to having to cross the departure runway. Similarly, when arrivals stack up at the variousrunway-crossing points forcing the local controller to meet this demand, departures are ‘gapped’to accommodate these crossings. These situations are most evident during the peak traffic times.In an effort to reduce arrival and departure delays and the number of active runway crossings(with the added benefit of reducing runway incursion potential), a PT concept is proposed. Theconcept includes new PTs on the East and West sides of the airport, and two new high speedexits each on 17C and 18R. Figure 2 shows an aerial perspective of the proposed new PTconcept.2
Figure 2. DFW with proposed PTs.Many fast-time simulations and paper studies have been conducted over the last 7 years thatsupport the cost benefit, efficiency, and safety aspects of the proposed airport improvements. Ithas also been determined that no waivers will be needed for the new taxiways. However, priorto the DAPT Demonstration, the improvements had not been observed or assessed in anoperational setting using high fidelity simulation with human operators. In particular, there werefour “views” of special interest for the demonstration: 1) the controller view, 2) the pilot-on-taxiview, 3) the pilot-on-arrival view, and 4) the pilot-on-departure view.An Experiment Working Group (EWG) was formed to plan, conduct, and analyze the DAPTDemonstration to examine the proposed new PTs. Organizations represented on the EWG wereDFW, DFW Tower/TRACON, FAA Southwest Region Charter Program Office (ASW-1C1),FAA Office of System Capacity (ASC-100), NASA ARC, the FAA William J. Hughes TechnicalCenter Simulation and Analysis Group (ACB-330), and NATCA. Other organizations involvedin the effort included FAA Flight Standards Service (AFS), FAA Office of Runway Safety(ARI), ALPA, APA, and American Airlines, American Eagle Airlines, Atlantic SoutheastAirlines, Comair, Delta Airlines, and United Parcel Service Airlines. DFW and the FAAsponsored the study.1.2 ObjectivesThe primary objective of this real-time HITL demonstration was to provide the airlines, airtraffic controllers, pilots, and their associated unions (i.e., NATCA, ALPA, APA) theopportunity to observe and participate in a demonstration of the proposed airport improvements3
at high fidelity levels with the goal of gaining their acceptance of PTs. The secondary objectivewas to collect and analyze operational data for the purpose of deriving descriptive statistics forrunway crossings, taxi times, and pilot and controller transmissions.2. MethodThe demonstration was conducted at NASA ARC in Moffett Field, California. FAA ACB-330acted as Principal Investigator and provided support for the research team. NASA ARC’sFutureFlight Central (FFC) facility and Crew Vehicle Systems Research Facility (CVSRF) wereused to simulate DFW tower operations and flight deck operations respectively, at high fidelitylevels. FFC and CVSRF were integrated and ran simultaneously for all runs. Table 1 highlightskey aspects of the demonstration design.Table 1. Summary of the Demonstration Design Summary of the Demonstration DesignFive Certified Professional Controllers from DFW staffed the FFC simulatorOne staff pilot and seven representatives from the airlines flew the Boeing 747-400 (B744) flight simulator25 pseudo-pilots flew all other simulated aircraft targetsThere were 4 days of demonstrations (including training)East-side tower operations at DFW were simulatedSouth flow traffic operations at DFW were simulatedTwo taxiway configurations were simulated Baseline (BL) represented current DFW configuration and operations PT included the proposed PTs, the extension of Runways 17C, and a new high speed exit on 17C (exitingto the East)For the PT conditions, 17C was lengthened on the approach end and a Precision Approach Path Indicator(PAPI) was installed for the newly lengthene
Southwest Region Charter Program Office, ASC-1C 2601 Meacham Boulevard Fort Worth, Texas 76137-4298 Federal Aviation Administration Office of System Capacity, ASC-100 800 Independence Ave., S.W. Washington, DC 20591 14. Sponsoring Agency Code ASC-1C, ASC-100, and DFW 15. Supplementary Notes