Transcription
How fast is your EC12 / z13?Barton Robinson,barton@velocitysoftware.comVelocity Software Inc.196-D Castro StreetMountain View CA 94041650-964-8867Velocity Software GmbHMax-Joseph-Str. 5D-68167 MannheimGermany 49 (0)621 373844Copyright 2015 Velocity Software, Inc. All Rights Reserved. Otherproducts and company names mentioned herein may be trademarks of theirrespective owners.
AgendaWhat is CPU Utilization? What is importantWhat is CPU Measurement FacilityWhat makes your EC12 faster? What do you need to know for z13?Measurements and resultsYES, ZVPS (4.2) used for all measurements
My QuestionsZ13 has Multithreading How much more throughput? How to predict based on cycles lost for cache missZ13 has larger cache Does affinity work to use the cache? How long does cache last when 10,000 dispatches /second / processor?
Z13 Throughput ThoughtsOne execution unit per IFL (10% slower) Two threads - Neither will get 100% (70%?) “idle time” on execution unit when thread takes cache missObjective of Multithread (MT)? increase Instructions (Capacity) executed on CPU Estimates are 15% to 30%How much “idle” time is there when one thread? “Cache miss” is interesting – idle time Higher cache miss has more potential for improvement
Z13 DesignUp to six instructions can be decoded per clockcycle.Up to ten instructions can be in execution per clockcycle.Instructions can be issued out-of-order.Memory accesses might not be in the sameinstruction order (out-of-order operand fetching).Several instructions can be in progress at anymoment, subject to the maximum number ofdecodes and completions per cycle.
Why I’m interestedWhat is CPU Utilization used for? Capacity planning – How much resource for how much work Understanding performance Planning for z13 .What is important? Throughput (instructions executed, Cycles Per Instruction) Performance service levelsWhat are “MIPS”? Vs Gigahertz? (CPI) Barton’s number 2003: 4 Mhz is about 1 mip (not 1.0 mip, 1 mip or - ) Based on measured workload on intel and p390
Why Am I Interested?CPU Cycle time dropping, CPUs Faster 370/158, 8.696 MHz Z900 – 1.3Ghz (2002) Z990 – 1.2 Ghz (2004) Z9 – 1.7 Ghz (almost as fast as INTEL) Z10 – 4.4 Ghz (customer perception – SLOW for Linux) 196 – 5.2 Ghz EC12 5.5 Ghz (BC12 4.0 Ghz) Z13 – OOPS 5.0 GhzQuestion: Is the z13 faster than EC12?
What Else is Important?CPU Cycle time dropping, Adding cache, function Z990: Faster (almost as fast as Intel) (Execute up to 3 instructions per cycle) Z10: (more cache) 196: (more cache), Out of order execution EC12: (more cache), Enhanced out of order Z13: (more cache), Multi threadsLPAR – HiperDispatch attempts to align Logical CPs with PUs in same BookVertical vs Horizontal SchedulingAffinity
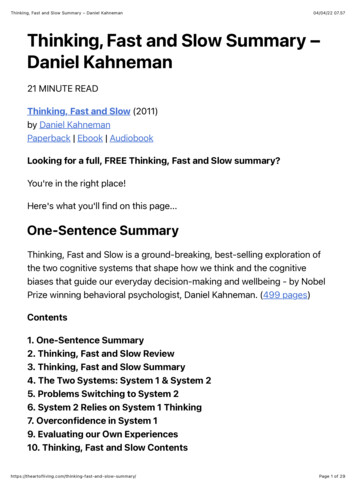
EC12 ArchitectureMemoryL4R (book 2,3,4)CacheL4L (book) CacheL3 (chip)CacheL3 (chip-6)CacheL3 PU-6L1CPU-1CPU-6CPU-1Question, If 10,000 dispatch / second / cpu, impact?
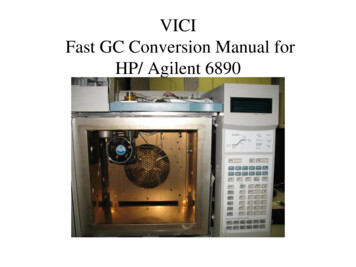
z13 ArchitectureMemoryL4L (node 1,2) CacheL3 (chip)CacheL4R (book 2,3,4) CacheL3 (chip 2,3)CacheL3 PU-8L1CPU-1CPU-8CPU-1Question, If 10,000 dispatch / second / cpu, impact?
Processor cache comparisonCache sizes – EC12 L1: 64k Instruction, 96k Data L2: 1MB Instruction, 1MB Data (private, cpu) L3: 48MB (Chip, shared 6 CPUs) L4: 384MB (Book, shared over 20 CPUs)Cache Sizes – z13 L1: 96K Instruction, 128K Data L2: 2MB Instruction, 2MB data L3: 64MB (Chip, Shared over 8 CPUS) L4: 480MB 224M NIC (per node)
CPU Measurement FacilityWhat is the CPU Measurement Facility Hardware instrumentation Statistics by LPAR, all guests aggregated 5.18 Monitor records (PRCMFC) (Basic, Extended) “Extended” different for z10, 196, EC12 and z13 Shows cycles used, instructions executed and thus CPIReport: ESAMFCMainFrame Cache Analysis ReMonitor initialized: 02/27/15 at ----- CPU Busy -------Processor------ percent Speed/ -Rate/Sec- TimeCPU Totl User Hertz Cycles Instr Ratio-------- --- ---- ---- ----- ------ ----- ----20:01:000 0.7 0.4 4196M 30.8M 8313K 3.709
CPU Measurement FacilityWhat is the CPU Measurement Facility (Basic)Report: ESAMFCAMainFrame Cache Hit AnalysiMonitor initialized: 12/10/14 at 07:44:37 on 282----------------------------------------------- CPU Busy -------Processor------ percent Speed/ -Rate/Sec- CPITimeCPU Totl User Hertz Cycles Instr Ratio-------- --- ---- ---- ----- ------ ----- ----07:48:350 20.8 18.4 5504M 1121M 193M 5.8071 21.6 19.6 5504M 1161M 221M 5.2642 24.4 22.5 5504M 1300M 319M 4.0783 22.4 19.7 5504M 1248M 265M 4.7114 19.6 17.6 5504M 1102M 194M 5.6835 20.4 18.6 5504M 1144M 225M 5.0876 23.9 22.0 5504M 1341M 341M 3.9357 17.6 15.4 5504M949M 160M 5.9278 18.5 16.5 5504M 1005M 194M 5.1959 22.5 20.6 5504M 1259M 347M 3.629---- ---- ----- ------ ----- ----System:212 191 5504M 10.8G 2457M 4.733
CPU Measurement FacilityWhat is the CPU Measurement Facility (Extended)Report: ESAMFCAMainFrame Cache Hit --- ----Rate per 100 Instructions----- -----Data source read from-------- TimeL1L2L3L4LL4RMEM-------- ----- ----- ----- ----- ----- ----07:48:35 3.605 2.062 0.948 0.247 0.003 0.3463.281 1.935 0.831 0.195 0.002 0.3192.607 1.656 0.577 0.137 0.001 0.2372.913 1.678 0.786 0.249 0.002 0.1983.572 1.973 1.037 0.330 0.002 0.2303.188 1.815 0.889 0.272 0.002 0.2102.410 1.462 0.605 0.187 0.002 0.1563.729 1.793 1.220 0.654 0.035 0.0263.209 1.593 1.017 0.535 0.029 0.0362.182 1.222 0.602 0.307 0.018 0.034----- ----- ----- ----- ----- ----System:2.941 1.670 0.800 0.286 0.008 0.176
CPU z196 Cache AnalysisCPU--01 CPU Busy percent Totl User---- ---17.5 15.419.6 18.3 -------Processor------ Speed/ -Rate/Sec- CPIHertz Cycles Instr Ratio----- ------ ----- ----5208M911M 138M 6.5845208M 1023M 189M 5.418 ----Rate per 100 -----Data sourceL1L2L3----- ----- ----2.874 1.450 0.4942.423 1.269 0.414Instructions----- read from-------- L4LL4RMEM----- ----- ----0.493 0.001 0.4350.404 0.001 0.335 13 14.5 13.3---- ---230 2115208M755M 134M 5.644 2.493 1.287 0.447 0.401 0.001 0.357----- ------ ----- ----- ----- ----- ----- ----- ----- ----5208M 11.2G 2124M 5.639 2.490 1.300 0.425 0.411 0.001 0.354 CPU Busy percent Totl User---- ---17.5 15.419.6 18.3CPU--01 13 14.5 13.3---- ---230 211 Lost cycles / instruction -L1 Cache- -TLB Miss- INSTR DataInstr Data----- --------- ----4.921 2.9370.012 0.0024.044 2.1840.010 02----0.002 Lost cycles per instruction high, MT valuable?
Cache “Performance” termsWhat to measure (EC12) L1MP – Level 1 Miss % L2P – % sourced from L2 cache L3P – % sourced from Level 3 Local (chip) cache L4LP – % sourced from Level 4 Local book L4RP - % sourced from Level 4 Remote book MEMP – % sourced from Memory - EXPENSIVE
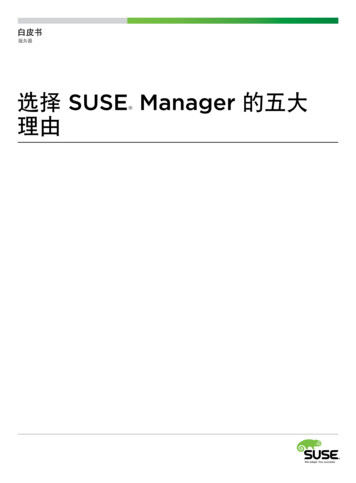
Why you should be interested – what is a MIP?Report: ESAMFCMainFrame Cache Analysis RepMonitor initialized: 12/23/14 at 13:55:31 on -- CPU Busy -------Processor------ percent Speed/ -Rate/Sec- TimeCPU Totl User Hertz Cycles Instr Ratio-------- --- ---- ---- ----- ------ ----- ----14:05:320 92.9 64.6 5000M 4642M 1818M 2.5541 92.7 64.5 5000M 4630M 1817M 2.5482 93.0 64.7 5000M 4646M 1827M 2.5443 93.1 64.9 5000M 4654M 1831M 2.5414 92.9 64.8 5000M 4641M 1836M 2.5285 92.6 64.6 5000M 4630M 1826M 2.536---- ---- ----- ------ ----- ----System:557 388 5000M 25.9G 10.2G ---14:06:020 67.7 50.9 5000M 3389M 2052M 1.6521 67.8 51.4 5000M 3389M 2111M 1.6052 69.0 52.4 5000M 3450M 2150M 1.6053 67.2 50.6 5000M 3359M 2018M 1.6644 60.8 44.5 5000M 3042M 1625M 1.8725 70.1 53.8 5000M 3506M 2325M 1.508---- ---- ----- ------ ----- ----System:403 304 5000M 18.8G 11.4G 1.6401830 mips(at 100%)2828 Mips(at 100%)Doing 10%more work
Why you should be interested – what is a MIP?Report: ESAMFCAMainFrame Cache Hit Analysis ------------------------------- CPU Busy ----- ----Rate per 100 Instructions----- percent CPI -----Data source read from-------- TimeCPU Totl User Ratio L1L2L3L4LL4RMEM-------- --- ---- ---- ----- ----- ----- ----- ----- ----- ----14:05:320 92.9 64.6 2.554 4.618 3.963 0.585 0.042 0.000 0.0231 92.7 64.5 2.548 4.624 3.972 0.584 0.040 0.000 0.0242 93.0 64.7 2.544 4.587 3.928 0.590 0.042 0.000 0.0233 93.1 64.9 2.541 4.561 3.904 0.587 0.043 0.000 0.0224 92.9 64.8 2.528 4.542 3.888 0.585 0.042 0.000 0.0235 92.6 64.6 2.536 4.564 3.907 0.588 0.041 0.000 0.023---- ---- ----- ----- ----- ----- ----- ----- ----System:557 388 2.542 4.582 3.927 0.587 0.042 0.000 --------------------14:06:020 67.7 50.9 1.652 2.456 2.115 0.302 0.020 0.000 0.0161 67.8 51.4 1.605 2.322 1.999 0.286 0.020 0.000 0.0152 69.0 52.4 1.605 2.273 1.945 0.290 0.023 0.000 0.0133 67.2 50.6 1.664 2.409 2.061 0.308 0.024 0.000 0.0144 60.8 44.5 1.872 2.952 2.535 0.371 0.027 0.000 0.0175 70.1 53.8 1.508 2.097 1.799 0.263 0.019 0.000 0.013---- ---- ----- ----- ----- ----- ----- ----- ----System:403 304 1.640 2.391 2.052 0.300 0.022 0.000 0.015
Workload studiesWorkloads: Look at dispatches / second 1st, pl1 loop (same as rexx loop) (17:11 to 17:17) 2nd, run zmap against 50 sets of customer data
How long does cache last?Average storage loaded per dispatch (idle time): Memory requests per 100 instructions: .01 At 2,000 dispatches per second, low utilization Cache lines loaded from memory per dispatch: 66
MFC, memory :00 CPU Busy ----- percent CPITotl User Ratio---- ---- ----- ----Rate per 100 -----Data sourceL1L2L3----- ----- -----Instructions----- read from-------- L4LL4RMEM----- ----- 80.007Rexx loopPL1 Loop – (check the other LPAR?)zMAP batch
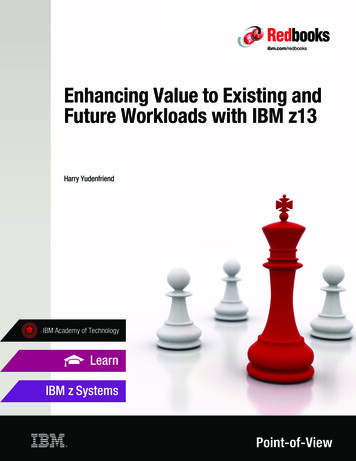
MFC, memory loads?Report: ESAMFCAManalysisVelocity SoftwareMonitor initialized: 03on 2828 serial 314C7First record ------------------ CPU Busy ----- ----Rate per 100 Instructions---- percent CPI -----Data source read from-------TimeCPU Totl User Ratio L1L2L3L4LL4RMEM-------- --- ---- ---- ----- ----- ----- ----- ----- ----- ----09:24:000 0.6 0.4 3.443 3.216 2.304 0.747 0.1410 0.02509:25:000 0.6 0.4 3.371 3.154 2.296 0.690 0.1420 0.02609:26:000 61.0 60.7 3.998 0.047 0.035 0.009 0.0020 0.00009:27:000 83.6 83.3 4.003 0.042 0.031 0.010 0.0010 0.00009:28:000 0.6 0.3 3.386 3.156 2.294 0.699 0.1400 0.02409:29:000 1.6 1.3 2.387 1.459 1.105 0.274 0.0580 0.02209:30:000 27.2 26.9 1.439 0.040 0.030 0.008 0.0010 0.00009:31:000 93.2 92.8 1.432 0.019 0.015 0.004 0.0000 0.00009:32:000 87.0 86.7 1.433 0.020 0.015 0.004 0.0010 0.00009:33:000 1.8 1.4 2.345 1.378 1.051 0.251 0.0590 0.01709:34:000 72.8 72.5 4.003 0.042 0.031 0.010 0.0020 0.00009:35:000 93.9 93.6 4.006 0.035 0.026 0.008 0.0010 0.00009:36:000 93.4 93.2 4.001 0.031 0.024 0.006 0.00100Run same programs again:Rexx consistently 1.4, PL1 consistently 4 .
Benchmark AnalysisLooping program (BC12 IFL) 1.4 cycles per instruction Memory access zero by looper 2,000 dispatches per second for ‘other work’Idle Time Analysis 4 cycles per instruction 2,000 dispatches per second – Mystery work NOTE- z13 support adds vmdbk dispatch rate!!!!ZMAP workload (99% of the load) 2.0 cycles per instruction – increased memory access 7,000 dispatches per second
Why is looper not CPI of 1:1?Average time in dispatch (idle time): 2,000 dispatches per second 1% cpu utilization 5 microseconds per dispatch average Gigahertz: 4.196 Cycles per microsecond: 4,196 Cycles per dispatch: 20,000 Memory requests per 100 instructions: .03 “cache lines” loaded from memory per dispatch: 6
How long does cache last?Average time in dispatch (zmap load testing time): 15,000 dispatches per second 20% cpu utilization 13 microseconds per dispatch average Gigahertz: 4.196 Cycles per microsecond: 4,196 Cycles per dispatch: 260,000 Memory requests per 100 instructions: .02 “Cache lines” loaded from memory per dispatch: 50 (Well tuned PL1 program)
Value of cache – Relative Nest Intensity (RNI)IBM RNI calculation analysis zEC12RNI 2.3x(0.4xL3P 1.2xL4LP 2.7xL4RP 8.2xMEMP)/100Cost analysis - ratio L3P: 1- L3 cache source L4LP: 3 - L4 local cache source L4RP: 6 - L4 Remote cache source MEM: 19 - memory source
Value of cacheIBM RNI calculations (per John Burg) z13RNI 2.6x(0.4xL3P 1.6xL4LP 3.5xL4RP 7.5xMEMP)/100 zEC12RNI 2.3x(0.4xL3P 1.2xL4LP 2.7xL4RP 8.2xMEMP)/100 z196RNI 1.67x(0.4xL3P 1.0xL4LP 2.4xL4RP 7.5xMEMP)/100 z10RNI (1.0xL2LP 2.4xL2RP 7.5xMEMP)/100.
MIPS vs RNIAnalysis, 40 Different LPARS, sort by CPIMemory components by colorRed is L4 LOCAL, “mem” is time for “memory”
Value of cacheAnalysis, 40 LPARS, sort by Relative Nest Intensity2 on right are z196 – (rest are ec12)Z196 had smaller cache, more memory access
MIPS vs RNIAnalysis, 40 Different LPARS, sort by CPISlope of CPI and RNI “very close”Higher RNI, lower mips
Impact of memory access?Analysis, 40 LPARS, sort by “MEMP”, ec12 onlyCommon Characteristic of “high” ones?
Impact of high MPLAnalysis, 40 LPARS, Assume less dispatches, better RNI? sort by Dispatches/CPU/Second No expected pattern, more is better?
Impact of number of engines in LPARAnalysis, 40 LPARS, Do VCPU on other LPARs impact workload? sort by shared IFLs No expected pattern, more is better?
Value of polarization?Analysis, 40 LPARS, sort by horizontal vs vertical No expected pattern, vertical slightly better?Horizontalvertical
Nesting Steals – Affinity working?EC12, 80 IFLsLPAR: 32 IFLs (p210)Report: ESAPLDVProcessor Local Dispatch Vector ---------------- -CPU Steals fr VMDBK Moves/sec Dispatcher -From NestingTimeCPU Steals To Master Long Paths Same NL1 NL2-------- --- ------ --------- ---------- ---- ---- ---14:06:000 3529.811.613104.2 1951 1198 3801 2908.6011452.0 1626 976 3062 2751.9010475.2 1630 855 267 8 3156.8011949.7 1462 1366 3299 2702.0010806.9 1283 1137 28210 2504.709849.8 1287 970 248Steals: vmdblks moved to processorDispatcher Long paths: vmdblks dispatched (10K/Sec/CPU)Nesting level – CPU on chip, different chip(NL1),different book(NL2)
CPU Cache AnalysisReport: ESAMFCAMainFrame Cache Hit ----------------------------- CPU Busy --------- ----Rate per 100 Instructions----- percent Speed CPI -----Data source read from-------- TimeCPU Totl User Hertz Ratio L1L2L3L4LL4RMEM-------- --- ---- ---- ----- ----- ----- ----- ----- ----- ----- ----14:06:020 77.2 40.6 5504M 3.764 2.134 1.176 0.729 0.155 0.025 0.0481 76.1 42.5 5504M 3.625 2.112 1.183 0.714 0.146 0.022 0.0462 75.3 41.8 5504M 3.591 2.031 1.138 0.688 0.138 0.020 0.0473 74.8 42.3 5504M 3.539 2.001 1.118 0.679 0.136 0.020 0.0484 75.5 43.1 5504M 3.400 1.862 1.048 0.622 0.127 0.018 0.048Cache source Analysis 3.7 cycles per instruction 2.1 % instructions from other level 1 cache on chip 1.2% instructions from other level 2 cache on chip .7% from level 3 on chip .2% from level 4 on book .02% from level 4 on remote book .05 % from memory (1 page from memory per 2,000 Inst)
Cache analysis arithmeticEc12 cache sizes L1: 64/96 L2 1m/1m L3 48M L4: 384MDispatches per second per CPU: 10,000 256 byte cache line L3: 48MB, supports 190,000 cache line loads L3 supports 6 cpus, 60,000 dispatches per second L3 cycles every 3 seconds
TLB Analysis – z13 data SMT EnabledWhy working sets are important,Why we need large pages?ESAMFCMainFramateZMAP 4.2.2 08/10/15Page 164initialized: 07/07/157/07/15 --------------- CPU Busy ---- -Translation Lookaside buffer(TLB)- percent Speed cycles/Miss Writs/Sec CPU CyclesCPU Totl User Hertz Instr Data Instr DataCost Lost--- ---- ---- --------- ----- ----- ----- ----- ----0 26.4 24.2 5000M102534 1043K 527K 29.23 388M1 25.4 23.7 5000M100541 1010K 499K 29.12 371M2 24.5 22.8 5000M127558 872K 487K 31.09 383M3 25.8 24.1 5000M125554 891K 500K 30.06 389M4 20.0 18.3 5000M131575 667K 376K 30.19 303M5 21.1 19.6 5000M126579 679K 374K 28.53 302M
Affinity Testing - MeasurementsBC12, 3 LPARS (2 physical IFLs)- 1 IFL, z/VM 5.4- 2 IFLs, z/VM 5.4- 2 IFLs, z/VM 6.3Run looper for 2 minutes on eachExpectation: less balance on z/VM 6.3
Affinity – is there any?z/VM 5.4, looping on IFL, no affinityScreen: ESACPUU Velocity Software - VSIVM41 of 3 CPU Utilization Analysis (Part 1) ------CPU (percentages)---- --CPU- TotalEmul Overhead IdleTimeID Typeutiltime User Syst time-------- --- ---- ------ ------ ---- ---- ----07:35:001 IFL16.315.0 1.0 0.3 83.10 IFL17.115.9 0.9 0.4 82.307:34:001 IFL56.254.9 1.0 0.3 42.50 IFL60.158.9 0.9 0.3 39.007:33:001 IFL67.065.8 0.9 0.3 32.10 IFL62.661.4 0.9 0.3 36.307:32:001 IFL31.230.0 0.9 0.3 67.90 IFL34.032.6 1.0 0.4 65.5
Affinity – is there any?z/VM 6.3, looping on IFL – a little affinityScreen: ESACPUU Velocity Software1 of 3 CPU Utilization Analysis (Part 1)Time-------07:26:0007:25:0007:24:00 --CPU- Type ID---- --CP0IFL12CP0IFL12CP0IFL12ESACPU ----CPU (percentages)---------- Total Emul -Overhd CPU Wait util time User Syst Idle Steal----- ----- ---- ---- ----- ----10.57.5 0.5 2.5 89.30.153.2 53.1 0.0 0.1 36.9 10.034.5 34.3 0.1 0.1 56.88.710.97.8 0.5 2.6 88.80.255.5 55.3 0.1 0.1 40.44.139.1 38.9 0.1 0.1 56.74.210.07.7 0.5 1.8 89.80.24.54.3 0.1 0.1 95.10.510.09.8 0.1 0.1 88.91.1
Value of Affinity?Objectives of “affinity” Re-dispatch on same processor Utilize cacheExperiment: Looper for 2 minutes, measure CPU z/VM 5.4, 1 IFL: 123.16 cpu seconds z/VM 5.4, 2 IFL: 123.14 CPU seconds z/VM 6.3, 2 IFL: 123.71 CPU seconds (ran twice)Conclusion: 6.3 Affinity not helping with horizontal- Note: CPI consistently lower with 6.4
Parking?Objectives of “vertical” schedulingLocalize work to cacheMonitor “event” – see parked cpus every 2 seconds
Parking?Objectives of “vertical”Localize work to cacheCan we validate this has value?
ConclusionsCycles per Instruction mattersReducing cycles per instruction improvesperformanceUse of cache (all levels) has positive impact Need to dispatch fewer times on more processors Need further understanding NEED z13 DATA!
ConclusionsTo answer your real question:Is the z13 faster than EC12?Report: ESAMFCAMainFrame Cache Hit AnalysiMonitor initialized: 06/29/15 at 08:59:00 on 296----------------------------------------------- CPU Busy -------Processor------ percent Speed/ -Rate/Sec- CPITimeCPU Totl User Hertz Cycles Instr Ratio-------- --- ---- ---- ----- ------ ----- ----System:288 283 5000M 12.8G 9158M 1.496System:934 871 5000M 43.6G 16.2G 2.692System:427 294 5000M 19.9G 8393M 2.542
Thank YouPlease Send data for z13
Planning for z13 . What is important? Throughput (instructions executed, Cycles Per Instruction) Performance service levels What are "MIPS"? Vs Gigahertz? (CPI) Barton's number 2003: 4 Mhz is about 1 mip (not 1.0 mip, 1 mip or - ) Based on measured workload on intel and p390