Transcription
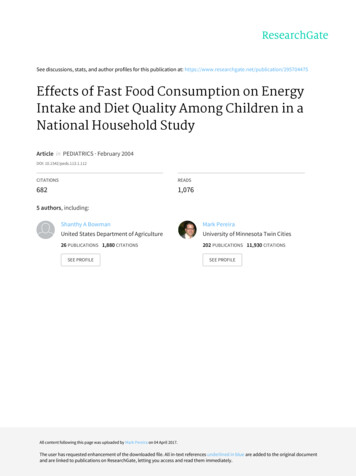
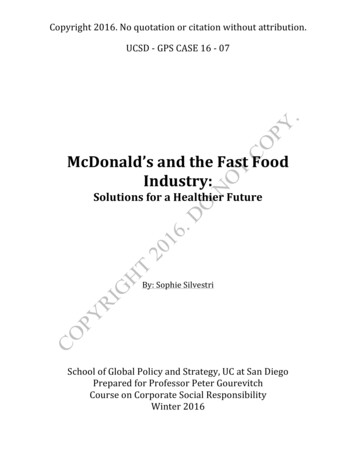
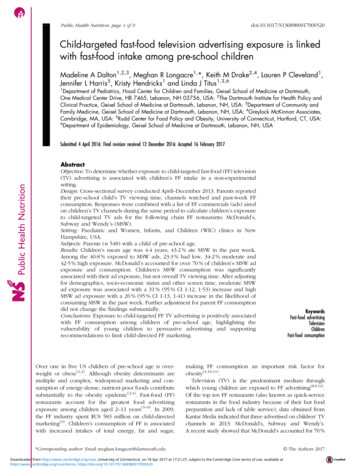
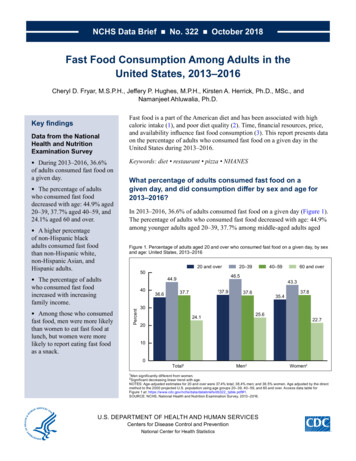
NCHS Data Brief No. 322 October 2018Fast Food Consumption Among Adults in theUnited States, 2013–2016Cheryl D. Fryar, M.S.P.H., Jeffery P. Hughes, M.P.H., Kirsten A. Herrick, Ph.D., MSc., andNamanjeet Ahluwalia, Ph.D.Key findingsData from the NationalHealth and NutritionExamination SurveyDuring 2013–2016, 36.6%of adults consumed fast food ona given day. The percentage of adultswho consumed fast fooddecreased with age: 44.9% aged20–39, 37.7% aged 40–59, and24.1% aged 60 and over. A higher percentageof non-Hispanic blackadults consumed fast foodthan non-Hispanic white,non-Hispanic Asian, andHispanic adults. Fast food is a part of the American diet and has been associated with highcaloric intake (1), and poor diet quality (2). Time, financial resources, price,and availability influence fast food consumption (3). This report presents dataon the percentage of adults who consumed fast food on a given day in theUnited States during 2013–2016.Keywords: diet restaurant pizza NHANESWhat percentage of adults consumed fast food on agiven day, and did consumption differ by sex and age for2013–2016?In 2013–2016, 36.6% of adults consumed fast food on a given day (Figure 1).The percentage of adults who consumed fast food decreased with age: 44.9%among younger adults aged 20–39, 37.7% among middle-aged adults agedFigure 1. Percentage of adults aged 20 and over who consumed fast food on a given day, by sexand age: United States, 2013–201620 and over50The percentage of adultswho consumed fast foodincreased with increasingfamily income.Percent40Among those who consumedfast food, men were more likelythan women to eat fast food atlunch, but women were morelikely to report eating fast foodas a snack. 36.640–5946.544.9 20–39137.737.960 and Women2Men significantly different from women.Significant decreasing linear trend with age.NOTES: Age-adjusted estimates for 20 and over were 37.4% total; 38.4% men; and 36.5% women. Age adjusted by the directmethod to the 2000 projected U.S. population using age groups 20–39, 40–59, and 60 and over. Access data table forFigure 1 at: https://www.cdc.gov/nchs/data/databriefs/db322 table.pdf#1.SOURCE: NCHS, National Health and Nutrition Examination Survey, 2013–2016.2U.S. DEPARTMENT OF HEALTH AND HUMAN SERVICESCenters for Disease Control and PreventionNational Center for Health Statistics
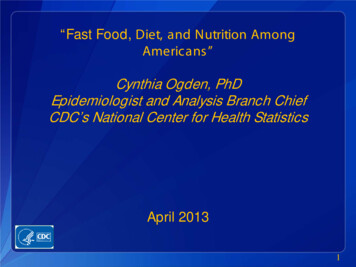
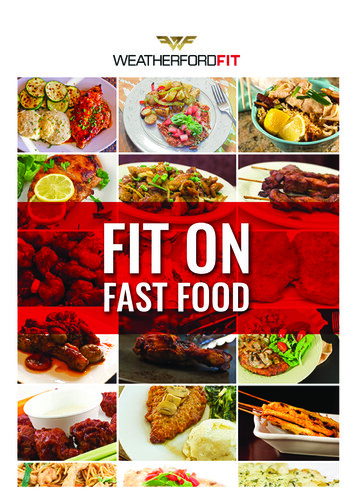
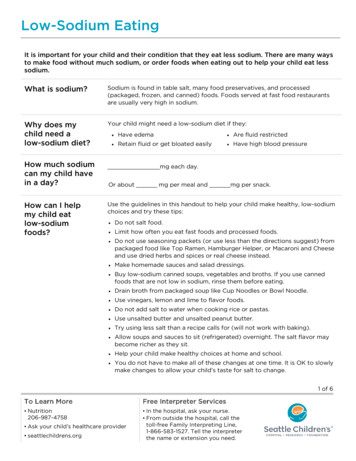
NCHS Data Brief No. 322 October 201840–59, and 24.1% among older adults aged 60 and over. This pattern by age was observedfor both men and women. Among all adults, a higher percentage of men (37.9%) than women(35.4%) consumed fast foods.Did the percentage of adults consuming fast food on a given day differ byrace and Hispanic origin for 2013–2016?Fast food consumption was higher among non-Hispanic black adults (42.4%) compared withnon-Hispanic white (37.6%), non-Hispanic Asian (30.6%), and Hispanic (35.5%) adults(Figure 2). A higher percentage of non-Hispanic white adults consumed fast food compared withnon-Hispanic Asian adults.Among men, the percentage who consumed fast food was higher among non-Hispanic blackadults (41.8%) compared with non-Hispanic Asian (31.1%) and Hispanic (35.2%) adults. Fastfood consumption was also higher among non-Hispanic white men (39.0%) compared withnon-Hispanic Asian men.Among women, the percentage of non-Hispanic black adults who consumed fast food (42.9%)was higher compared with non-Hispanic white (36.3%), Hispanic (35.8%), and non-HispanicAsian (30.4%) adults.There were no significant differences between men and women of the same race and Hispanicorigin group in the percentage who consumed fast food.Figure 2. Age-adjusted percentage of adults aged 20 and over who consumed fast food on a given day, by sex and raceand Hispanic origin: United States, 2013–2016Non-Hispanic white501–34042.41,3137.6Non-Hispanic 35.830.4Percent301Non-Hispanic black20100TotalMen1WomenSignificantly different from non-Hispanic Asian persons.Significantly different from non-Hispanic white persons.Significantly different from Hispanic persons.NOTES: All estimates are age adjusted by the direct method to the 2000 projected U.S. population using age groups 20–39, 40–59, and 60 and over. Accessdata table for Figure 2 at: https://www.cdc.gov/nchs/data/databriefs/db322 table.pdf#2.SOURCE: NCHS, National Health and Nutrition Examination Survey, 2013–2016.23 2
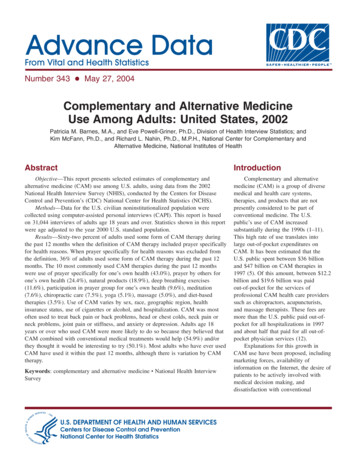
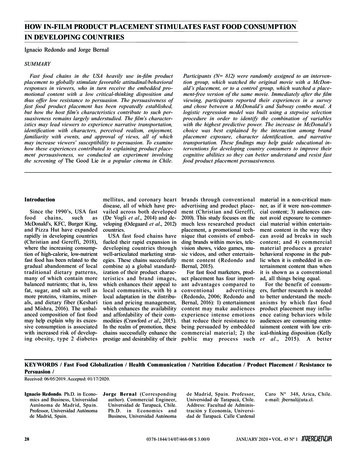
NCHS Data Brief No. 322 October 2018Did the percentage of adults consuming fast food on a given day differ byfamily income level for 2013–2016?The percentage of adults who consumed fast food increased with increasing family income level(Figure 3). Overall, 31.7% of lower-income (less than or equal to 130% of the federal povertylevel [FPL]), 36.4% of middle-income (greater than 130% to less than or equal to 350% of FPL),and 42.0% of higher-income (greater than 350% of FPL) adults consumed fast food on a givenday. A similar pattern was observed for both men and women.Within each income level, there was no significant difference in the percentage between men andwomen who consumed fast food.Figure 3. Age-adjusted percentage of adults aged 20 and over who consumed fast food on a given day, by sex and familyincome level: United States, 2013–2016Less than or equal to130% of FPLGreater than 130% to less thanor equal to 350% of FPLGreater than 350% of 3020100Total1Men11Women1Significant increasing linear trend by family income level.NOTES: FPL is federal poverty level. All estimates are age adjusted by the direct method to the 2000 projected U.S. population using the age groups 20–39,40–59, and 60 and over. Access data table for Figure 3 at: https://www.cdc.gov/nchs/data/databriefs/db322 table.pdf#3.SOURCE: NCHS, National Health and Nutrition Examination Survey, 2013–2016. 3
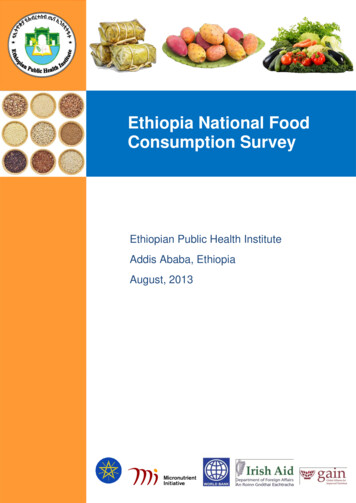
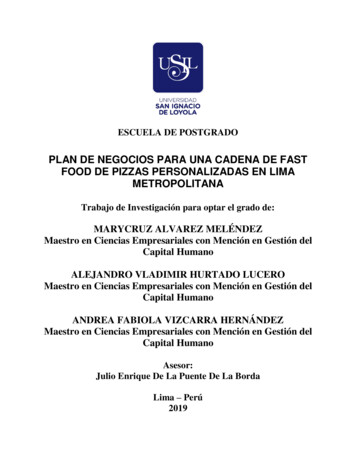
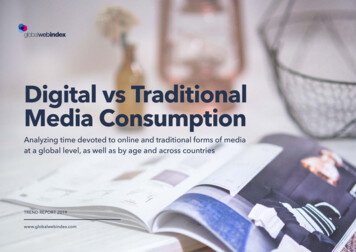
NCHS Data Brief No. 322 October 2018Among adults who reported consuming fast food, did the percentage varyby meal type for 2013–2016?Among adults who consumed fast food, the most commonly reported eating occasions were lunch(43.7%) and dinner (42.0%), followed by breakfast (22.7%) and snacks (22.6%) (Figure 4).A higher percentage of men (48.3%) than women (39.1%) consumed fast food during lunch,while a higher percentage of women (25.7%) than men (19.5%) consumed fast food from snacks.Figure 4. Percentage of adults aged 20 and over who consumed fast food on a given day, by sex and eating occasion:United States, g acks19.510102025.7Percent130Men and women are significantly different within eating occasion.NOTES: Respondents could report multiple occasions of eating fast food. Access data table for Figure 4 at:https://www.cdc.gov/nchs/data/databriefs/db322 table.pdf#4.SOURCE: NCHS, National Health and Nutrition Examination Survey, 2013–2016. 4 4050
NCHS Data Brief No. 322 October 2018SummaryDuring 2013–2016, approximately 37% of adults consumed fast food on a given day. The overallpercentage of adults who consumed fast food decreased with age, increased with income, and washigher among non-Hispanic black persons compared with other race and Hispanic-origin groups.In addition, a higher percentage of non-Hispanic white adults consumed fast food than didnon-Hispanic Asian adults. Among men and women who consumed fast food, a higher percentageof men ate it for lunch, while a higher percentage of women ate it as a snack.Fast food consumption has been associated with increased intake of calories, fat, and sodium (4).A previous report estimated that adults consumed 11.3% of their total daily calories from fastfood (1). Consumers can find nutritional information on calories on the menu in most fast foodestablishments and restaurants (5).DefinitionsFast-food consumption: For each food and beverage item that respondents reported consumingduring their 24-hour recall, the participant is also asked about the source where they obtainedthose items. Food reported as “restaurant fast food/pizza” was considered fast food for theseanalyses.Federal poverty level (FPL): Based on the income-to-poverty ratio, a measure of the annual totalfamily income divided by the poverty guidelines, adjusted for family size and inflation.Eating occasion: Distinct eating or drinking occurrence reported during the 24-hour dietaryinterview that consists of one or more food or beverage item. The name of the eating occasionwas selected from a fixed list provided during the interview. English and Spanish eatingoccasion names were grouped as follows: Breakfast: breakfast, desayuno, and almuerzo; Lunch:brunch, lunch, and comida; Dinner: dinner, supper, and cena; and Snack: snack, drink, extendedconsumption (items that were consumed over a long period of time), merienda, entre comidas,botana, bocadillo, tentempie, and bebida. 5
NCHS Data Brief No. 322 October 2018Data source and methodsData for this report are from the National Health and Nutrition Examination Survey (NHANES)(6), a cross-sectional survey conducted by the National Center for Health Statistics (NCHS)designed to monitor the health and nutritional status of the civilian noninstitutionalized U.S.population. It consists of home interviews followed by standardized physical examinationsin mobile examination centers (MEC). The NHANES sample is selected through a complex,multistage probability design (7). For 2013–2016, non-Hispanic black, non-Hispanic Asian, andHispanic persons were among the groups oversampled.Dietary information was obtained via an in-person, 24-hour dietary recall interview with trainedinterviewers in the MEC. Dietary recall determined intake for the 24-hour period prior to theinterview (midnight to midnight) (8). Limitations, such as underreporting, are associated with24-hour recalls and have been well characterized (8,9). Day 1 dietary sample weights, whichaccounted for the differential probabilities of selection, nonresponse, and noncoverage, as wellas day of the week of dietary recall and nonresponse to the dietary interview, were incorporatedinto the estimation process. Taylor series linearization was used to compute variance estimates.Differences between subgroups, as well as linear trends across age and family income level,were evaluated using orthogonal contrasts to calculate a Student’s t statistic. Differences wereconsidered significant at p 0.05. All reported estimates met NCHS presentation standards(10). Estimates for the adults were age adjusted using the direct method to the 2000 projectedU.S. population using the age groups 20–39, 40–59, and 60 and over. Statistical analyses wereconducted using SAS-callable SUDAAN version 11.0 (RTI International, Research Triangle Park,N.C.).About the authorsCheryl D. Fryar, Jeffery P. Hughes, Kirsten A. Herrick, and Namanjeet Ahluwalia are with theNational Center for Health Statistics, Division of Health and Nutrition Examination Surveys. 6
NCHS Data Brief No. 322 October 2018References1. Fryar CD, Ervin RB. Caloric intake from fast food among adults: United States, 2007–2010.NCHS Data Brief, no 114. Hyattsville, MD: National Center for Health Statistics. 2013.2. Todd J. Changes in consumption of food away from home and intakes of energy and othernutrients among U.S. working-age adults, 2005–2014. Public Health Nutr 20(18):3238–46. 2017.3. Rahkovsky I, Jo Y, Carlson A. Consumers balance time and money in purchasingconvenience foods. ERR–251. U.S. Department of Agriculture, Economic Research Service.2018.4. Wu HW, Sturm R. What’s on the menu? A review of the energy and nutritional content ofU.S. chain restaurant menus. Public Health Nutr 16(1):87–96. 2013.5. American Heart Association News. Major restaurants now required to show calories on themenu. Available from: . National Center for Health Statistics. National Health and Nutrition Examination Survey:Questionnaires, datasets, and related documentation. Available from:https://www.cdc.gov/nchs/nhanes/nhanes questionnaires.htm.7. Johnson CL, Dohrmann SM, Burt VL, Mohadjer LK. National Health and NutritionExamination Survey: Sample design, 2011–2014. National Center for Health Statistics. VitalHealth Stat 2(162). 2014.8. Ahluwalia N, Dwyer J, Terry A, Moshfegh A, Johnson C. Update on NHANES dietary data:Focus on collection, release, analytical considerations, and uses to inform public policy. Adv Nutr7(1):121–34. 2016.9. Subar AF, Freedman LS, Tooze JA, Kirkpatrick SI, Boushey C, Neuhouser ML, et al.Addressing current criticism regarding the value of self-report dietary data. J Nutr 145(12):2639–45. 2015.10. Parker JD, Talih M, Malec DJ, Beresovsky V, Carroll M, Gonzales Jr. JF, et al. NationalCenter for Health Statistics Data Presentation Standards for Proportions. National Center forHealth Statistics. Vital Health Stat 2(175). 2017. 7
U.S. DEPARTMENT OFHEALTH & HUMAN SERVICESFIRST CLASS MAILPOSTAGE & FEES PAIDCDC/NCHSPERMIT NO. G-284Centers for Disease Control and PreventionNational Center for Health Statistics3311 Toledo Road, Room 4551, MS P08Hyattsville, MD 20782–2064OFFICIAL BUSINESSPENALTY FOR PRIVATE USE, 300For more NCHS Data Briefs, .htm.NCHS Data Brief No. 322 October 2018Suggested citationFryar CD, Hughes JP, Herrick KA,Ahluwalia, N. Fast food consumption amongadults in the United States, 2013–2016.NCHS Data Brief, no 322. Hyattsville, MD:National Center for Health Statistics. 2018.Copyright informationAll material appearing in this report is inthe public domain and may be reproducedor copied without permission; citation as tosource, however, is appreciated.National Center for HealthStatisticsCharles J. Rothwell, M.S., M.B.A., DirectorJennifer H. Madans, Ph.D., AssociateDirector for ScienceDivision of Health and NutritionExamination SurveysKathryn S. Porter, M.D., M.S., DirectorRyne Paulose-Ram, M.A., Ph.D., AssociateDirector for ScienceFor e-mail updates on NCHS publicationreleases, subscribe online at:https://www.cdc.gov/nchs/govdelivery.htm.For questions or general informationabout NCHS:Tel: 1–800–CDC–INFO (1–800–232–4636)TTY: 1–888–232–6348Internet: https://www.cdc.gov/nchsOnline request form: https://www.cdc.gov/infoISSN 1941–4927 Print ed.ISSN 1941–4935 Online ed.DHHS Publication No. 2018–1209CS296209
Fast food is a part of the American diet and has been associated with high . caloric intake (1), and poor diet quality (2). Time, financial resources, price, and availability influence fast food consumption (3). This report presents data on the percentage of adults who consumed fast f