Transcription
The most efficient and most effective way to allocate capital to multi-family real estateInvestor PresentationOne CanalJune 2022Boston, MA0
The most efficient and most effective way to allocate capital to multi-family real estateKey Takeaways12Multi-familyfundamentals remainstrong, and AIR’sbusiness continues toperform3AIR has a high-quality portfolio:- Diversified across eight core markets withattractive economic growth and limitedregulatory risk- Third highest average rents within the sectorat 2,482, up 275, or 12.5%, since Separation4The AIR Edge is a differentiator:- Source of Same Store organic growth with thehighest conversion of rent to FCF among peers, 910% greater than the average(1)AIR’s simple,transparent businessmodel of narrow focusand low leveragewarrants a low riskpremium5Experienced, deep team fullyaligned with shareholders- Driver of attractive risk-adjusted external growththrough disciplined, accretive paired trades(1)Per company filings. Peers defined as AVB, CPT, EQR, ESS, MAA, and UDR. Coastal peers defined as AVB, EQR, ESS, and UDR. Sunbelt peers defined as CPT and MAA.1
The most efficient and most effective way to allocate capital to multi-family real estateSimple, transparent business with a high-quality portfolio driving attractive organic growthApril / May Operating UpdateCompounded SS Revenue Growth(1)SS Revenue to FCF Conversion (%)(2)Indexed to 9.0%59.7%2021Q1 2022109.0104.1Apr 2022New Leases( ) RevenueMay 2022Renewals Wtd. Avg.2019AIR20202021Coastal Avg.Sunbelt Avg.Emphasis on “good neighbor” policies and stablecommunities continues to attract strong demand,and retain high-quality, affluent residents Diversification supports stable growth over cycles AIR’s business continues to perform; externalgrowth demonstrates the value of the AIR Edge2022MidpointGuidance(-) OperatingExpense2021Q1 2022Peer Average(1) Peer-leading(1) COE track record Additional efficiency through G&A cap in place As a result, 9-10% more Same Store Revenueconverted to FCF– Durable advantage in growth created by theAIR Edge compounds over time– Class of 2021 acquisitions outperforming withblended signed leases up 26.6% at City Centerand 27.3% in the DC Portfolio (1)(2)Expect to sustain momentum in 2022 and 2023given (i) earn in, (ii) low teens loss-to-lease, and(iii) current indications of sustained leasingthrough peak seasonPer company filings. Peers defined as AVB, CPT, EQR, ESS, MAA, and UDR. Coastal peers defined as AVB, EQR, ESS, and UDR. Sunbelt peers defined as CPT and MAA.Reflects Q1 2022 and 2021 financials as reported in company filings. Free Cash Flow Conversion % defined as Same Store NOI less Net Property Management and G&A Expense, and divided by SameStore Revenue. Please see appendix for additional detail.2
The most efficient and most effective way to allocate capital to multi-family real estateSignificant upside potential through disciplined paired trades and deployment of the AIR Edge( ) DisciplinedExternal GrowthOpportunity Class of 2021(1) acquisitions represent 7% of AIR’s total portfolio and is growing at 2x the rate of theSame Store Class of 2022(1) completed acquisitions (see Page 4) increases the allocation to 9% Target is 15% of total portfolio in properties new to the AIR platform with NOI growth at 2-3x marketlevels in Years 2-4 under AIR’s ownership Key assumption: ability to source new opportunities as Classes revert to market after Year 42022 Change In Blended Signed Lease Rates (%)Illustrative Impact at Full Deployment Class of 2021 outperforming underwriting NOI yields expected to materialize as leasing performance earns in On track for 50% higher growth in Q4 2022 relative to AIR’s SSNOI growth23.4%22.1%13.8%Jan13.9%FebClass of 2021(1)(1)27.9%26.6%15.3%Mar 35% expected increase in rate of portfolio NOIgrowth at targeted 2B total allocation27.0%14.4%Apr13.5%MayAIR Same StoreClass of 2021 acquisitions defined as City Center on 7th, North Park, Huntington Gateway, Vaughn Place, and Residences at Capital Crescent Trail. Class of 2022 acquisitions defined as the Reserve atCoconut Point and Watermarc at Biscayne Bay.3
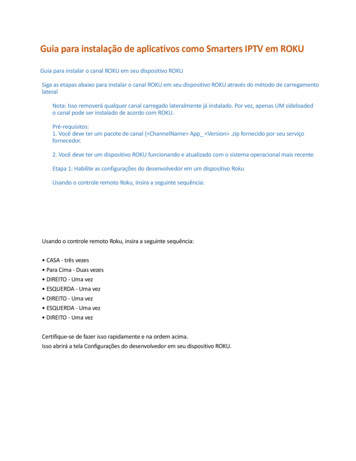
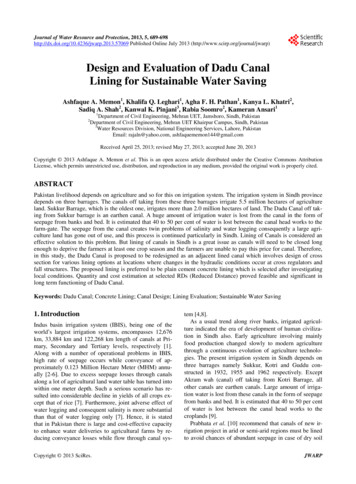
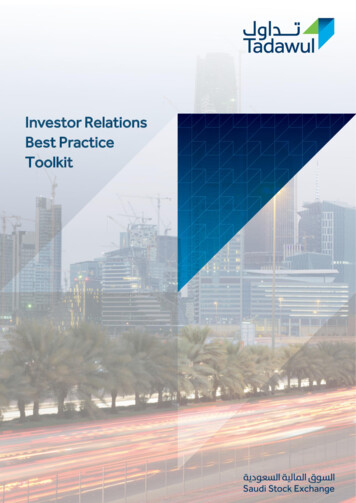
The most efficient and most effective way to allocate capital to multi-family real estateStrategy expected to drive significant NOI growth in AIR’s initial Class of 2022 acquisitionsThe Reserve at Coconut Point Purchase price: 72M Newly developed 180 apartment community– Located in Estero, FL– Submarket between Naples and Fort Myers that is part of a 500-acre master planned community– Short walk to Hertz’ corporate HQ Projected 3.8% NOI yield in Year 1 with an underwritten long-term IRR of 8%– Expected Year 1-3 NOI growth of 44% following platform onboardingWatermarc at Biscayne Bay Purchase price: 211M Newly developed 296 apartment community– Located in Miami, FL– Located in the Edgewater neighborhood of Miami with proximity to premier entertainment,cultural, and employment attractions of Miami-Dade County– Proximity to Bay Parc additionally benefits AIR Projected 4.1% NOI yield in Year 1 with an underwritten long-term IRR of 8%– Expected Year 1-3 NOI growth of 34% from following platform onboarding4
The most efficient and most effective way to allocate capital to multi-family real estateLow, fixed cost leverage achieved in 15-months following SeparationBalance Sheet Progress Since Separation(1) Gross leverage reduced by 1.5BKey Balance Sheet Metrics (Pro Forma as of 3/31/2022)Floating Rate %No floating rate exposureWtd. Avg. Maturity (Yrs) Increased pool of unencumbered properties by 5.1B to 7.9B8.0Debt Repricing in Next 33 MonthsOnly 6% debt repricing through 2024 146MAttractive rate for 2022 3.6%Gross and Net now equal5.4xWtd. Avg. Interest (%) Net Leverage reduced 2.1x to 5.4x-%Net & Gross Leverage to EBITDA (x) Accessed the bond market– 100M of 5-year notes– 100M of 7-year notesShare Repurchase Activity– 200M of 10-year notes– Debentures priced at wtd. avg. YTM of 4.3%inclusive of treasury lock purchased inanticipation of the offering– Transaction anticipated to close in late June(1)(2) 72M of opportunistic share repurchasesduring Q2 2022 at an average 44.20 pershare, or 5% implied cap rate(2) Board authorization to repurchase up to 500M of common shares5.4x metric pro forma for (i) 159M of April property sales and (ii) 557.5M from AIV: 534M in payment of the note and 23.5M as a prepayment penalty.Per GSA and S&P Cap IQ as of 6/3/2022.5
The most efficient and most effective way to allocate capital to multi-family real estateFull Year 2022 Guidance: Q1 2022 Update2022 Pro Forma Run Rate & 2023 FFO In ContextUnderwriting Future FFO Growth Pro Forma Run Rate guidance of 2.19 FFO per share in 2022 as if Q1 2022 announcedtransactions were executed on 12/31/2021 2H 2022 FFO guidance of 1.16 at the midpoint includes full impact of announcedtransaction activity (including 500M of acquisition guidance, which includes 283Mannounced herein) Driven by ability to capturesubmarket demand and loss-tolease, while mitigating other factors(such as bad debt) Capital enhancements driveadditional growth (subject to IRRhurdles) Track record of productivity inmaintaining flat to decliningcontrollable operating expensehistorically External growth subject to disciplinedcapital allocation approachExternalGrowth Expected to benefit from the AIR Edgewith NOI growth at 2-3x marketlevels during the first 2-4 years ofownershipPropertyManagement Net expense expected to decline withgrowth Expected to convert into Same StoreNOI upon leasehold repurchaseSame StoreRevenue2H 2022 annualized of 2.32 provides framework by which 2023 may be underwritten–2H 2022 SSNOI estimated to be 20-25M greater than 1H 2022 –Incremental SSNOI, at the midpoint, bridges between AIR’s guidance on 2022 Pro FormaRun Rate FFO of 2.19 and 2H 2022 FFO annualized of 2.32Incremental 2023 SSNOI growth may be derived from: Earn in of market rental rates–Embedded within 2022 guidance is an anticipated year-end loss-to-lease of 7-9%–AIR would expect 40% of loss-to-lease to earn in to 2023 revenue growth if marketrents are unchanged with the remainder in 2024Further revenue growth may be achieved through higher occupancy or lower bad debt––Same StoreOperatingExpenseExpense growth may somewhat offset the aboveEvery 100 bps of SSNOI growth increases FFO per share by 0.025Includes 0.14 pershare from expectedprepayment penalty 2.41Lease Income 1.16G&A Expense 0.57 0.68Q1 2022FFO per Share(Actual)Q2 2022FFO per Share(Midpoint)InterestExpense2H 2022FFO per Share(Midpoint)2022 FFOper Share(Midpoint)Future projects expected to includesimilar lease support throughredevelopment period Growth limited with 15 bps of GAVcap backstopped by CEO Expected 3.6% weighted averagefixed cost from 2H 2022 forward6
The most efficient and most effective way to allocate capital to multi-family real estateAppendixCity Center on 7thPembroke Pines, FL7
AInvestment Case for AIRThe SterlingPhiladelphia, PA
The most efficient and most effective way to allocate capital to multi-family real estateWhat makes AIR a compelling investment?1Simple, predictablebusiness model2Diversification, focus,and strategy merita low risk premium3Market leading AIREdge operating platformdrives earnings growth High-quality, stabilized multi-family portfolio with focus on the same for external growth; no developmentEmphasis on productivity: (i) the AIR Edge and (ii) G&A at less than 15 bps of GAV drive higher FCF conversionLow debt Diversified by geography, location (urban vs. suburban), and price point, in high-quality markets wheredemand generates continued organic growthFocus on stable communities with great residents produces high retention, and revenue stabilityAttractive growth profile with limited operating and financial risk 4Disciplined capitalallocation enhancesFFO growth5Exceptional governanceand fully alignedManagement6Attractive valuation(1)(2)(3) Peer-leading(1) track record of cost control with (i) flat onsite controllable operating expenses and (ii) G&A atless than 15 bps of GAVDurable advantage through (i) NOI margin performance and (ii) conversion of Same Store Revenue to FCF at 9-10% higher than the peer average(1) compounds over timeSubstantial spread ( 200 bps ) over our weighted average cost of capital required for all investments– Recent investments underwritten at 8-10% unlevered IRRs compare to 2021 and 2022 property sales ata long-term expected IRRs of 6%Developing access to the full spectrum of debt and equity capital, both public and private, for broadestchoice with respect to the lowest WACC– Anticipate funding near-term growth through property sales and/or JVs given current trading levels Refreshed Board with diverse and relevant expertise; elected annually; average tenure of 4 years“At risk” compensation, primarily tied to TSR, aligns CEO and Management in driving value for shareholders Attractive absolute and relative valuationA 100 investment in AIR by a retail investor today would yield 3.67 on a post-tax basis, or 1.78 ( 95%)more than peer average(1)(2)(3)Per company filings. Peers defined as AVB, CPT, EQR, ESS, MAA, and UDR. Coastal peers defined as AVB, EQR, ESS, and UDR. Sunbelt peers defined as CPT and MAA.Assumes AIR’s dividend in 2021 was 67% return of capital and 33% capital gain. Peers averaged 62% ordinary income and 28% capital gain. Analysis assumes similar dividend treatment.Assumed tax rates: (i) federal ordinary income of 37% (29.6% for qualified 199A income), (ii) federal LTCG of 20%, and (iii) federal 1250 recapture of 25%. A 3.8% Net Investment Income Tax andillustrative 6.65% state tax is added to each respective federal rate.9
The most efficient and most effective way to allocate capital to multi-family real estate1 Simple, predictable business model Focus on high-quality, stabilized multi-family propertiesEight core, high-quality US marketsOrganic growth through peer-leading(1) operating efficiency of our AIR EdgeClearly articulated view of cost of capital and required returns for external growthNo developmentCash flow conversion enhanced by G&A cap at less than 15 bps of GAVLow leverageTarget dividend payout ratio at 75% of FFO(1)Per company filings. Peers defined as AVB, CPT, EQR, ESS, MAA, and UDR. Coastal peers defined as AVB, EQR, ESS, and UDR. Sunbelt peers defined as CPT and MAA.10
The most efficient and most effective way to allocate capital to multi-family real estate2 Diversification, and focus on creating stable communities limits operating risk Emphasis on “good neighbor” policies at the core of our offerings, which we enhance with excellent amenities High-quality residents prefer stable communities, canafford higher rents, and reduce costs through renewing– Drives financial stability and NOI margin performanceCSAT Scores(1)AIR CSAT Score4.27Kingsley Index4.304.27– Positive network effect attracts new demand We ask our residents to grade our every interaction toensure that we are customer-focused– “World class” customer satisfaction (“CSAT”)(1) scores of4.30 (out of 5) improved during and through COVID– TTM retention of 61.3% a record high for AIR– Only REIT amongStore Revenue Growth in 20214.054.0020172018201920202021AIR has consistently outperformed the Kingsley Index;Highly satisfied residents renew at 2x the frequency of less satisfied residents Among Coastal peers(2), AIR fell less in 2020 recoveredmore in 2021 and has sustained momentum in 2022Coastal peers(2) to4.124.094.064.334.30Year-Over-Year Same Store Revenue Growth (%)(2)202020212022 Midpoint Guidancegenerate positive Same9.8%9.2%10.6%4.9%1.8%-2.4%Lincoln PlaceVenice, CA(1)(2)Park Towne PlacePhiladelphia, PAPreserve at MarinCorte Madera, CABay ParcMiami, FL1.7%-1.8%-3.0%AIR CommunitiesCoastal PeersSunbelt PeersAIR CSAT score based on 45K resident responses in 2021. Kingsley Index is a proprietary index and is the standard for measuring customer satisfaction in the multi-family sector.Per company filings. Peers defined as AVB, CPT, EQR, ESS, MAA, and UDR. Coastal peers defined as AVB, EQR, ESS, and UDR. Sunbelt peers defined as CPT and MAA.11
The most efficient and most effective way to allocate capital to multi-family real estate3 The AIR Edge is our ability to provide exceptional service consistently due to our focus on culture,resident satisfaction, innovative technology, and continuous process improvement The AIR Edge is a durable operating advantage in driving organic growth, and scalable as our portfolio growsResident SelectionRevenue ManagementTechnologyStaffingCapital Improvements Emphasis on attracting “goodneighbors” which createsstability in our communities Pricing every unit, every daybased on pipeline ofprospective residents, andbalancing supply and demandwithin markets Artificial Intelligence (“AI”)informs decision making Work allocated to where it ismost efficient and effective In depth and regular review ofphysical property conditions Service technology platformallows for efficient work ordercompletion and supportsintegration of robotics Proprietary in-house rapidresponse teams supportteammates both onsite andoffsite Longstanding local marketrelationships that ensureaccess to contract labor Smart home technologyinstalled in all units – lowersturn, utility, and insurancecosts, while boosting revenue Specialization leads to betterperformance, for example inoffsite collections Use of AI to target identifiedmarket segments predisposedto be stable residents withlonger than average tenure,and in turn income to payhigher rents if earned by CSAT Active coordination betweenoffsite expert revenuemanagement and localproperty management teamsPhysicalProperties &UpgradesIT & TechnologyOrganizationalDesign & Staffing Disciplined offsite underwritingto identify capitalenhancement activityincreasing organic growthReal TimeAnalytics & ToolsPeople & CulturePassion for continuousimprovement12
The most efficient and most effective way to allocate capital to multi-family real estate3 AIR Edge emphasis on productivity drives NOI margin performance Focus creates outperformance in AIR’s Same Store portfolio, while makingpossible acquisitions with attractive returns on a risk-adjusted basisSame Store COE Growth (%)(1)(2)100.0 100.1100.6 100.699.998.398.698.195.795.1Same Store NOI Margin (%)(2)(3)99.599.295.772.8%Negative 10 bps growth CAGRin Same Store COE measuredover more than a decade(1)Indexed to 200968.2%2009 2010 2011 2012 2013 2014 2015 2016 2017 2018 2019 2020 20215-Year COE Growth CAGR (%)(3)65.0%1-Year COE Growth CAGR (%)4.0%1.6%-0.1%2.1%2016-0.3%AIR Communities(1)(2)(3)Peer-leading(2) Same Store NOI Marginover 20 consecutive quarters1.4%Coastal Peer Avg.20172018201920202021Sunbelt Peer Avg.Controllable operating expense (“COE”) defined as total same-store operating expenses less taxes, insurance, and utilities. Based on reported full year financials for 2009-2021.Per company filings. Peers defined as AVB, CPT, EQR, ESS, MAA, and UDR. Coastal peers defined as AVB, EQR, ESS, and UDR. Sunbelt peers defined as CPT and MAA.Same Store NOI Margin for Q1 2022 is presented net of 7.1M of utility reimbursements. Historical data is presented net of utility reimbursements as well. AIR views this metric as the best measure ofreal estate profitability given utility costs are a pass-through to the resident.13
The most efficient and most effective way to allocate capital to multi-family real estate3 with resulting NOI margin advantage compounding over time Same Store NOI Margin outperformance has resulted in 550 bps cumulativegrowth above the peer average since 2016(1)Compounded Same Store NOI Growth(1) (Indexed to 2016)132.3Accelerating NOI growth out ofCOVID with 2022 NOI guidance atthe top end of the peer group(1)123.0Peer Avg.: 117.4110.1201620172018AIR Communities(1)2019Coastal Peer Avg.202020212022MidpointGuidanceSunbelt Peer Avg.Per company filings. Peers defined as AVB, CPT, EQR, ESS, MAA, and UDR. Coastal peers defined as AVB, EQR, ESS, and UDR. Sunbelt peers defined as CPT and MAA.14
The most efficient and most effective way to allocate capital to multi-family real estate3 and driving significant flow-through for the benefit of shareholders 8% and 13% higher revenue required by Coastal and Sunbelt peers(1),respectively, to equal AIR’s Free Cash Flow conversion marginSame Store Revenue to Free Cash Flow Conversion (%)(2)Focus on efficiency results inhigher share of AIR’s rent growthbeing available for accretive uses64.7%65.3%60.5%60.7%55.9%2021Q1 20222021AIR Communities(1)(2)Q1 2022Coastal Peer Avg.202157.7%Q1 2022Sunbelt Peer Avg.Per company filings. Peers defined as AVB, CPT, EQR, ESS, MAA, and UDR. Coastal peers defined as AVB, EQR, ESS, and UDR. Sunbelt peers defined as CPT and MAA.Reflects Q1 2022 and 2021 financials as reported in company filings. Free Cash Flow Conversion % defined as Same Store NOI less Net Property Management and G&A Expense, and divided by SameStore Revenue. Please see appendix for additional detail.15
The most efficient and most effective way to allocate capital to multi-family real estate4 We employ a highly disciplined approach to capital allocation Our weighted average cost of capital (“WACC”) implicit in our internal GAV expressed as an unlevered IRR is 6% A substantial spread to our WACC, generally 200 bps of IRR or more, is required for all investment activity Each transaction is recommended first by our Investment Committee, then decided by our independent directors– Our Investment Committee – chaired by John McGrath – includes AIR’s executive leadership teamExternal Growth Capital EnhancementsFramework for assessing quality of target opportunities: – Markets: Expected growth in local economies, submarket supplyconstraints, and predictable laws and regulationsInvest where the expected rent premium (relative tomarket) drives long-term value Long-term IRR minimum target of 10% on average– Equates to low double digit NOI yields– Portfolio: Diversification across markets, type, and price point– Rents: Relative to local market averages– Operations: Ability to drive higher growth through the AIR Edge,especially when first added to our platform Acquisitions must be accretive to near-term FFO– Underwriting reflects deployment of the AIR Edge to ensure performancelevels and returns are achieved We will use leverage only within our targeted range of 5.0x to 6.0xWe aim to source capital from the broadest range, and develop a menu of low-cost options for AIRDebtEquity Bank debt: line of credit and term loans Sale of lower rated properties Corporate debt: private and public Sale of JV interest(s) Secured debt Issuance of common shares / OP units16
The most efficient and most effective way to allocate capital to multi-family real estate4 Investment results demonstrates the value of the AIR Edge Acquisitions consistently underwritten to drive significant near-term NOI growth– Class of 2021(1) acquisitions outperforming initial underwriting Execution of business plans driven by the AIR Edge can generate a 30% uplift in property value (2)Acquisition Underwriting: Class of 2021(1)(3)Acquisition Underwriting: Class of 2022(1)(3)Key Growth Drivers: Bringing rents in line withsubmarket demand4.2%5.6%5.2%4.1%5.5%5.5%4.1%3.8% Implementation of “goodneighbor” policies and improvedresident selection Physical upgrades andintroduction of new amenities AIR platform onboarding CultureYear 1Year 3City CenterYear 1 – Year 3NOI Growth (%)UnderwrittenUnlevered IRR(4)Year 1Year 3DC PortfolioYear 1Year 3Coconut PointYear 1Year 3Biscayne Bay 22% 37% 44% 34%9%9%8%8% Staffing model and work flowboth onsite and corporate HQ Deployment of technology suiteQ1 2022 blended lease growth of 24.0% forthe Class of 2021 acquisitions compares to14.4% for AIR’s Same Store portfolio(1)(2)(3)(4)Class of 2021 acquisitions defined as City Center on 7th, North Park, Huntington Gateway, Vaughn Place, and Residences at Capital Crescent Trail. Class of 2022 acquisitions defined as the Reserve atCoconut Point and Watermarc at Biscayne Bay.Property value assumed at Year 1 NOI cap rate based on Year 3 NOI, net of capital.Reflects underwritten Year 1 and Year 3 normalized NOI yield for each respective acquisition inclusive of incremental capital enhancement spend.Underwritten IRR assumes a 10-year hold period.17
The most efficient and most effective way to allocate capital to multi-family real estate5 Our Board has depth in expertise, and reflects a best-in-class approach to governanceGovernance Highlights Refreshed Board with five newindependent directors in the last twoyears, with eight (of nine) independent– Diverse and relevant expertise– Average independent director tenure of 4 years, and age of 63– Directors elected annually– Chairman and CEO separated Cannot stagger the Board withoutshareholder approval Shareholder proxy access and ability tocall special meetings Majority vote standard (incl. directorresignation in a majority against vote) Peer-leading(1) “Say on Pay” withhighest level of support among multifamily peers over the last five years Directors actively making open marketpurchases of AIR shares– 6.7K shares acquired over YTDExperienced Board of DirectorsTerry ConsidineMargarita Paláu-Hernández Director since 1994 CEO, AIR Communities Prior experience includes Chairman & CEO of Aimcothrough the December 2020 Separation In 1975, founded and managed predecessor companiesthat became Aimco at its IPO in 1994 Member of the Board of Aimco Director since 2021 Founder and CEO, Hernández Ventures Nominated to serve as Representative of the US to the73rd Session of the General Assembly of the UN with thepersonal rank of Ambassador Member of the Board of Occidental, Xerox, and Conduent Member of the Board of Reagan UCLA Medical Center andNat’l Museum of the American Latino at the SmithsonianThomas KeltnerJohn Rayis Director since 2007 Prior experience includes EVP and CEO-Americas andGlobal Brands at Hilton Hotels, various leadership roles(incl. President, Brand Performance & Development) withPromus Hotels, various leadership roles with Holiday InnWorldwide, President of Saudi Marriott Company, andmanagement consulting with Cresap, McCormick & Paget Director since 2020 Prior experience includes Partner, Tax, Skadden, Arps,Slate, Meagher & Flom LLP Currently an Adjunct Professor of Law at StetsonUniversity College of Law Member of the Board of The University of Chicago MedicalCenterThomas BohjalianAnn Sperling Director since 2021 Prior experience incudes EVP and Senior PortfolioManager, as well as Head of US Real Estate and Tradingdepartments at Cohen & Steers where he wasconsistently ranked in the top decile of all real estate fundmanagers Director since 2018 Prior experience includes Senior Director of TrammellCrow, President, Markets West of JLL, Managing Directorof Catellus, and Senior Managing Director & Area Directorof Trammell Crow Member of the Board of SmartRent, and Advisory Boardsof Cadence Capital and the Gates Center for RegenerativeMedicineKristin Finney-CookeNina Tran Director since 2021 Managing Director, JP Morgan Multi Asset Solutions Group Prior experience includes Senior Consultant and Co-Chairof Diverse Manager Advisory Committee at NEPC,Principal at Mercer, and Credit Suisse First Boston Member of the Boards of Chicago State UniversityFoundation and Ann & Robert Lurie Children’s Hospital ofChicago Medical Center IDirector since 2016 CFO of Pacaso Prior experience includes CFO of Veritas Investments,CFO of Starwood Waypoint Residential Trust, variousleadership roles focused on the merger integration of AMBand Prologis, and PricewaterhouseCoopers Member of the Board of American Assets Trust, andAdvisory Board of the Asian Pacific FundDevin Murphy Director since 2020 President, Phillips Edison & Company Prior experience includes Vice Chairman, Morgan Stanley,Global Head of Real Estate Investment Banking, DeutscheBank, and various leadership roles at Morgan Stanleyincluding Co-Head of US Real Estate Investment Bankingand Head of Real Estate Private Capital Markets Member of the Board of CoreCivic(1)Recognized by Women’sForum of New York forhaving at least 30% of Boardseats held by womenPer company filings. Peers defined as AVB, CPT, EQR, ESS, MAA, and UDR. Coastal peers defined as AVB, EQR, ESS, and UDR. Sunbelt peers defined as CPT and MAA.Recipient of 2021 GenderBalanced Board award fromBoardbound by Women’sLeadership Foundation18
The most efficient and most effective way to allocate capital to multi-family real estate5 Exceptional, long-tenured Management team strengthened with new talentStrong Management Alignment 90% of CEO compensation linked toperformance with 100% of LTI based on3-year forward relative TSR performanceDirector &Chief Executive OfficerPresident &General CounselPresident,Property OperationsExecutive Vice President& Chief Financial OfficerTerry ConsidineLisa CohnKeith KimmelPaul Beldin51 Years ofAIR Experience20 Years ofAIR Experience20 Years ofAIR Experience14 Years ofAIR Experience– Other AIR executives have 66% of LTI“at risk” based on the same 3-yearforward relative TSR Required stock ownership of 5x basesalary for our CEO, President, and CFO,and 4x for other executive officers Peer-leading(1) “Say on Pay” withhighest level of support among multifamily peers over the last five yearsHistorical “Say On Pay” Shareholder Support %(1)97.8%98.5%92.4%92.0%20172018AIR98.7%97.9%Core of executive management has spent the last 14 years working togetherSenior Vice President,Chief CorporateResponsibility OfficerExecutive Vice President,Strategy, CapitalAllocation, & Co-CIOExecutive Vice President,Co-CIOSenior Vice President,Capital Markets97.0%93.2%92.6%92.6%201920202021Patti ShwayderJohn McGrathJoshua MinixMatthew O’Grady19 Years AIR Experience6 Years of AIR ExperienceJoined Q3 2021Joined Q4 2021Peer Avg.Identified gaps created by the Separation and strengthened ourselveswith new talent to support transactions and external growth(1)Per company filings. Peers defined as AVB, CPT, EQR, ESS, MAA, and UDR. Coastal peers defined as AVB, EQR, ESS, and UDR. Sunbelt peers defined as CPT and MAA.19
The most efficient and most effective way to allocate capital to multi-family real estate6 Attractive valuation for AIR on an absolute and relative basis Common equity not currently an attractive source of capital for near-term growth– Property sales and/or joint ventures expected to provide the most attractive WACC– We will not pursue investments unless accretive to near-term FFO, and at a substantial IRR spread to our WACCPremium / (Discount) to(1)(2)Gross Asset ValueNet Asset ValueImplied Trading Metrics(1)(2)Implied Cap Rate (%)2022E FFO tPeersAIR 8.0%-24.4%CoastalPeers4.9%Coastal PeersSunbelt PeersCoastalPeersSunbeltPeersAt 2.19Pro FormaRun RateGuidance Target payout ratio at 75% of FFO 4.1% dividend yield compares to a peer average(2) of 3.0% A 100 investment in AIR by a retail investor today would yield 3.67 on a posttax basis, or 1.78 ( 95%) more than peer average(2)(3)Per GSA and S&P Cap IQ as of 6/3/2022.Per company filings. Peers defined as AVB, CPT, EQR, ESS, MAA, and UDR. Coastal peers defined as AVB, EQR, ESS, and UDR. Sunbelt peers defined as CPT and MAA.Assumes AIR’s dividend in 2021 was 67% return of capital and 33% capital gain. Peers averaged 62% ordinary income and 28% capital gain. Analysis assumes similar dividend treatment.Assumed tax rates: (i) federal ordinary income of 37% (29.6% for qualified 199A income), (ii) federal LTCG of 20%, and (iii) federal 1250 recapture
-Located in Estero, FL -Submarket between Naples and Fort Myers that is part of a 500-acre master planned community -Short walk to Hertz' corporate HQ Projected 3.8% NOI yield in Year 1 with an underwritten long-term IRR of 8% -Expected Year 1-3 NOI growth of 44% following platform onboarding The Reserve at Coconut Point