Transcription
CO-OPERATIVE BANK OF KENYAGROUP FINANCIAL RESULTSANALYST BRIEFINGQ3 201919 November 20191
Macro EconomicHighlights22
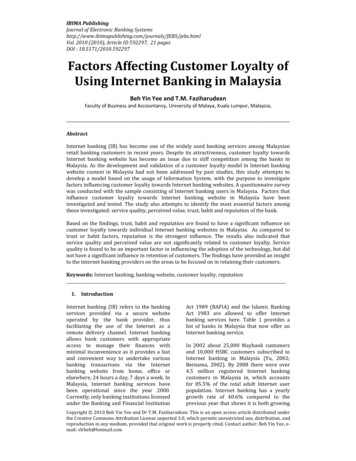
GROSS DOMESTIC PRODUCT (GDP) GROWTH ROSE TO 6.3% IN 2018 Kenya’s economic performance for the second quarter of 2019 generally softened to 5.6% compared to 6.4% in asimilar period in 2018. Higher growth was recorded in ICT, food & hotels , transport and the public sector.Charts on trend and contribution to quarterly GDP growth rateSecond Quarter Real GDP GrowthRateContribution to real GDP growth, 85.6%5.6%4.5%PercentageReal Estate6.4%6.2%Prof, admin services0.0162Q 20190.0122Q 20180.0082Q 20170.0042Q 201602Q 2015Mining,Quarrying2Q 2014Hotels, Restaurants33
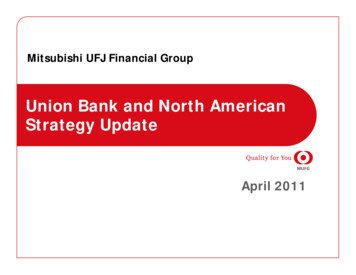
SHORT TERM INTEREST RATES The money market remained fairly stable in the nine months to September 2019. Yields on short term paper continued on a marginal fall during the nine months to September 2019. Interest rate on 91-days, 182-days and 364-days Treasury bills were 6.4%, 7% and 9.4%, respectively at the close ofSeptember 2019 compared to 7.6%, 8.8% and 9.8%, respectively at the close of September 2018. Average interbank rate also fell to 3.6% in the nine months to September 2019 compared to 5.3% in a similarperiod in 2018 indicating generally higher liquidity in the banking sector on average.Short term Interest 1-Day TbillApr-19May-19364-days TbillJun-19Jul-19Interbank RateAug-19Sep-19Central Bank RateOct-1944
INFLATION RATE LOW AND STABLE Overall inflation rate touched 3.8% in September 2019 supported by declining food prices. It has trended slightly upwards in the nine months to September 2019 to average 5.1% compared to 4.4% in a similarperiod last year. The main driver was a rise in food prices in the months of April and June 2019. Fuel inflation has however fallen to 7% in the nine months to September 2019 from 11% in 2018 due to the fall inglobal fuel prices. Overall inflation figures are likely to remain within the Government range of 2.5% to 7.5% in most of the year.55
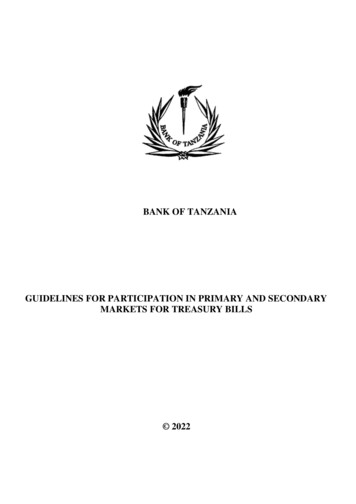
THE CURRENCY HAS REMAINED FAIRLY STABLE The KES exchange rate to the USD averaged 101.8 in the nine months to September 2019 compared to 101.3 in asimilar period in 2018. The KES is currently trading at an average of 103.2 against the USD. Going forward, increasingly loose monetary policy in the US implies less pressure on the USD/KES exchange rate inthe near term.12-Month Current Account Balance (% of 3.16Average USD/KES Exchange Rate2014201520162017-4.8-6.7100.0-6.2Yr toJuly2018-5.52018-5Yr toJuly20192019proj.-4.2-4.599.098.0-10.566
TREND IN PRIVATE SECTOR CREDIT GROWTH The 12-month growth in private sector credit has risen to 6.3% in August 2019 from 3% in January 2019. This compares to 4.3% growth registered in August 2018.Private Sector Credit Growth (%)7.0%Percentage6.0%5.0%4.0%3.0%2.0%1.0%0.0%77
SOUTH SUDAN The economy is estimated to have recovered with a growth rate of 3.2% in FY 2018/19, from acontraction of 3.5% during FY2017/18. Overall rate of inflation averaged 60.8% during FY2018/19 down from 121.4% in the FY 2017/18. The current account deficit, excluding grants, rose to 6.5% of GDP during FY2018/19 from 4.5% in FY2017/18 The main challenge going forward is to ensure sustainability of peace and security in the country. With the timeline for the formation of a transitional power-sharing government now set for February2020, we hope that progress will be made on key milestones such as the unification of the army anddecision on the country’s states and boundaries.88
Strategic Focus99
Our Strategic Focus Optimal returns Sustainability/ Marketshare growthOUR SHAREHOLDERSOUR CUSTOMERSKEYSTAKEHOLDERSOUR STAFFOUR ENTERPRISETHE COMMUNITY Customer centricity Digitized customer journeys Employer of choice Staff productivity Operational efficiency Proactive Risk management Optimal digital strategy Responsible Corporate Citizen Sustainable Economic, Social &Environmental Impact1010
Co-operative Bank of Kenya GroupCo-operative Bank of Kenya Group StructureCo-operative Bank of South Sudan LtdCoopHoldingsCoop SocietyLtd(64.56%)(51%)Co-operativeBank of KenyaLtdCo-op Consultancy and Insurance Agency Ltd(100%)Co-optrust Investment Services Ltd(100%)Kingdom Securities LtdMinorityShareholders(35.44%)(60%)Co-operative Insurance Society Ltd(33.41%)Co-op Bank Fleet Africa Leasing Limited(25%)1111
Our Presence157 BranchesKshs. 440.8BTotal Assets4.7 Million Mcoop cash mobilebanking16000 Co-op Kwa Jirani Agents586 ATMs45418.7 MillionCustomersStaff89K CoopNet- Internet Banking464 Sacco Front Offices Branch network16K Diaspora Banking Customers1212
Our Business: A Successful Universal Banking ModelWe enable our customers to;SaveBorrowInvestInsureRetail and Business Banking (Kshs.148B Loan Book)Corporate, Government & Institutional Banking (Kshs.110B Loan Book)Co-operatives Banking (Kshs.29B Loan Book)Fund management (Over Kshs.96.7B, FY2018 Kshs. 40.5B)Consultancy and capacity building for the Co-operative movement (2800 mandates todate)Insurance Brokerage 26% (YoY) growth in Insurance CommissionStock BrokerageLeasing- Kshs.200M Disbursed in 20191313
“Soaring Eagle” Transformation InitiativesKey Pillars;.1Branch Transformation: Customer Experience & Retail SFE2MSME Transformation3Sales Force Effectiveness4Shared Services & Digitization ‘The Digital Bank’5NPL Management & Credit processes6Cost Management7Data Analytics8Staff Productivity1414
“Soaring Eagle” Transformation InitiativesE-Credit FocusKshs. 27B Disbursed in2019.Omni ChannelMSME 4000 trained 56,800 Onboarded 120,340 Loans DisbursedSector FocusCore Banking SystemRe-organized RelationshipModelsProactive NPL ManagementPredictive Data AnalyticsSustained StaffProductivity1515
Championing Social Economic EmpowermentCo-op Consultancy &Co-op FoundationInsurance Agency Ltd 7032 students supported to date 2800 Consultancies 2019 (2856) 2018 (2826) 19 Dedicated Over 1.1 Billion since inception (2019-Consultants Over 149Million)464 FOSA- Financial Other Programmes with;Inclusion Deepening Ford Foundation Embassy of Finland Energy De Portugal Financing the SME and MCUsector Sustainablefinancingtowards; Big 4 Agenda Vision 2030 and MDGs Staff CSR Involvement CorporateSocialResponsibility: First Lady’sBeyondZeroCampaign2019 (Kshs.20 Million)1616
Award Winning BrandKENYA BANKERS ASSOCIATION: CATALYST AWARDS 2019Overall Winner Winner: Client case study- Financing SME2nd - Best in sustainable finance3rd - Client Case study-Financing Commercial Clients2nd - Bank case study-Bank Operations2nd - Bank case study- Financing and supporting clients in the informal sector3rd - Most Innovative BankGLOBAL SME FINANCE AWARDS 2019 Product innovation of the yearFINANCIAL REPORTING AWARDS Winner: Environmental SKENYA ASSOCIATION OF MANUFACTURERS Best Bank in Sustainable Finance in Kenya - 20191717
Net Interest Income2321323,1972,246Total OperatingExpenses1756525895,7294,866Total OperatingIncomeQ32018Q32019Customer Deposits Total ShareholdersFunds235212241Owns 31% ofCIC AfricaLtd- SouthSudanTotal Assets826Loans andAdvances (Net)8245 Non-oilcollectioncenters.1,5994 branches inJuba1,948Regional Business (Kshs. Million)Q32018Q32019Profit Before Tax1818
ChannelPerformance1919
Growing Digital Channels89% of our29,277Agency BankingATMQ32019Internet Banking Branch Banking3594811,5941,745Mco-op Cash10,144E-Credit is a key focusarea, Kshs. 27Bdisbursed Year to Date13,14727,339Transactions are onalternative Channels32,81727,03335,99138,006Channel Transactions ‘000’Merchant/POSBankingQ320182020
E-CreditCumulative Mcoop Cash Loan Customer Numbers ( In '000’)4,190E- Flexi2,982Business2,069Unsecured Business Plus1,389FY 2014694388183FY201512%FY 0915,19612,89510,1024,8651,644225Cummulative MCo-op Cash loan Book - In MillionsQ320197%48,07428E-CREDIT – KEY GROWTHFOCUSFY 2014 FY2015 FY 2016 FY2017 Q12018 Q22018 Q32018 FY2018 Q12019 Q22019 Q3201981%2121
Transactions - Millions38Deposits through Mobile(Billions)9327MOBILEBANKING(MCOOP CASH)LeveragingMobile Bankingto growcommissions70Q32018Q32019Commissions - Millions3,3741,353Q32018Q32019Q32018Q320192222
No. of l No. of Transactions(Million)36GrowingCo-op KwaJiraniAgencyBankingTotal Revenue (Million)Q32018373Q32019Deposits Generated by Agents THDRAWALJan Feb Mar Apr May Jun Jul Aug Sep Oct Nov Dec Jan Feb Mar Apr May Jun Jul Aug Sep23'18 '18 '18 '18 '18 '18 '18 '18 '18 '18 '18 '18 '19 '19 '19 '19 '19 '19 '19 '19 '1923
FinancialHighlights2424
Strong Financial Position (Kshs. Billion)Total AssetsLoan book (Net)440.8268.9404.2254.2Q32018Q32019Q32018Total DepositsShareholders 0192525
Strong Financial PositionPosition (Kshs.(Kshs. Billion)Billion)Q32019Q32018% Change(YoY)FY2018Total Assets440.8404.29.1%413.4Loan book 68.8%306.6Borrowed Funds29.726.014.4%23.9Shareholders Funds73.970.94.3%69.98.77.614.5%Kshs. BillionsGovernment SecuritiesTotal DepositsNo. of account holders (Millions)8.02626
Diversified loan bookCorporateMortgageAsset 01838.4%Q32019AgribusinessSacco2727
Diversified loan bookQ32019Tourism, Restraurant & HotelsQ320181%1%Personal consumer37%11%Real Estate9%8%Transport & Communication14%15%Trade2%2%Building & construction6%7%Energy & l servicesMining & Quarrying42%0%0%2%2%2828
Well-diversified Liability Portfolio21.4%18.7%Institutional Banking5.2%21.9%11.1%13.4%Government 3%RetailAgribusinessDeposit Distribution Q320197.4%7.6%Corporate gs AccountsCurrent AccountsFixed DepositTransaction AccountsCall Deposits2929
Optimally balanced Kenya Shilling asset & funding bookFUNDING(Local Vs Foreign Currency Q32019)3%LOAN BOOK(Local Vs Foreign Currency) Q320198%89%12%88%Foreign Currency DepositsForeign Currency Borrowed FundsLocal Currency FundingForeign CurrencyLocal Currency3030
Quality Loan Book - 0%259,621100%LossTOTAL (GROSS)ProvisionsNET LOAN BOOKGross 8243,54629,47429,32528,9533131
Quality Loan Book – Bank (IFRS 9)Stage/GradeExposure (Kshs. B)Provision (Kshs. B)Stage 1231.252.76Stage 226.560.80Stage 329.4716.45Grand Total287.2820.01323232
Portfolio Trends – Specific Sector NPL By Sector 6%19%17%21%46%65%Q320183333
Portfolio Trends – Sector NPL By Total Bank NPL 3%14%14%29%32%Q320183434
Adequate CoverageCost of RiskCoverage CBK (IncludesGen. Prov.)Coverage (IFRS) ExcludesGeneral Q32018Q32019Q32018Q320193535
Strong capital to support future growthCore Capital / Total Risk WeightedAssetsTotal Capital / Total Risk WeightedAssetsCore Capital/ Total depositLiabilitiesMinimum Statutory RequirementMinimum Statutory RequirementMinimum Statutory %14.5%Q32018Q32019Q32018Q32019Q32018Q320193636
Optimal Asset and Funding MixAssetCategories12%6%Net rities10%Cash and CashEquivalentOther AssetsOther ash and CashEquivalent6%Deposits17%Net fundsOtherliabilities3737
Strong liquidity to support investmentsLiquidityLoans to Deposits Borrowed Funds80%79%45%75%42%76%70%Q32018Q3201965%Loans to Deposit85%60%83%55%50%Q32018Q32019Q32018Q320193838
Improved Subsidiary ContributionCOMPANYThe Co-operative Bank of Kenya LimitedCo-op Consultancy & Ins Agency LimitedCo-op trust Investments LimitedKingdom Securities LimitedCo-operative Bank of South SudanTotal PBT before eliminationsAdd: Share of profit from associatesGroup profit before taxIncome tax expenseGroup profit after taxProfit Before TaxQ32019KShs’000Profit Before 10239,3126%10,883,74410,313,936569,8086%3939
Sustainable Profitability GrowthKshs. Billions (except for EPS)Interest IncomeInterest ExpenseNet Interest IncomeFees & CommissionsForex IncomeOther IncomeTotal Operating IncomeLoan Loss ProvisionStaff CostsOther Operating ExpensesProfit Before Tax and Exceptional ItemsShare of profit of associateProfit Before TaxTaxProfit After TaxBasic Annualized EPSQ32019Q32018% .990.1718.165.4212.732.174040
Key Ratio’sReturn On Average Assets(ROAA)3.5%3.4%Return On Average Equity(ROAE)19.9%Earnings Per Share (EPS)2.4720.0%2.34Q32018Q32019NIM on Earning Assets8.0%Q32018Q32018Q32019CIR without provisons51.2%50.2%Q32018Q32019Q32018NIM on Loans8.5%7.5%7.2%Q32019Q32019Q32018Q320194141
2019 Financial OutlookActualQ320195.5%Actual FY 201810.7%ProjectionsFY .2%40%20.0%18.3%22%3.4%3.2%3.5%Non Performing Loans (NPL)10.5%11.1%10%Cost of average funds including borrowed funds3.6%3.8%3.6%Net Interest Margin (NIM)7.5%9.4%8.0%Cost of risk1.1%0.7%1%Profit Before Tax GrowthLoans & Advances GrowthDeposits GrowthCost to Income RatioNon Funded to Total IncomeReturn On Average Equity (ROAE)Return On Average Assets (ROAA)4242
ThankYou4343
Our Business: A Successful Universal Banking Model We enable our customers to; Leasing- Kshs.200M Disbursed in 2019 Co-operatives Banking (Kshs.29B Loan Book) Retail and Business Banking (Kshs.148B Loan Book) Consultancy and capacity building for the Co-operative movement (2800 mandates to date) Insurance Brokerage 26% (YoY) growth in Insurance Commission Corporate, Government & Institutional .