Transcription
ANNUAL MANAGEMENT REPORT OF FUND PERFORMANCEBMO Equal Weight Banks Index ETF (ZEB) (the “ETF”)For the 12-month period ended December 31, 2021 (the “Period”)Manager: BMO Asset Management Inc. (the “Manager” and “portfolio manager”)Management Discussionof Fund PerformanceInvestment Objective and StrategiesThe ETF seeks to replicate, to the extent possible, theperformance of an equal weight diversified Canadian bankindex, net of expenses. Currently, the ETF seeks to replicatethe performance of the Solactive Equal Weight CanadaBanks Index (the “Index”). The investment strategy of theETF is to invest in and hold the constituent securities of theIndex in the same proportion as they are reflected in theIndex. The Manager may also use a sampling methodologyin selecting investments for the ETF. As an alternative to orin conjunction with investing in and holding the constituentsecurities, the ETF may invest in or use certain OtherSecurities (as defined in the prospectus) to obtain exposureto the performance of the Index.RiskThe risks associated with an investment in the ETF remainas disclosed in the ETF’s most recent prospectus or anyamendments thereto and ETF facts. During the Period,there were no changes to the ETF that materially affectedthe overall risk level associated with an investmentin the ETF. The Manager reviewed the ETF using thestandardized investment risk classification methodologyprescribed by National Instrument 81-102 Investment Fundsand determined on January 14, 2021 that the risk ratingof the ETF had not changed. The Manager reviews theETF’s investment risk level and reference index, if any, atleast annually.Results of OperationsThe ETF outperformed the broad-based S&P/TSX CappedComposite Index by 14.17%. However, the more appropriatecomparison is to the Solactive Equal Weight CanadaBanks Index (the “Index”), due to the concentration of theportfolio in Canadian commercial banks. The ETF returned39.26% versus the Index return of 40.06%. The change intotal net asset value during the Period from approximately 1,399 million to approximately 2,697 million had noimpact on the performance of the ETF. The difference inthe performance of the ETF relative to the Index during thePeriod (-0.80%) resulted from the management expenseratio (-0.48%), and the impact of sampling and certainother factors (-0.32%), which may have included timingdifferences versus the Index, and market volatility.Market ConditionsCanadian equities continued to recover in 2021, with theS&P/TSX Capped Composite Index hitting new all-timehighs and earnings consistently beating expectations. TheCanadian equity market, as measured by the S&P/TSXCapped Composite Index, returned 25.1% during the Period.The Bank of Canada (“BoC”) held its target overnight rate at0.25% over the Period to support the economic recovery. Asoptimism about COVID-19 vaccines improved, expectationsfor a strong economic recovery also improved. The Energysector performed well during the Period as demand for oilincreased and production remained low. The West TexasIntermediate (WTI) oil price began the Period at US 48 perbarrel and closed the Period at US 75 per barrel. CanadianThis annual management report of fund performance contains financial highlights but does not contain the complete annual financialstatements of the ETF. If the annual financial statements of the ETF do not accompany the mailing of this report, you may obtain a copy ofthe annual financial statements at your request, and at no cost, by calling 1-800-361-1392, by writing to us at BMO Asset Management Inc.,250 Yonge Street, 7th Floor, Toronto, Ontario, M5B 2M8 or by visiting our website at www.bmo.com/etflegal or SEDAR at www.sedar.com.You may also contact us using one of these methods to request a copy of the ETF’s interim financial report, proxy voting policies andprocedures, proxy voting disclosure record and/or quarterly portfolio disclosure.
BMO Equal Weight Banks Index ETFbanks continued to outperform as loan loss provisionswere reduced, and revenue growth remained strong anddiversified across business lines.stability of global financial markets. It is uncertain how longthe hostilities, economic sanctions and market instabilitywill continue and whether they will escalate further.In terms of individual stock contributors, Bank of Montrealand The Toronto-Dominion Bank contributed the most tothe ETF’s performance, and while also positive, Royal Bankof Canada and National Bank of Canada contributed theleast to performance.Related Party TransactionsManagement Fee ReductionOn September 1, 2021, the ETF reduced its annualmanagement fee rate from 0.55% to 0.25%.Recent DevelopmentsLike many other developed economies, Canadian equitieswill be facing rising rates as the BoC looks to tightenmonetary conditions by raising its overnight rate. Currently,as measured by Overnight Interest Rate Swaps (OIS), themarket is anticipating close to six rate hikes by the BoCin 2022. While its unlikely that they will raise rates insix out of the eight scheduled meetings, higher rates areimminent. Even with inflation proving to be sustained, it isanticipated that the BoC will not risk overshooting on ratehikes in order to avoid stalling the economy and potentiallycausing stagflation (high inflation combined with highunemployment and slowing economic growth). As a result,it is expected that economic growth will remain positive,but at a lower rate than 2021. Although equities in generalare expected to face greater headwinds in 2022, such ashigher inflation, rising rates, the U.S. mid-term electionsand geo-political tensions, Canadian equities could be wellpositioned as its market is tilted towards sectors that arecyclical in nature.Canadian banks could perform well in the period aheadgiven the demand for services are anticipated to remainstrong. Strong economic growth will be a positive forloans, mortgages, asset management services and capitalmarket transactions. The recent strong earnings of bankshave led their valuations to remain attractive on a price-toearnings (P/E) perspective relative to the broader market.In addition, a potentially steeper yield curve may benefitCanadian banks.In February 2022, hostilities commenced in Ukraine. Inresponse, a number of countries have imposed economicsanctions on Russia and certain Russian citizens andentities. The impact of the hostilities, economic sanctionsand other measures may have wide-ranging global effects onprice volatility for securities and commodities as well as theFrom time to time, the Manager may, on behalf of the ETF,enter into transactions or arrangements with or involvingother members of BMO Financial Group, or certain otherpersons or companies that are related or connected to theManager (each a “Related Party”). The purpose of thissection is to provide a brief description of any transactionsinvolving the ETF and a Related Party.ManagerThe Manager, an indirect, wholly-owned subsidiary of Bankof Montreal (“BMO”), is the portfolio manager, trustee andpromoter of the ETF. The Manager is paid a managementfee by the ETF as compensation for its services, whichis described in the “Management Fees” section later inthis document.Designated BrokerThe Manager has entered into an agreement withBMO Nesbitt Burns Inc., an affiliate of the Manager, toact as designated broker and dealer for distribution ofBMO exchange traded funds, on terms and conditions thatare comparable to arm’s length agreements in the exchangetraded funds industry. The material terms and conditions ofthe agreement have been disclosed in the ETF’s prospectus.The Manager has also entered into agreements with certainother registered dealers in Canada to act as dealers forthe creation and redemption of units of BMO exchangetraded funds.Buying and Selling SecuritiesDuring the Period, the ETF relied on standing instructionsprovided by the independent review committee (“IRC”) forany of the following related party transactions that may haveoccurred in the ETF (each, a “Related Party Transaction”):(a) investments in securities issued by BMO, an affiliate ofthe Manager, or any other issuer related to the Manager;(b) investments in a class of non-government debt securitiesand/or equity securities of an issuer during the period ofdistribution of those securities to the public and/or the60-day period following the distribution period whereBMO Nesbitt Burns Inc., an affiliate of the Manager, or anyother affiliate of the Manager acted as an underwriter inthe distribution;(c) trades in debt securities in the secondary market withBMO Nesbitt Burns Inc., an affiliate of the Manager, that istrading with the ETF as principal; and
BMO Equal Weight Banks Index ETF(d) trades of a security from or to, another investmentfund or a managed account managed by the Manager or anaffiliate of the Manager.In accordance with the IRC’s standing instructions, inmaking a decision to cause the ETF to enter into a RelatedParty Transaction, the Manager and the portfolio managerof the ETF are required to comply with the Manager’swritten policies and procedures governing the Related PartyTransaction and report periodically to the IRC, describingeach instance that the Manager relied on the standinginstructions and its compliance or non-compliance with thegoverning policies and procedures. The governing policiesand procedures are designed to ensure that each RelatedParty Transaction (i) is made free from any influence ofBMO, BMO Nesbitt Burns Inc. or an associate or affiliate ofBMO and/or BMO Nesbitt Burns Inc. and without taking intoaccount any considerations relevant to BMO, BMO NesbittBurns Inc. or an associate or affiliate of BMO and/orBMO Nesbitt Burns Inc.; (ii) represents the businessjudgment of the Manager, uninfluenced by considerationsother than the best interests of the ETF; and (iii) achievesa fair and reasonable result for the ETF.Brokerage CommissionsThe ETF pays standard brokerage commissions at marketrates to BMO Nesbitt Burns Inc., an affiliate of the Manager,for executing a portion of its trades. The brokeragecommissions charged to the ETF (excluding exchange andother fees) during the periods were as follows:Total brokerage commissionsBrokerage Commissions paid to BMO Nesbitt Burns Inc. 2021202025,6742,35618,488835Financial HighlightsThe following tables show selected key financialinformation about the ETF and are intended to helpyou understand the ETF’s financial performance for theperiods indicated.The ETF’s Net Assets per Unit(1)Financial years ended Dec. 3120212020201920182017 28.9729.3026.2029.7126.84 .17)3.201.17(0.17)1.21(4.99)1.06(0.17)3.83(0.85) 10.752.374.03(2.78)3.87 0.070.080.9729.71Listed CAD UnitsNet assets, beginning of periodIncrease (decrease) from operationsTotal revenueTotal expenses(2)Realized gains (losses) for the periodUnrealized gains (losses) for the periodTotal increase (decrease) fromoperations(3)DistributionsFrom net investment income(excluding dividends)From dividendsFrom capital gainsReturn of capitalTotal Annual Distributions(4)Net assets, end of periodThis information is derived from the ETF’s audited annual financial statements.Includes commissions and other portfolio transaction costs and withholding taxes.(3)Net assets and distributions are based on the actual number of units outstanding at the relevanttime. The increase/decrease from operations is based on the weighted average number of unitsoutstanding over the financial period. This table is not intended to be a reconciliation of beginningto ending net assets per unit.(4)Distributions were either paid in cash or reinvested in additional units of the ETF, or both.(1)(2)Ratios and Supplemental DataFinancial years ended Dec. 312021202020192018Listed CAD UnitsTotal net asset value (000’s)(1)Number of units outstanding (000’s)(1)Management expense ratio(2)Management expense ratio beforewaivers or absorptions(2)Trading expense ratio(3)Portfolio turnover rate(4)Net asset value per unitClosing market price2017 2,696,820 1,398,725 1,089,429 1,299,131 1,374,96669,190 48,278 37,178 49,578 46,273%0.480.600.610.600.62%%% 0.00179.3129.7129.71This information is provided as at December 31 of the period shown.Management expense ratio is based on total expenses (excluding commissions and other portfoliotransaction costs) for the stated period and is expressed as an annualized percentage of dailyaverage net asset value during the period.(3)The trading expense ratio represents total commissions and other portfolio transaction costsexpressed as an annualized percentage of daily average net asset value during the period.(4)The ETF’s portfolio turnover rate indicates how actively the ETF’s portfolio manager manages itsportfolio investments. A portfolio turnover rate of 100% is equivalent to the ETF buying and sellingall of the securities in its portfolio once in the course of the year. The higher an ETF’s portfolioturnover rate in a year, the greater the trading costs payable by the ETF in the year, and the greaterthe chance of an investor receiving taxable capital gains in the year. There is not necessarilya relationship between a high turnover rate and the performance of an ETF.(1)(2)
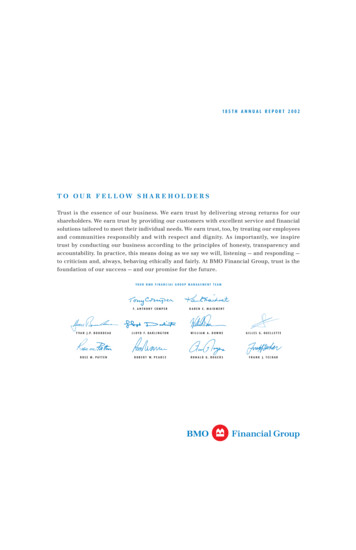
BMO Equal Weight Banks Index ETFManagement FeesYear-by-Year ReturnsThe Manager is responsible for the day-to-day managementof the business and operations of the ETF. The Managermonitors and evaluates the ETF’s performance, managesthe portfolio and provides certain administrative servicesrequired by the ETF. As compensation for its services, theManager is entitled to receive a management fee payablequarterly and calculated based on the daily net asset valueof the ETF at the annual rate set out in the table below.The management fee is subject to applicable taxes. TheManager may, from time to time in its discretion, waive allor a portion of the management fee charged.The following bar chart shows the performance of the ETFfor each of the financial years shown and illustrates howthe ETF’s performance has changed year to year. The chartshows, in percentage terms, how much an investment madeon the first day of each financial year would have increasedor decreased by the last day of each financial year.TickerAnnualManagement Fee Rate%ZEB0.25Past PerformanceThe ETF’s performance information assumes that alldistributions made by the ETF in the periods shown wereused to purchase additional units of the ETF and is based onthe net asset value of the ETF.The performance information does not take into accountsales, redemption, distribution or other optional chargesthat, if applicable, would have reduced returns orperformance. Please remember that how the ETF hasperformed in the past does not indicate how it will performin the future.On September 15, 2017, in addition to the ETF changingits name from BMO S&P/TSX Equal Weight Banks Index toBMO Equal Weight Banks Index ETF, the underlying indexof the ETF changed from S&P/TSX Equal Weight DiversifiedBanks Index to Solactive Equal Weight Canada BanksIndex. The change to the new Index aligns with the currentinvestment objective and strategies of the ETF.On September 1, 2021, the ETF reduced its annualmanagement fee rate from 0.55% to 0.25%.These changes could have affected the performance of theETF, had they been in effect throughout the performancemeasurement periods presented.Listed CAD 1920202021
BMO Equal Weight Banks Index ETFAnnual Compound ReturnsSummary of Investment PortfolioThis table compares the historical annual compoundreturns of the ETF with its benchmark index, the SolactiveEqual Weight Canada Banks Index and a broad-based index,the S&P/TSX Capped Composite Index.As at December 31, 2021The Solactive Equal Weight Canada Banks Index includesCanadian exchange listed securities in the diversifiedbank industry. Constituents are subject to minimummarket capitalization and liquidity screens. In addition,each security in the Solactive Equal Weight Canada BanksIndex is allocated an equal weight rather than a marketcapitalization weight.The S&P/TSX Capped Composite Index is a marketcapitalization-weighted index of securities of the largest andmost liquid companies on the TSX. It is the broadest in theS&P/TSX family and is the basis for multiple sub-indices. Itincludes common stocks and income trust units.As at December 31, 2021Listed CAD UnitsBMO Equal Weight Banks Index ETFSolactive Equal Weight CanadaBanks IndexS&P/TSX Capped Composite 919.5617.5212.5210.0413.689.14SinceInceptionA discussion on the relative performance of the ETF as compared to itsbenchmark index and broad-based index can be found under the Results ofOperations section of this report.Portfolio Allocation% of NetAsset ValueDiversified Banks. . . . . . . . . . . . . . . . . . . . . . . . . . . . . . . . . . . . . . . . . . . . 99.6Cash/Receivables/Payables. . . . . . . . . . . . . . . . . . . . . . . . . . . . . . . . . . . . . 0.4Total Portfolio AllocationHoldings*100.0% of NetAsset ValueToronto-Dominion Bank, The. . . . . . . . . . . . . . . . . . . . . . . . . . . . . . . . . . . 18.3Bank of Nova Scotia, The. . . . . . . . . . . . . . . . . . . . . . . . . . . . . . . . . . . . . . 17.8Bank of Montreal. . . . . . . . . . . . . . . . . . . . . . . . . . . . . . . . . . . . . . . . . . . . 16.5Royal Bank of Canada. . . . . . . . . . . . . . . . . . . . . . . . . . . . . . . . . . . . . . . . 16.1Canadian Imperial Bank of Commerce. . . . . . . . . . . . . . . . . . . . . . . . . . . 15.6National Bank of Canada. . . . . . . . . . . . . . . . . . . . . . . . . . . . . . . . . . . . . . 15.3Cash/Receivables/Payables. . . . . . . . . . . . . . . . . . . . . . . . . . . . . . . . . . . . . 0.4Total Holdings as a Percentage of Total Net Asset ValueTotal Net Asset Value100.0 2,696,819,766*Represents the entire portfolio.The summary of investment portfolio may change due to the ETF’s ongoingportfolio transactions. Updates are available quarterly.
Caution regarding forward-looking statementsThis document may contain forward-looking statements relating to anticipated future events, results, circumstances,performance or expectations that are not historical facts but instead represent our beliefs regarding future events. By their nature,forward-looking statements require us to make assumptions and are subject to inherent risks and uncertainties.There is significant risk that predictions and other forward-looking statements will not prove to be accurate. We caution readersof this document not to place undue reliance on our forward-looking statements as a number of factors could cause actual futureresults, conditions, actions or events to differ materially from the targets, expectations, estimates or intentions expressed orimplied in the forward-looking statements. Actual results may differ materially from management expectations as projected insuch forward-looking statements for a variety of reasons, including but not limited to market and general economic conditions,interest rates, regulatory and statutory developments, the effects of competition in the geographic and business areas in whichthe ETF may invest in and the risks detailed from time to time in the ETFs’ prospectus. We caution that the foregoing list offactors is not exhaustive and that when relying on forward-looking statements to make decisions with respect to investing inthe ETF, investors and others should carefully consider these factors, as well as other uncertainties and potential events, and theinherent uncertainty of forward-looking statements. Due to the potential impact of these factors, BMO Asset Management Inc.does not undertake, and specifically disclaims, any intention or obligation to update or revise any forward-looking statements,whether as a result of new information, future events or otherwise, unless required by applicable law.The ETF is not sponsored, promoted, sold or supported in any other manner by Solactive AG nor does Solactive AG offer anyexpress or implicit guarantee or assurance either with regard to the results of using the Index and/or trade mark or the IndexPrice at any time or in any other respect. The Index is calculated and published by Solactive AG. Solactive AG uses its best effortsto ensure that the Index is calculated correctly. Irrespective of its obligations towards the Manager, Solactive AG has no obligationto point out errors in the Index to third parties including but not limited to investors and/or financial intermediaries of the ETF.Neither publication of the Index by Solactive AG nor the licensing of the Index or Index trade mark for the purpose of use inconnection with the ETF constitutes a recommendation by Solactive AG to invest capital in the ETF nor does it in any wayrepresent an assurance or opinion of Solactive AG with regard to any investment in the ETF.BMO exchange traded funds are managed and administered by BMO Asset Management Inc., an investment fund manager andportfolio manager and separate legal entity from Bank of Montreal. /TMRegistered trade-marks/trade-mark of Bank of Montreal, used under license.www.bmo.com/etflegalFor more information please call 1-800-361-1392
involving the ETF and a Related Party. Manager The Manager, an indirect, wholly-owned subsidiary of Bank of Montreal ("BMO"), is the portfolio manager, trustee and promoter of the ETF. The Manager is paid a management fee by the ETF as compensation for its services, which is described in the "Management Fees" section later in this document.