Transcription
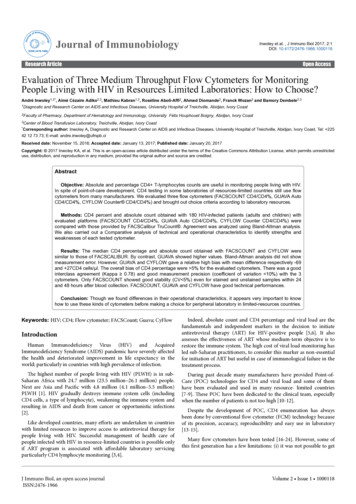
Journal of Immunological Methods 243 (2000) 77–97www.elsevier.nl / locate / jimA practical approach to multicolor flow cytometry forimmunophenotypinga ,1b,Nicole Baumgarth , Mario Roederer *aDepartment of Genetics, Stanford University Medical School, Beckman Center B-007, Stanford, CA 94305 -5318, USAbDepartment of Stomatology, UCSF, San Francisco, CA, USAAbstractThrough a series of novel developments in flow cytometry hardware, software, and dye-chemistry it is now possible tosimultaneously measure up to 11 distinct fluorescences and two scattered light parameters on each cell. Such advancedmulticolor systems have a number of advantages over current two- and three-color flow cytometric measurements. Theyprovide a large amount of novel information for each sample studied, an exquisitely accurate quantitation of even rare cellpopulations, and allow identification and characterization of novel cell subsets. In particular, this technology is provingcrucial to identifying functionally homogeneous subsets of cells within the enormously complex immune system; suchidentification and enumeration is important for understanding disease pathogenesis. However, multicolor flow cytometrycomes with a new and sometimes difficult set of technical problems that must be overcome by users to derive meaningfulresults. In this manuscript, we describe the basic aspects of multicolor flow cytometry, including the technical hurdles andartefacts that may occur, and provide some suggestions for how to best overcome these hurdles. While inspired by the11-color technology that we currently use, these principles apply to all flow cytometric experiments in which more than onefluorescent dye is used. 2000 Elsevier Science B.V. All rights reserved.Keywords: Flow cytometry; Immunofluorescence; Immunophenotyping; Multiparameter flow cytometry1. IntroductionAbbreviations: APC, allophycocyanin; A595, Alexa 595; CasB:Cascade Blue; CasY, Cascade Yellow; Cy5.5APC, Cy7APC,Cy5.5, Cy7 conjugates of allophycocyanin; Cy5PE, Cy5.5PE,Cy7PE, Cy5, Cy5.5, and Cy7 conjugates of phycoerythrin;Cy5.5PerCP: Cy5.5 tandem conjugate of PerCP; FITC, fluorescein; PBP: phycobiliprotein (i.e., PE or APC); PE, phycoerythrin;PerCP: peridinin chlorophyll protein; PFC, polychromatic flowcytometry; PMT, photomultiplier tube; TR, Texas Red; TRPE,Texas Red-conjugated phycoerythrin; SA, streptavidin*Corresponding author. Tel.: 11-415-514-0395; fax: 11-415476-4204.E-mail address: roederer@drmr.com (M. Roederer).1Present address: Center for Comparative Medicine, Universityof California, Davis, CA 95616, USA.Since the earliest application of flow cytometry tothe study of cells, there has been a drive to increasethe number of distinct measurements for each cell.This developmental effort blossomed in the late1990s, when the number of independently measurable ‘colors’ (each color corresponds to a distinctfluorescence-based measurement of a cellular proteinor function) increased from five to 11 (Roederer etal., 1997; Bigos et al., 1999).The success of this developmental effort was dueto the coordinated development of new hardware,new fluorochromes, and new software analysis tools0022-1759 / 00 / – see front matter 2000 Elsevier Science B.V. All rights reserved.PII: S0022-1759( 00 )00229-5
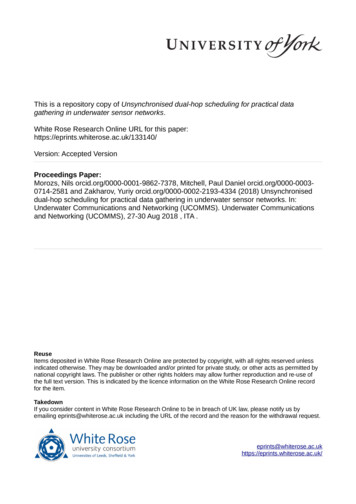
78N. Baumgarth, M. Roederer / Journal of Immunological Methods 243 (2000) 77 – 97that significantly increase the quality and quantity ofmeasurements. This increase comes with a price,however, as this new technology has its own set oftechnical problems and difficulties that users must beaware of and must overcome in order to derivemeaningful results. Nonetheless, once these hurdlesare overcome, this new technology is well worth theeffort, as the information obtained from the measurements is not only novel but could not be obtainedotherwise using standard flow cytometric techniques.As we outline below, setting up multicolor flowcytometry is not simply achieved by adding newreagents to existing reagent combinations, but requires a more involved process of quality control,optimization, and ‘debugging’. Therefore, to distinguish multicolor flow cytometry with its uniquebenefits and technical problems from current standard flow cytometric technologies (i.e., using four orfewer fluorescent dyes), we refer to it as ‘polychromatic flow cytometry’ (PFC) and will use theterm throughout this manuscript.Flow cytometers capable of collecting data formore than three or four colors are now becomingmore prevalent, as manufacturers have recognizedthe significant demand for the types of analysisafforded by this technology. Given the bewilderingarray of fluorochromes, lasers, hardware, and software that might be used in PFC, we outline here thefundamental requirements, interactions, and problems associated with setting up this technology, sothat users can make educated decisions about instrument requirements and the design of their experiments. Finally, we provide some examples in whichthis technology has been of particular benefit. Wehope to provide with this brief review some practicaltips and encouragement for those thinking of expanding their current flow cytometric measurements. Thebenefits of true multicolor flow cytometry make thistechnique a particularly useful and probably soon anirreplaceable tool for the study of cell biology andimmunology.2. FluorochromesThe ability to measure multiple parameters of eachcell is limited by the number of fluorochromes thatcan be simultaneously measured. The 11-color PFCthat is currently in routine use at Stanford uses dyesexcited by three different laser lines. The excitationand emission spectra of these dyes and the filters thatwere chosen to collect the emitted light from thesedyes are shown in Fig. 1.2.1. Characteristics of useful fluorochromesWhen designing experiments for the flow cytometer that include the use of new dyes, careful consideration must be given to the choice of fluorochromes.Desirable fluorochromes for cytometric technologieshave several properties: they (i) are biologicallyinert; (ii) have high cell-associated fluorescenceintensities (‘bright’); (iii) exhibit little spectral overlap amongst each other; and (iv) for immunophenotyping, are easily conjugated to monoclonalantibodies.2.1.1. Biological inertnessMost of the fluorochromes that are currently in useare biologically inert: i.e., they do not affect thecells, nor do they bind directly to cellular elements.There are, however, exceptions to this: the mostcommon example is that of the ‘background’ bindingof Cy5PE (and other Cyanine–PBP tandem dyes) tomonocytes and B cells. This background binding isvariable between species and can be extremely highin some instances. For example, Cy5PE binds strongly to B cells in mice with autoimmune disorders(e.g., non-obese diabetic mice). While there aremethods available to reduce this background, it is ofconcern when the particular cell types being studiedare those that interact ‘nonspecifically’ with thefluorochrome.2.1.2. Cell-associated fluorescence intensityWith regard to the high fluorescence intensities orthe ‘brightness’ of a fluorochrome, it should be notedthat the characterization of a fluorescence signal as‘bright’, i.e., the difference between the unstainedand the stained cells, is still empirical. ‘Bright’signals result from fluorochromes with the followingcharacteristics: (1) a high extinction coefficient; (2) ahigh quantum yield; (3) an emission spectrum overlapping as little as possible with cellular auto-
N. Baumgarth, M. Roederer / Journal of Immunological Methods 243 (2000) 77 – 9779Fig. 1. Shown are excitation and emission spectra of the 11 dyes that we currently use for polychromatic flow cytometry (PFC). Indicatedare the wavelengths of the different laser lines used for their excitation (407, 488 and 595 nm; other laser lines that can be used for some ofthe dyes are shown for reference), and the filters chosen for optimal light collection and minimal spillover. The fluorochromes, laser linesand filters are currently in routine use on a modified three-laser hybrid Becton-Dickinson / Cytomation flow cytometer, described previously(Roederer et al., 1997; Bigos et al., 1999).
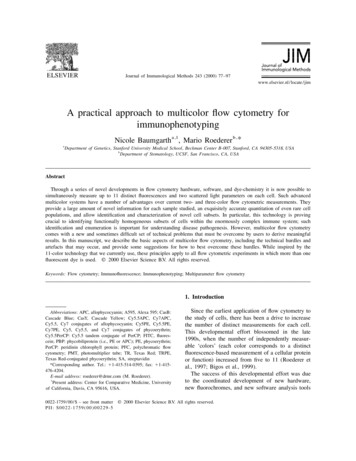
80N. Baumgarth, M. Roederer / Journal of Immunological Methods 243 (2000) 77 – 97fluorescence; (4) measurable with high sensitivitydetectors; and (5) the ability to conjugate multiplefluorochromes to each detecting unit (e.g., a highratio of fluorochrome to antibody).The differences in brightness can be quantitatedexperimentally by conjugating the same monoclonalantibody to the various fluorochromes at optimizedratios. Fig. 2 shows histograms of human peripheralblood lymphocytes that were stained with 11 different conjugates of an anti-CD8 monoclonal antibody,one conjugate for each of the 11 fluorochromes thatwe currently use in PFC. As shown in this figure, the‘brightness’ is affected not only by the intensity withwhich the positive cells are stained, but also by thebackground of the negative cells. Although some ofthe conjugates appear to stain much ‘brighter’ thanothers, all of these fluorochromes are useful forclearly distinguishing the positively stained cellsfrom the unstained cells.It is important to point out that the brightness of afluorochrome will differ depending on the instrumentused. For example, conjugates of antibodies to PEgenerally result in much brighter staining when cellsare analyzed with typical benchtop cytometers usingflow cells as compared to cytometers using jet-in-airdetection. This is due to a number of differences inthe optical paths that affect the efficiency with whichemitted light is collected by the detectors; however,other differences (notably the laser power) alsoinfluence sensitivity. Therefore, reagent ‘brightness’is a relative measurement and must be assessed byusers on any given instrument.Fig. 2. An anti-human CD8 monoclonal antibody was conjugated at optimal fluorochrome–antibody ratios to each of the indicatedfluorochromes (Roederer, 1997a,b). Human peripheral blood lymphocytes, purified by gradient centrifugation over Ficoll, were stained witheach of the indicated anti-CD8 conjugates and with an antibody to the pan-T cell marker CD3, conjugated either to FITC (for CasB andCasY graphs) or to CasB (all others). Shown are histograms of cells that stained positively for CD3. The dashed line indicates levels ofstaining for cells stained with anti-CD3 only, and the solid line indicates the anti-CD8 fluorescence for cells stained with both antibodies.Empirically, the relative ‘brightness’ of any of these fluorophores can be estimated based on the separation of CD8 positive and negativecells. The apparent difference in the number of cells between the positive and negative peaks for these dyes is a visual artefact of the scaling(note that the ‘CD8-dim’ cells appear to be more prevalent in those plots where the CD8 peak is higher). There was no difference in thepercent dim or bright-positive cells for any of distributions.
N. Baumgarth, M. Roederer / Journal of Immunological Methods 243 (2000) 77 – 972.1.3. Spectral overlapsThe spectral overlaps that exist between dyescurrently represent the biggest hurdle in PFC analysis. Due to the similarities and overlaps in theemission spectra of different dyes (see Fig. 1), it isnot possible to choose emission filters that uniquelymeasure only one of the dyes in a multicolorexperiment. The appropriate choice of filter, however, can greatly reduce collection of light fromother fluorochromes (i.e., reduce ‘spillover’). Notefrom Fig. 1 that a set of up to four dyes excited bythree different lasers can be chosen that exhibitessentially no spectral overlap; thus, four- or fewercolor experiments can be carefully designed to avoidthe problems caused by spillover. However, thenecessity of having three lasers for a four-colorexperiment renders this an impractical solution.Because of the spectral overlap, each fluorochrome will contribute a signal to several detectors,therefore the contribution in detectors not assigned tothat fluorochrome must be subtracted from the totalsignal in those detectors. This process, termed ‘compensation’, is discussed in detail below.2.1.4. Conjugation to antibodiesFor many applications of flow cytometry, a furtherrequirement for a fluorochrome is that it can bereadily conjugated to antibodies. The 11 dyes wecommonly use (Figs. 1 and 2) meet this criterion.There are, however, varying degrees of difficultyinvolved in carrying out the conjugation reactions. Itis likely that any laboratory carrying out flowcytometric analyses with five or more dyes will needto conjugate antibodies, as commercial conjugatesare not yet available for a number of these dyes.Even if all of the dyes become available as antibodyconjugates, it is unlikely that every combination ofantibody and fluorochrome necessary for each userwill be available.Detailed procedures for conjugating the dyes canbe found on the web (Roederer, 1997a) or fromcommercial vendors who supply conjugation kits.Briefly, the procedures for conjugating these dyesfall into three classes. (1) Small organic molecules(FITC, TR, A595, A430, CasB, and CasY) areconjugated to antibodies in relatively simple, shortreactions that require only one or two columnseparations (or other desalting procedures). (2) Sin-81gle protein molecules (PE, APC) require a slightlymore complex procedure, but reactive fluorochromescan be easily prepared, are stable for long periods oftime, can be used in a simple conjugation procedure.(3) Tandem dyes (Cy5PE,2 Cy5.5PE, Cy7PE,Cy5.5APC, Cy7APC, Cy5.5PerCP), require the useof more complex procedures which involve first thegeneration of the reactive tandems that can then, in asecond step, be used for conjugation to antibodies.Generating the reactive tandems requires carefultesting of different conditions for each batch oftandem dye to optimize the ratio of the two dyesused. However, once the chemistry has been optimized, a large batch of reactive dye can be preparedfor use in many conjugations.2.2. Other fluorochromes.New fluorochromes for immunophenotyping applications are constantly being developed. At the timeof writing, several dyes exist that are useful forimmunophenotyping applications and which can beused in addition to or instead of some dyes listed inFig. 1.2.2.1. PerCPThis is a chlorophyll-like protein that can bedirectly conjugated to antibodies. It has an emissionspectrum similar to Cy5PE, but with no excitation inthe red, and hence very little spillover into the APCdetector compared to Cy5PE. On the other hand, ithas several disadvantages: it is easily ‘bleached’ bylasers, limiting its utility to low-power instrumentssuch as benchtop instruments; it is less bright thanCy5PE; and it is only available in conjugates from asingle vendor (Becton-Dickinson, San Jose, CA).2.2.2. Cy5.5 PerCPA relatively new tandem conjugate of PerCP thathas excitation and emission spectra very similar toCy5.5PE. Unlike PerCP, it can be used in high powerlaser instruments as it does not ‘bleach’ easily, but isalso only available in conjugated form throughBecton-Dickinson.2Cy5PE is the same as ‘Tricolor’, Cy7APC is the same as‘Allo-7’ and ‘PharRed’, and Cy5.5PerCP is the same as ‘TruRed’.
82N. Baumgarth, M. Roederer / Journal of Immunological Methods 243 (2000) 77 – 972.2.3. Alexa 430, 595A series of new dyes termed ‘Alexa dyes’ fromMolecular Probes (Eugene, OR) includes two that wehave tested for their usefulness in PFC. A430 is anexcellent replacement for CasY, in that it has lessnon-specific interaction with CasB and is otherwiseroughly similar in ‘brightness’ (Baumgarth, unpublished). A595 is spectrally similar to Texas Red (TR)but does not have its non-specific binding characteristics, leading to a somewhat better separation ofpositive and negative signals than that seen withmany TR conjugates.2.2.4. TRPEThis dye, also called ‘Red 613’ or ‘ECD’ isexcited by a 488 nm laser line and can replaceCy5PE in a multicolor staining combination, as it hasconsiderably less overlap into the APC channel thanCy5PE. It is however less bright than Cy5PE and ithas somewhat more overlap into the PE channel; italso displays considerably higher background binding typical of TR conjugates.There are a number of other dyes that are commonly used to directly stain cellular componentssuch as DNA (e.g., Hoechst, propidium iodide),cellular membranes (e.g., CFSE, nile red), lysosomes(e.g., CFDA), and dyes that can measure metabolicactivity of the cell (e.g., rhodamine 123). It is beyondthe scope of this manuscript to cover fluorochromesthat are not used for immunophenotyping. For adetailed description of these therefore refer to (Shapiro, 1994). Importantly, however, the use of anycombination of dyes, irrespective of the measurement for which it is used, will need to address thesame issues such as reagent ‘brightness’, spillover,and compensation as described here for antibodyconjugates.2.3. Fluorochrome combinationsOut of the dozen or more fluorochromes that canbe used for immunophenotyping (by virtue of theirspectral and chemical properties discussed above), itis important to select the best combination for aparticular experiment under consideration. This istrue whether the experiment requires four or 11colors. To a large extent, the constraints on whichfluorochromes can be used will depend on theavailability of laser lines on the machine in use (i.e.,is a 595-nm dye laser line available, or a 407-nmviolet-enhanced krypton laser line?). The useable setof dyes also depends on the number of detectors thatare available on the instrument to collect the excitedlight (i.e., how many colors can be collected that areexcited by the first, second, and third laser line?).Once those constraints have been determined, therecan still be a wide range of possible combinations.Table 1 lists a number of such combinations, givensome constraints of laser and detector availabilityoften seen in currently available machines.3. Hardware3.1. LasersOne of the single largest component costs ofcytometry instrumentation is the cost of the lasers.Newer diode lasers are becoming prevalent and thesecan be significantly cheaper than the older gas ionlasers. When considering a solid-state laser, it isimportant to choose one that has a long life span andprovides a consistent power output, which thereforeexcludes the very cheap solid-state lasers that arecurrently available. In addition, for current stream-inair instrumentation it is desirable to have at least 50mW of power for each laser line in use, since thefluorescence signal (and thus sensitivity) increaseswith laser power. For most purposes, it is notnecessary to have much more power than this,because most fluorochromes will saturate (are maximally excited) at 100–150 mW. Indeed, additionalpower may actually reduce relative signal to background staining, because the fluorophore will saturate at much lower powers than background fluorescence. Table 2 lists some of the currently availablelasers and the lines that are often used in flowcytometry, their approximate costs and the dyes thatthey can excite.3.2. Optical setupSensitive detection of fluorochromes requiresselection of appropriate filters that are placed beforeeach detector, or photomultiplier tube (PMT). Filtersmust be selected so as to collect as much emitted
N. Baumgarth, M. Roederer / Journal of Immunological Methods 243 (2000) 77 – 9783Table 1Sample fluorochrome combinationsDyes aLasers bCombinations c42 y5.5PE or Cy7PE, APCCy5PE, Cy5.5APC or Cy7APCCy5PE, APCTRPE, APCCy5PE, Cy5.5PE or PE,PE,PE,PE,PE,PE,PE,PE,PE,Cy5.5PE or Cy7PE, TR, APCCy5PE, TR, Cy5.5APC or Cy7APCCy5PE, TR, APCCy7PE, APC, Cy5.5APCCy5.5PE, APC, Cy7APCCy5PE, Cy5.5APC, Cy7APCCy5PE, APC, Cy5.5APC or Cy7APCCy5PE or Cy7PE, APC, Cy7APCCy5PE, Cy5.5PE, Cy7PE1 (488)52 (4881595)2 (4881632)1 (488)62 (4881633)2 (4881595)1 (488)72 (4881632)2 (4881595)FITC, PE, Cy5.5PE, Cy7PE, APC, Cy5.5APC or Cy7APCFITC, PE, Cy5PE, Cy5.5PE or Cy7PE, Cy5.5APC, Cy7APCFITC, PE, Cy5PE, Cy5.5PE or Cy7PE, APC, Cy5.5APC or Cy7APCFITC, PE, Cy5.5PE, Cy7PE, TR, APCFITC, PE, Cy5PE, Cy7PE, TR, Cy5.5APCFITC, PE, Cy5PE, Cy5.5PE, TR, Cy7APCFITC, PE, Cy5PE, Cy5.5PE or Cy7PE, TR, APCFITC, PE, Cy5PE, TRPE, Cy5.5PE, Cy7PEFITC,FITC,FITC,FITC,PE,PE,PE,PE,Cy5.5PE, Cy7PE, APC, Cy5.5APC, Cy7APCCy5PE, Cy5.5PE or Cy7PE, APC, Cy5.5APC, Cy7APCCy5.5PE, Cy7PE, TR, APC, Cy5.5APC or Cy7APCCy5.5PE or Cy7PE, TR, APC, Cy5.5APC, Cy7APCaAny of the listed combinations can be augmented with a 407 nm Krypton laser and the fluorochromes CasB and CasY (or A430) toincrease the number of colors by two without significantly affecting compensation requirements.bNumber of lasers, followed by excitation lines (see footnote a).cCombinations are listed in rough order of increasing quality of measurements. i.e., for any given set of combinations, the first ones willtend to have lower compensation requirements and higher brightness. There are many more possible combinations than can be listed in thistable. The order does not take into account commercial availability or ease of conjugate preparation. Substitutions: PerCP can be substitutedfor Cy5PE on lower laser-power instruments; Cy5.5PerCp can be substituted for Cy5.5PE on any system; A595 can be substituted for TR onany system. TRPE could be added to most combinations not employing 595 lasers or used as a substitute for Cy5PE. Where two dyes arelisted as ‘A or B’, either can be used in the combination listed, but ‘A’ is preferred for reasons of brightness or compensation.light from the primary fluorochrome for high sensitivity, but as little as possible from other fluorochromes to reduce the compensation required. Ingeneral, these two criteria work against each other;therefore, for any given set of fluorochromes used inan experiment, the optimal filter set may be different.However, we have found that the filter set shown inFig. 1 and Table 3 is close to optimal for manyexperimental setups that are currently in use.A further important selection criterion is theability to block scattered light from the laser lines.Modern filters are considerably better than the oldfilters, allowing for example to collect the FITCsignals with a much wider bandpass filter than waspreviously possible (old, 530 / 30; new, 525 / 50)while still blocking scattered light from the 488-nmlaser line.For experiments using a small subset of thesefluorochromes, we found that using the widestpossible bandpass that still excludes as many otherfluorescences as possible yields the best results.Nonetheless, switching to wide-open filters willgenerally only increase the measured signal by 20–100% compared to the bandpass filters shown in
N. Baumgarth, M. Roederer / Journal of Immunological Methods 243 (2000) 77 – 9784Table 2Lasers for flow cytometry aLaser typeCoolingLine (nm)Approx. costFluorochromesArgon IonAir488 10KFITC, PE, TRPE, PerCP,Cy5PE, Cy5.5PE, Cy5.5PerCP,Cy7PE, A488KryptonWater568 30KPE, TRPE, PerCP, Cy5PE,Cy5.5PE, Cy5.5PerCP, Cy7PE,A568, TR, A595APC, Cy5APC, Cy5.5APC,Cy7APC (Cy5PE, Cy5.5PE,Cy7PE)e647Violet-enhancedKrypton ion bWater4071413 50KCasB, CasY, A430Dye cWater595 15K dTR, A595, APC, Cy5,Cy5.5APC, Cy7APC (TRPE,Cy5PE, Cy5.5PE)eDoubled Nd-YAGAir532 12KPE, TRPE, PerCP, Cy5PE,Cy5.5PE, Cy5.5PerCP, Cy7PEHeNeAir632 6K (50 mW)APC, Cy5, Cy5.5APC,DiodeAir635 1K (10 mW)Cy7APC (Cy5PE, Cy5.5PE)eaExcept as noted, lasers are rated at 50 mW output or greater at the given line.405-nm diode lasers with sufficient power for cytometry will be available soon; currently, 4-mW lasers cost about 4K.cCurrently, 5-mW HeNe lasers with a 594-nm line can be obtained for about 3K; this power level is probably too low except forbench-top (flow cell) cytometers.dA dye laser also requires a 5-W, 488-nm pump laser, adding another 20K to the cost of this laser. However, the 488-nm line of thepump laser (running in ‘all lines’ mode) can be split off and used as the primary laser beam in the instrument, obviating the need to purchasethe primary Argon laser.eDyes in parentheses will also be excited by this laser, although their primary excitation is by other laser lines.bTable 2. For flow cytometric experiments, 2-foldincreases in signal-to-background levels are marginalcompared to the optimizations that can be achievedin other parts of the experiment.4. Compensation4.1. What is compensation?Compensation is the process by which the spectraloverlap between different fluorochromes is mathematically eliminated. The algorithm of compensationis a straightforward application of linear algebra, andshould not be thought of as a subtraction process.Compensation between detectors can be performedeither by hardware, after signal detection but beforelogarithmic conversion and / or digitization, or postcollection by software.While compensation is one of the most importantprocesses required for proper data analysis in flowcytometry, it is also perhaps the least well understood. In order to properly design, implement, andanalyze multicolor experiments, users must be awareof the effects of compensation, understand how toapply it correctly, and recognize when data are notproperly compensated. While we will discuss someof these topics here in brief, the reader is stronglyencouraged to read the texts (Roederer, 1999) andweb pages (Roederer, 1997b) devoted to this topicfor more in-depth information.4.2. Compensation complicationsCurrently, most instruments provide the capability
N. Baumgarth, M. Roederer / Journal of Immunological Methods 243 (2000) 77 – 97Table 3Optimal interference filters for fluorochromes aFluorochromeFilter bCasBCasY, A430FITCPECy5PEPerCPCy5.5PE, Cy5.5PerCPCy7PETRPE, TR, A595APCCy5.5APCCy7APC440 / 40545 / 90525 / 50575 / 25665 / 30680 / 30720 / 45 c785 / 45 d625 / 40660 / 40705 / 50 c750LP daOptimization is a function of maximizing the amount of signalcollected while minimizing the amount of spillover from otherfluorochromes. Different filters may be optimal for particularapplications; see text.bFilters are given as ‘x /y’, where x is the wavelength innanometers of the center of the bandpass and y is the width innanometers of the band. LP, long pass filter. Filters have an extracoating to block scattered light.cUse of a 720 / 45 filter for Cy5.5PE is optimal when Cy5PE isalso to be measured. For measuring Cy5.5PE (or Cy5.5PerCP) inthe absence of Cy5PE, then a 705 / 50 is better. Because APC hasa lower emission wavelength than Cy5PE, the 705 / 50 works wellfor Cy5.5APC in combination with APC. However, if Cy5.5APCis to be measured with Cy5, then the 720 / 45 filter should beselected.dThe 750LP and the 785 / 50 are roughly equivalent forcollecting Cy7 emission; either can be used.for compensating between several spectrally adjacentpairs of detectors: for example, between FITC andPE, and between PE and Cy5PE. For a two-coloranalysis, such pairwise compensation is sufficientand complete. However, the introduction of a thirdfluorochrome introduces the potential for complexinteractions that cannot by fully corrected by suchpair-wise compensations. For example, FITC has lowbut measurable emission into the Cy5PE detector.This overlap may not be completely corrected by thecombination of the FITC PE and PE Cy5PEcompensation settings, causing what appears to beartefactual Cy5PE fluorescence when using a verybright FITC stain. Obviously, as more than threecolors are used, these problems increase.Indeed, for a typical 11-color stain, one wouldpotentially need to use up to 100 pair-wise compensation controls to fully compensate all colors (in85reality only about 40 of these are non-zero). Furthermore, because of the multiple interactions betweenthese controls, some settings may actually be lessthan zero; something that current hardware controlsdo not allow. Finally, since setting interacting pairwise compensation controls is an iterative process, itwould take virtually forever to manually set themproperly.An additional complication to compensation isbrought about by the use of tandem dyes (e.g.,Cy5PE, Cy7APC, etc.). Tandem dyes are covalentlylinked combinations of ‘donor’ (e.g., PE) and ‘acceptor’ (e.g., Cy5) dyes. The ratio of acceptor to donoris usually in the range of 3:1 to 10:1, depending onthe optimization strategy used by the manufacturer.In fact, different tandem-conjugated antibodies fromthe same manufacturer often have slightly differentratios of acceptor to donor. The problem is that thecompensation required to correct tandem emissionsin other fluorescence channels strongly depends onthis ratio. Therefore, a different compensation settingmay be needed for every different tandem conjugateused in a particular experiment. In essence, thismeans that the compensation setting needs to beadjusted for every different staining combination inuse.Given these complications, it is apparent thatcomplete compensation on multicolor systems requires computer intervention. Currently no instrument is commercially available that provides userswith the ability to automatically adjust compensationsettings on a per-stain basis, nor even to providecomplete compensation among all pairs of fluorescence detectors. Therefore, the only solution as yet isthe use of software analysis programs that areapplied after data collection is completed for compensation of the data. Examples of such softwareinclude WinList (for PC) and FlowJo (for Macintosh).The use of software to set compensation simplifiesthe process considerably. Computers can set thecompensation correctly (there is no subjective criterion applied) and can be instructed to appropriatelyvary the compensation matrix according to thespecific fluorochromes used in any given sample.However, there are significant limitations to softwarecompensation (see below). In the interim beforecomplete automated hardware compensation is avail-
86N.
hope to provide with this brief review some practical are those that interact 'nonspecifically' with the tips and encouragement for those thinking of expand- fluorochrome. ing their current flow cytometric measurements. The benefits of true multicolor flow cytometry make this 2.1.2. Cell-associated fluorescence intensity