Transcription
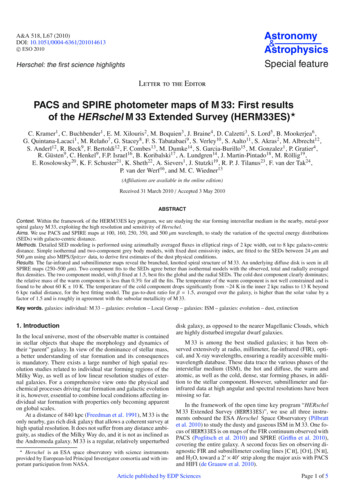
c ESO 2010 Astronomy&AstrophysicsHerschel: the first science highlightsSpecial featureA&A 518, L67 (2010)DOI: 10.1051/0004-6361/201014613Letter to the EditorPACS and SPIRE photometer maps of M 33: First resultsof the HERschel M 33 Extended Survey (HERM33ES) C. Kramer1 , C. Buchbender1 , E. M. Xilouris2 , M. Boquien3 , J. Braine4 , D. Calzetti3 , S. Lord5 , B. Mookerjea6 ,G. Quintana-Lacaci1 , M. Relaño7 , G. Stacey8 , F. S. Tabatabaei9 , S. Verley10 , S. Aalto11 , S. Akras2 , M. Albrecht12 ,S. Anderl12 , R. Beck9 , F. Bertoldi12 , F. Combes13 , M. Dumke14 , S. Garcia-Burillo15 , M. Gonzalez1 , P. Gratier4 ,R. Güsten9 , C. Henkel9 , F.P. Israel16 , B. Koribalski17 , A. Lundgren14 , J. Martin-Pintado18 , M. Röllig19 ,E. Rosolowsky20 , K. F. Schuster21 , K. Sheth22 , A. Sievers1 , J. Stutzki19 , R. P. J. Tilanus23 , F. van der Tak24 ,P. van der Werf16 , and M. C. Wiedner13(Affiliations are available in the online edition)Received 31 March 2010 / Accepted 3 May 2010ABSTRACTContext. Within the framework of the HERM33ES key program, we are studying the star forming interstellar medium in the nearby, metal-poorspiral galaxy M 33, exploiting the high resolution and sensitivity of Herschel.Aims. We use PACS and SPIRE maps at 100, 160, 250, 350, and 500 μm wavelength, to study the variation of the spectral energy distributions(SEDs) with galacto-centric distance.Methods. Detailed SED modeling is performed using azimuthally averaged fluxes in elliptical rings of 2 kpc width, out to 8 kpc galacto-centricdistance. Simple isothermal and two-component grey body models, with fixed dust emissivity index, are fitted to the SEDs between 24 μm and500 μm using also MIPS/Spitzer data, to derive first estimates of the dust physical conditions.Results. The far-infrared and submillimeter maps reveal the branched, knotted spiral structure of M 33. An underlying diffuse disk is seen in allSPIRE maps (250–500 μm). Two component fits to the SEDs agree better than isothermal models with the observed, total and radially averagedflux densities. The two component model, with β fixed at 1.5, best fits the global and the radial SEDs. The cold dust component clearly dominates;the relative mass of the warm component is less than 0.3% for all the fits. The temperature of the warm component is not well constrained and isfound to be about 60 K 10 K. The temperature of the cold component drops significantly from 24 K in the inner 2 kpc radius to 13 K beyond6 kpc radial distance, for the best fitting model. The gas-to-dust ratio for β 1.5, averaged over the galaxy, is higher than the solar value by afactor of 1.5 and is roughly in agreement with the subsolar metallicity of M 33.Key words. galaxies: individual: M 33 – galaxies: evolution – Local Group – galaxies: ISM – galaxies: evolution – dust, extinction1. IntroductionIn the local universe, most of the observable matter is containedin stellar objects that shape the morphology and dynamics oftheir “parent” galaxy. In view of the dominance of stellar mass,a better understanding of star formation and its consequencesis mandatory. There exists a large number of high spatial resolution studies related to individual star forming regions of theMilky Way, as well as of low linear resolution studies of external galaxies. For a comprehensive view onto the physical andchemical processes driving star formation and galactic evolutionit is, however, essential to combine local conditions affecting individual star formation with properties only becoming apparenton global scales.At a distance of 840 kpc (Freedman et al. 1991), M 33 is theonly nearby, gas rich disk galaxy that allows a coherent survey athigh spatial resolution. It does not suffer from any distance ambiguity, as studies of the Milky Way do, and it is not as inclined asthe Andromeda galaxy. M 33 is a regular, relatively unperturbed Herschel is an ESA space observatory with science instrumentsprovided by European-led Principal Investigator consortia and with important participation from NASA.disk galaxy, as opposed to the nearer Magellanic Clouds, whichare highly disturbed irregular dwarf galaxies.M 33 is among the best studied galaxies; it has been observed extensively at radio, millimeter, far-infrared (FIR), optical, and X-ray wavelengths, ensuring a readily accessible multiwavelength database. These data trace the various phases of theinterstellar medium (ISM), the hot and diffuse, the warm andatomic, as well as the cold, dense, star forming phases, in addition to the stellar component. However, submillimeter and farinfrared data at high angular and spectral resolutions have beenmissing so far.In the framework of the open time key program “HERschelM 33 Extended Survey (HERM33ES)”, we use all three instruments onboard the ESA Herschel Space Observatory (Pilbrattet al. 2010) to study the dusty and gaseous ISM in M 33. One focus of HERM33ES is on maps of the FIR continuum observed withPACS (Poglitsch et al. 2010) and SPIRE (Griffin et al. 2010),covering the entire galaxy. A second focus lies on observing diagnostic FIR and submillimeter cooling lines [C ii], [O i], [N ii],and H2 O, toward a 2 40 strip along the major axis with PACSand HIFI (de Graauw et al. 2010).Article published by EDP SciencesPage 1 of 5
A&A 518, L67 (2010)In this first HERM33ES paper, we use continuum maps covering the full extent of M 33, at 100, 160, 250, 350, and 500 μm.These data are an improvement over previous data sets of M 33,obtained with ISO and Spitzer (Hippelein et al. 2003; Hinz et al.2004; Tabatabaei et al. 2007), in terms of wavelength coverageand angular resolution.The total bolometric luminosity of normal galaxies is onlyabout a factor of 2 larger than the total IR continuum emission(Hauser & Dwek 2001), which in turn accounts for more than 98% of the emission of the ISM (dust gas) (e.g. Malhotra et al.2001; Dale et al. 2001). Massive star formation heats the dustmainly via its far-ultraviolet (FUV) photons and the absorbedenergy is then reradiated in the IR. FIR continuum fluxes aretherefore often used as a measure of the interstellar radiationfield (ISRF) (e.g. Kramer et al. 2005) and the star formation rate(SFR) (e.g. Schuster et al. 2007). However, a number of authorshave suggested that half of the FIR emission or more is due todust heated by a diffuse ISRF, and not directly linked to massivestar formation (Israel et al. 1996; Verley et al. 2009).Another disputed topic is the evidence for a massive, colddust component in galaxies. The SCUBA Local Universe GalaxySurvey (Dunne & Eales 2001) identified a cold dust componentat an average temperature of 21 K. A number of studies of themillimeter continuum emission of galaxies found indications foreven lower temperatures (Misiriotis et al. 2006; Weiß et al. 2008;Liu et al. 2010). In order to estimate the amount of dust at temperatures below about 20 K, and to improve our understandingof the physical conditions of the big grains, well calibrated observations longward of 150 μm wavelength are needed.2. ObservationsM 33 was mapped with PACS & SPIRE in parallel mode in twoorthogonal directions, in 6.3 h on January 7, 2010. Observationswere executed with slow scan speed of 20 /s, covering a region of about 70 70 . Data were taken simultaneously withthe PACS green and red channel, centered on 100 and 160 μm.SPIRE observations were taken simultaneously at 250, 350, and500 μm. The PACS and the SPIRE data sets were both reducedusing the Herschel interactive processing environment (HIPE)2.0, with in-house reduction scripts based on the two standardreduction pipelines.2.1. PACS dataThe maps are produced with “photproject”, the default mapmaker of the PACS data processing pipeline, and a two-stepmasking technique. First we generate a “naive” map, i.e. notproperly taking into account partial pixel overlaps and geometricdeformation of the bolometer matrix, and build a mask considering that all pixels above a given threshold do not belong tothe sky. Then we use this mask to run the high-pass filter (HPF)taking into account this map. The mask helps to preserve the diffuse component to some extent. With new HIPE tools becomingavailable, we will try improving data processing to fully recoverthe diffuse emission in the PACS maps (cf. Fig. 1). The finalmap is built using the filtered, deglitched frames. They have apixel size of 3.2 at 100 μm and 6.4 at 160 μm. The spatialresolutions of the PACS data are 6.7 6.9 at 100 μm and10.7 12.1 at 160 μm. The pipeline processed data were divided by 1.29 in the red band and 1.09 in the green one, asthis correction is not yet implemented in HIPE 2.0.1 The rms1PACS photometer – Prime and Parallel scan mode release note. V.1.2,23 February 2010.Page 2 of 5Fig. 1. A composite 500 μm (red) and 160 μm (blue) map of M 33.The most extended emission is traced by the longest wavelength maprevealing the presence of the cold dust in the outskirts of the galaxy.The shorter wavelengths mostly trace the branched spiral structure aswell as distinct warm H ii regions and star-forming complexes (such asthe ones labeled).noise levels of the PACS maps are 2.6 mJy pix 2 at 100 μm and6.9 mJy pix 2 at 160 μm. The background of the PACS maps ofM 33 shows perpendicular stripes in each scanning direction dueto 1/ f noise.2.2. SPIRE dataA baseline fitting algorithm (Bendo et al. 2010) was applied toevery scan of the maps. Next, a “naive” mapping projection wasapplied to the data and maps with pixel size of 6 , 10 , and 14 were created for the 250, 350, and 500 μm data, respectively.Calibration correction factors of 1.02, 1.05, and 0.94 were applied to the 250, 350, and 500 μm maps, as this is not yet implemented in HIPE 2.0. The spatial resolutions are 18.7 17.5 ,26.3 23.4 , and 38.1 35.1 at 250, 350, and 500 μm, respectively. The calibration accuracy is 15%2 . The rms noise levels ofthe SPIRE maps of M 33 are 14.1, 9.2, and 8 mJy/beam, at 250,350, 500 μm.3. Results3.1. MapsFigure 1 shows a composite image of the 160 μm, 250 μm, and500 μm PACS and SPIRE maps. All data sets show the flocculent and knotted spiral arm structure, extending slightly beyond 4 kpc radial distance. The PACS 160 μm map provides themost detailed view, thanks to its unprecedented linear resolutionof 50 pc, allowing to resolve individual giant molecular clouds(GMCs) over the entire disk of M 33. A large number of distinct sources delineates the spiral arms. The properties of thesesources are studied by Verley et al. (2010) and Boquien et al.(2010). The SPIRE data show a faint, diffuse disk, extending outto 7 kpc. Outside of 8 kpc, both maps show some weak emission.2SPIRE Beam Model Release Note V0.1, SPIRE Scan-Map AOT andData Products, Issue 2, 21-Oct.-2009.
C. Kramer et al.: PACS and SPIRE photometer maps of M 33Beta ig. 2. Ratio map of the 250 μm over 500 μm maps, at 40 resolution.Ellipses denote 2, 4, 6, 8 kpc galacto-centric distances with inclination 56 (Regan & Vogel 1994) and position angle 22.5 (Paturel et al.2003). The rectangle delineates the 2 40 wide strip along the majoraxis, which will be mapped with HIFI and PACS in spectroscopy mode.Crosses mark the H ii regions shown in Fig. 1.Galactic cirrus is evident only in the outermost part of thegalaxy beyond 6 kpc radial distance, showing an average contamination of the order of 2% which can go up to 8% at the veryfaint levels at 500 μm. This is still below the 15% calibrationerror, which is the dominant part of the uncertainty. We did notcorrect the M 33 data for Galactic Cirrus emission.The S (250 μm)/S (500 μm) ratio of flux densities (Fig. 2)drops from about 6 in the inner spiral arms, to 4 at 4 kpcradius, continuing to less than 3 at more than 6 kpc radial distance. This drop is also seen in the radially averaged spectral energy distributions (Fig. 3, Table 1). In addition, the inner spiralarms and a couple of prominent H ii regions (cf. Fig. 1), out toabout 5 kpc radius, show an enhanced ratio of 6 relative to theinter-arm ISM, exhibiting a ratio of typically 4. This shows thatdust is mainly heated by the young massive stars rather than thegeneral interstellar radiation field in M 33. This is in agreementwith a multi-scale study of MIPS data (Tabatabaei et al. 2007),where the 160 μm emission was found to be well correlated withHα emission.3.2. Spectral energy distributions (SEDs)Figure 3 shows the total flux densities of M 33 and radiallyaveraged SEDs. The SEDs at different annuli were created bysmoothing all data to a common resolution of 40 , and averaging the observed flux densities in radial zones of 2 kpc width:ri R ri 2 kpc with ri 0, 2, 4, 6 kpc (cf. Fig. 2). TheHerschel data agree in general well with the data from the literature. The MIPS data at 160 μm agree within 20% with the corresponding PACS data, for all radial zones. The 100 μm PACSflux density, measured in the outermost annulus, is far below theexpected value, indicating that extended, diffuse emission is atpresent lost by the data processing. We do not use these data forthe fits.Figures 3c,d shows the drop of emission by almost two orders of magnitude between the center and the outskirts at 8 kpcradial distance. One striking feature of the radially averaged121Beta 1.5b)d)0 R 2kpc2 R 4kpc4 R 6kpc6 R 8kpc121Fig. 3. Spectral energy distributions (SEDs) of M 33 at wavelengths between 24 μm and 500 μm. a), b): total integrated SED of M 33, combining data of PACS & SPIRE, with data of MIPS/Spitzer (Tabatabaeiet al. 2007), ISOCAM (Hippelein et al. 2003), and IRAS (Rice et al.1990). c), d): radially averaged SEDs in zones of 2 kpc width. Here,we show the MIPS, PACS, and SPIRE data. a), c): drawn lines showtwo-component grey body model fit results. The 100 μm PACS fluxdensity, measured in the outermost zone, was not used for the fits (seethe text). The dust emissivity index was set to β 2. b), d): drawn linesshow two-component models for β 1.5. a)–d): all fits are weighted bythe assumed uncertainties: 7% for MIPS 24, 70 μm (Spitzer ObserversManual v8.0), 20% for PACS, 15% for SPIRE. The SEDs have not beende-projected.SEDs is the change of the 160/250 PACS/SPIRE flux densityratio (color), which drops systematically with radial distance,from 1.7 in the inner zone, to 0.5 in the outer zone. At the sametime, the slope of the SPIRE data turns shallower with distance,as already seen in Fig. 2.We fit simple isothermal and two-component grey bodymodels to the data. Each component is described by S ν B(ν, T )τν B(ν, T )κν Md /D2 , assuming optically thin emission,with the flux S ν , the Planck function Bν , the opacity τν , thedust mass Md , the distance D, and the dust absorption coefficient κν 0.4(ν/(250 GHz))β cm2 g 1 (Kruegel & Siebenmorgen1994; Kruegel 2003), β is the dust emissivity index. The fit minimizes the function χ2 ((S ν,obs S ν )/ΔS ν,obs )2 using theLevenberg-Marquardt algorithm (Bevington & Robinson 1992),with the assumed calibration error ΔS ν,obs . The fits are conductedat 7 wavelengths using the SPIRE, PACS, and the MIPS data at70 and 24 μm. The 24 μm data helps in constraining the warmcomponent, though its emission partly stems from stochasticallyheated small grains, not only from grains in thermal equilibrium. To maintain at least two degrees of freedom (Bevington &Robinson 1992) in the 2-component fit, we kept β fixed to values between 1 and 2. These values are typically found in modelsand observations of interstellar dust (see literature compiled byDunne & Eales 2001).The fits of isothermal models do not reproduce the data well,the values of the reduced χ2 are very high. To a large extent, thisis because of the 24 μm points, which clearly require a second,warm dust component. Two-component grey body models resultin a much better agreement with the data. The best fitting modelis the two-component model with β 1.5. The χ2red values arebetter than 0.2 for all annuli out to 6 kpc, and 1.8 for the outermost annulus. However, these values are only slightly better orequal to the χ2red values of the two other two-component models.Page 3 of 5
A&A 518, L67 (2010)Table 1. Results of fits of one and two emission components to the measured spectral energy distributions (SEDs) of the MIPS, PACS, SPIREdata of M 33 shown in Fig. 3.Total(1)Isothermal fitsT /[K]2925β0.51.4χ2red4544Two-component fits with β 2T c /[K]1620T w /[K]50558.01.0Mc /[106 M ]Mc /Mw 10009000.410.23χ2redMgas /Mc250230Two-component fits with β 1.5T c /[K]1924T w /[K]5577101.2Mc /[106 M ]Mc /Mw500 38000.140.10χ2redMgas /Mc200190Two-component fits with β 1T c /[K]2328T w /[K]62–121.6Mc /[106 M ]Mc /Mw300–0.220.6χ2redMgas /Mc170140Total gas mass230Mgas /[106 M ] 2020(2)(3)(4)280.845105 1.8337 02.4140440560790Notes. For the two-component fits, the dust emissivity index was keptfixed. T c , T w are the temperatures of the cold and warm component. Mcis the total cold dust mass per annulus. Mc /Mw is the dust mass ratioof both components. χ2red is the χ2 divided by the number of observedparameters minus the number of fitted parameters minus 1. The 100 μmflux density measured in the outermost zone was not used for the fits.The columns give the radial annuli: Total: 0 R 8 kpc, (1): 0 R 2 kpc, (2): 2 R 4 kpc, (3): 4 R 6 kpc, (4): 6 R 8 kpc.The last line at the bottom of the table gives the total gas masses Mgas 1.36 (M(H2 ) M(H i)) (Gratier et al. 2010).We find higher temperatures of the cold component for lowervalues of β, rendering it difficult to determine both parameters atthe same time. This degeneracy between dust temperature anddust emissivity is a common problem (e.g. Kramer et al. 2003).Note, however, that the total mass of the cold component, israther well determined. For β-values varying between 1 and 2,this mass only varies by 20%. The masses in each annulus weredetermined by fitting the observed SEDs. As the fitted temperatures are slightly different, the sum over the four annuli does notexactly agree with the fitted total cold dust mass in Table 1.The cold dust component dominates the mass for the galaxyfor all annuli. Though the warm component is needed to reproduce the data shortwards of 100 μm, its relative mass is lessthan 0.3% for all cases. Therefore, its temperature is not wellconstrained. It is found to be about 60 K 10 K. The temperature of the cold component is determined to an accuracy of about3 K, as estimated from a Monte Carlo analysis using the observed data with the estimated accuracies. It drops significantlyfrom 24 K in the inner 2 kpc radius to 13 K beyond 6 kpc radialdistance, using the best fitting model.Table 1 also gives the total gas masses Mgas of the entiregalaxy, and of the elliptical annuli. These are calculated fromH i and CO data presented in Gratier et al. (2010). They assumea constant CO-to-H2 conversion factor. But note that this XCOfactor does not strongly affect the total gas masses, as the H iis dominating. The gas-to-dust mass ratio for the entire galaxy,using the best fitting dust model with β 1.5, is 200, abouta factor of 1.5 higher than the solar value of 137 (cf. Table 2 inDraine et al. 2007), and a factor of 2 higher than recent dust models for the Milky Way (Weingartner & Draine 2001; Draine et al.2007). A factor of about 2 is expected, as the metallicity is abouthalf solar (Magrini et al. 2009). The gas-to-dust ratio for β 1.5varies between 200 and 120 in the different annuli. Within ourerrors this is consistent with the shallow O/H abundance gradient found by Magrini et al. (2009). The gas-to-dust ratios foundin M 33 are similar to the typical values found in nearby galaxies(e.g. Draine et al. 2007; Bendo et al. 2010). Braine et al. (2010)combine the dust and gas data of M 33 to study the gas-to-dustratios in more detail and derive dust cross sections.Acknowledgements. HIPE is a joint development by the Herschel ScienceGround Segment Consortium, consisting of ESA, the NASA Herschel ScienceCenter, and the HIFI, PACS and SPIRE consortia. We would like to thank allthose who helped us processing the PACS and SPIRE data. In particular wewould like to acknowledge support from Pierre Royer, Bruno Altieri, Pat Morris,Bidushi Bhattacharya, Marc Sauvage, Michael Pohlen, Pierre Chanial, GeorgeBendo. MR acknowledges the MC-IEF within the 7th European CommunityFramework Programme.ReferencesBendo, G. J., et al. 2010, A&A, 518, L65Bevington, P., & Robinson, D. 1992, Data reduction and error analysis for thephysical sciences (McGraw-Hill, Inc.)Boquien, M., Calzetti, D., Kramer, C., et al. 2010, A&A, 518, L70Braine, J., Gratier, P., Kramer, C., et al. 2010, A&A, 518, L69Dale, D. A., Helou, G., Contursi, A., Silbermann, N. A., & Kolhatkar, S. 2001,ApJ, 549, 215de Graauw, Th., et al. 2010, A&A, 518, L6Draine, B. T., Dale, D. A., Bendo, G., et al. 2007, ApJ, 663, 866Dunne, L., & Eales, S. A. 2001, MNRAS, 327, 697Freedman, W. L., Wilson, C. D., & Madore, B. F. 1991, ApJ, 372, 455Gratier, P., Braine, J., Rodriguez-Fernandez, N., et al. 2010, A&A, acceptedGriffin, M. J., et al. 2010, A&A, 518, L3Hauser, M. G., & Dwek, E. 2001, ARA&A, 39, 249Hinz, J. L., Rieke, G. H., Gordon, K. D., et al. 2004, ApJS, 154, 259Hippelein, H., Haas, M., Tuffs, R. J., et al. 2003, A&A, 407, 137Israel, F. P., Bontekoe, T. R., & Kester, D. J. M. 1996, A&A, 308, 723Kramer, C., Mookerjea, B., Bayet, E., et al. 2005, A&A, 441, 961Kramer, C., Richer, J., Mookerjea, B., Alves, J., & Lada, C. 2003, A&A, 399,1073Kruegel, E. 2003, The physics of interstellar dust, ed. E. KruegelKruegel, E., & Siebenmorgen, R. 1994, A&A, 288, 929Liu, G., Calzetti, D., Yun, M. S., et al. 2010, AJ, 139, 1190Magrini, L., Stanghellini, L., & Villaver, E. 2009, ApJ, 696, 729Malhotra, S., Kaufman, M., Hollenbach, D., et al. 2001, ApJ, 561, 766Misiriotis, A., Xilouris, E. M., Papamastorakis, J., Boumis, P., & Goudis, C. D.2006, A&A, 459, 113Paturel, G., Petit, C., Prugniel, P., et al. 2003, A&A, 412, 45Pilbratt, G. L., et al. 2010, A&A, 518, L1Poglitsch, A., et al. 2010, A&A, 518, L2Regan, M. W., & Vogel, S. N. 1994, ApJ, 434, 536Rice, W., Boulanger, F., Viallefond, F., Soifer, B. T., & Freedman, W. L. 1990,ApJ, 358, 418Schuster, K. F., Kramer, C., Hitschfeld, M., Garcia-Burillo, S., & Mookerjea, B.2007, A&A, 461, 143Tabatabaei, F. S., Beck, R., Krause, M., et al. 2007, A&A, 466, 509Verley, S., Corbelli, E., Giovanardi, C., & Hunt, L. K. 2009, A&A, 493, 453Verley, S., Relano, M., Kramer, C., et al. 2010, A&A, 518, L68Weingartner, J. C., & Draine, B. T. 2001, ApJ, 548, 296Weiß, A., Kovács, A., Güsten, R., et al. 2008, A&A, 490, 77Page 5 is available in the electronic edition of the journal at http://www.aanda.orgPage 4 of 5
C. Kramer et al.: PACS and SPIRE photometer maps of M 33121234567891011Instituto Radioastronomía Milimétrica, Av. Divina Pastora 7,Nucleo Central, 18012 Granada, Spaine-mail: kramer@iram.esInstitute of Astronomy and Astrophysics, National Observatory ofAthens, P. Penteli, 15236 Athens, GreeceDepartment of Astronomy, University of Massachusetts, Amherst,MA 01003, USALaboratoire d’Astrophysique de Bordeaux, Université Bordeaux 1,Observatoire de Bordeaux, OASU, UMR 5804, CNRS/INSU, BP89, Floirac 33270IPAC, MS 100-22 California Institute of Technology, Pasadena, CA91125, USADepartment of Astronomy & Astrophysics, Tata Institute ofFundamental Research, Homi Bhabha Road, Mumbai 400005, IndiaInstitute of Astronomy, University of Cambridge, Madingley Road,Cambridge CB3 0HA, EnglandDepartment of Astronomy, Cornell University, Ithaca, NY 14853,USAMax Planck Institut für Radioastronomie, Auf dem Hügel 69, 53121Bonn, GermanyDept. Física Teórica y del Cosmos, Universidad de Granada, SpainDepartment of Radio and Space Science, Onsala Observatory,Chalmers University of Technology, 43992 Onsala, Sweden131415161718192021222324Argelander Institut für Astronomie. Auf dem Hügel 71, 53121Bonn, GermanyObservatoire de Paris, LERMA, CNRS, 61 Av. de l’Observatoire,75014 Paris, FranceESO, Casilla 19001, Santiago 19, ChileObservatorio Astronómico Nacional (OAN) - Observatorio deMadrid, Alfonso XII 3, 28014 Madrid, SpainLeiden Observatory, Leiden University, PO Box 9513, 2300 RALeiden, The NetherlandsATNF, CSIRO, PO Box 76, Epping, NSW 1710, AustraliaCentro de Astrobiología (INTA-CSIC), Ctra de Torrejón a Ajalvir,km 4, 28850 Torrejón de Ardoz, Madrid, SpainKOSMA, I. Physikalisches Institut, Universität zu Köln, ZülpicherStraße 77, 50937 Köln, GermanyUniversity of British Columbia Okanagan, 3333 University Way,Kelowna, BC V1V 1V7, CanadaIRAM, 300 rue de la Piscine, 38406 St. Martin d’Hères, FranceCalifornia Institute of Technology, MC 105-24, 1200 East CaliforniaBoulevard, Pasadena, CA 91125, USAJAC, 660 North A’ohoku Place, University Park, Hilo, HI 96720,USASRON Netherlands Institute for Space Research, Landleven 12,9747 AD Groningen, The NetherlandsPage 5 of 5
M33 was mapped with PACS & SPIRE in parallel mode in two orthogonal directions, in 6.3 h on January 7, 2010. Observations were executed with slow scan speed of 20 /s, covering a re-gion of about 70 70 . Data were taken simultaneously with the PACS green and red channel, centered on 100 and 160 μm.