Transcription
Journal of Cancer Therapy, 2018, 9, 605-612http://www.scirp.org/journal/jctISSN Online: 2151-1942ISSN Print: 2151-1934TK1 Membrane Expression May Play a Role inthe Invasion Potential of A549 Lung CancerCellsEvita G. Weagel1*, Juan Mejía2, Roman Kovtun1, Joshua Keller1,Juan A. Arroyo2, Richard A. Robison1, Kim O’Neill1Department of Microbiology and Molecular Biology, Brigham Young University, Provo, UT, USADepartment of Physiology and Developmental Biology, Brigham Young University, Provo, UT, USA12How to cite this paper: Weagel, E.G.,Mejía, J., Kovtun, R., Keller, J., Arroyo, J.A.,Robison, R.A. and O’Neill, K. (2018) TK1Membrane Expression May Play a Role inthe Invasion Potential of A549 Lung Cancer Cells. Journal of Cancer Therapy, ceived: June 20, 2018Accepted: August 21, 2018Published: August 24, 2018Copyright 2018 by authors andScientific Research Publishing Inc.This work is licensed under the CreativeCommons Attribution InternationalLicense (CC BY en AccessAbstractThymidine kinase 1 (TK1) is a well-studied cancer biomarker. It is commonlyfound upregulated in the serum of cancer patients, and its levels correlatewith stage and grade, disease progression, and prognosis. It has recently beenreported that TK1 localizes on the plasma cell membrane of hematologicaland solid malignancies, and not on the membrane of normal healthy cells,and while on the membrane, TK1 has enzymatic activity. However, the function of TK1 on the surface membrane is not well understood. Here, we hypothesize that it may have a role in tumor invasion and migration. It hasbeen shown that TK1 expression levels positively correlate with epithelia tomesenchymal transition (EMT) markers in patients with breast cancer asthey progress from HER2 to triple negative breast cancer. In this study, wesilenced TK1 expression by siRNA and show that TK1’s membrane expression is significantly downregulated at 60 hours post transfection. Using aMatrigel-based quantitative invasion assay, we measured cell invasion potential in cells either expressing or lacking TK1 on their membrane and foundthat cells that lack TK1 on their membrane exhibit decreased invasion potential. These results suggest that TK1’s presence on the membrane may play arole in invasion and cell migration in cancer.KeywordsThymidine Kinase 1, Invasion, EMT1. IntroductionThymidine kinase 1 (TK1) is a nucleotide salvage pathway enzyme primarily reDOI: 10.4236/jct.2018.98052Aug. 24, 2018605Journal of Cancer Therapy
E. G. Weagel et al.sponsible for converting deoxythymidine to deoxythymidine monophosphate,and upon subsequent phosphorylation is incorporated into DNA [1]. Duringnormal cell proliferation, TK1 is usually found in the cytoplasm where its expression is cell cycle-dependent, peaking during G1/S phase [2]. TK1 levels canalso increase in response to DNA damage, especially after chemotherapy and radiotherapy. This increase is thought to provide cancer cells with a supply ofnucleotides for DNA repair rather than for proliferation, and serves as a supportmechanism to promote the survival of cancer cells [3]. Due to its tight regulationby the cell cycle, TK1 has been extensively studied in the context of cancer diagnostic biomarkers, where it has been shown to be upregulated in tissue and serum in both solid tumors and hematological malignances. TK1’s prognostic anddiagnostic potential has been demonstrated using the traditional TK activity radioassay for hematological malignancies and solid tumors including lung, breast,colon, bladder, cervical, and colorectal [4]-[9]. TK1 levels in serum have alsobeen shown to have diagnostic potential in bladder cancer, cervical carcinoma,gastric cancer, non-small cell lung cancer, colorectal cancer, and renal cell carcinoma. In summary, high TK1 serum levels correlate with tumor aggressivenessand can be indicative of early events in carcinogenesis [10] [11]. While TK1 hasmostly been studied as a cancer biomarker in the serum, we have recently shownthat TK1 localizes on the plasma membrane of cells, this is an event independentof proliferation and appears to be exclusive to malignant cells. For these reasons,TK1 may be a novel target for cancer immunotherapy. However, understandingTK1’s function on the membrane is important as we approach the developmentof immunotherapy using TK1 as a target. Recently, it was reported that TK1 expression levels correlate with EMT markers in breast cancer in clinical samplesas the disease progresses to triple negative breast cancer [12]. Additionally, because serum TK1 correlates with disease progression and aggressiveness, we hypothesized that membrane TK1 could have an immunoregulatory role and couldaid in the invasion potential of cancer cells. In this study, we found that whenmembrane TK1 expression is silenced, cells lose invasion potential. These resultssuggest that TK1 may have a role in migration and immunoregulation, as well asin epithelial mesenchymal transitions (EMT).2. Materials and Methods2.1. Cell Line and Cell CultureThe non-small cell lung carcinoma A549 cell line was purchased from ATCC(Catalog # CCL-185 ) and cultured in RPMI 1640 medium supplemented with10% fetal bovine serum (FBS) and 2 mM L-glutamine (both from Thermo FisherScientific, Waltham, MA). Cells were grown at 37 C and 5% CO2 and fed 2 - 3times per week by removing the medium, rinsing the cells with Dulbecco’sPhosphate-Buffered Saline (DPBS, Gibco Thermo Fisher Scientific, Waltham,MA), incubating them with Accutase (Stem Cell Technology, Vancouver, Canada) for detachment and subculturing in a 1:4 ratio. For this experiment, cellsDOI: 10.4236/jct.2018.98052606Journal of Cancer Therapy
E. G. Weagel et al.were kept at a low passage to ensure best transfection efficiency.2.2. siRNA LibraryThree validated siRNA against TK1 and control siRNA (GAPDH) were purchased from Thermo Fisher Scientific (catalog # 4390824, siRNA IDs s14158,s14159, and s14160 for TK1, and catalog # 4390849 for GAPDH). siRNA was resuspended in nuclease-free water at 50 uM, aliquoted, and stored at 80 C. Forworking siRNA concentrations, siRNA was diluted to 10 uM in nuclease-free water.2.3. TransfectionTwo hundred-thousand A549 cells were plated in 6 well-plates overnight toallow for attachment, after which, the medium was removed, and cells werewashed with DPBS and 2 mL serum-free RPMI 1640 was added to each well.Lipid-nucleic acid complexes of RNAiMAX (Thermo Fisher Scientific, Waltham,MA, catalog # 13778030) and siRNA were prepared according to the manufacturer’s instructions and added to the cells. 12 hours after transfection, mediumand lipid-nucleic acid complexes were removed from cells and fresh completeRPMI 1640 medium was added to the cells. Cells were used at 60 hours posttransfection, as recommended by manufacturer. (Cells treated with siRNA ID14158 were named siRNA 58, those treated with siRNA ID 14159 were namedsiRNA 59, and those treated with siRNA ID 14160 were named siRNA 60).2.4. Flow CytometryTransfected A549 cells were rinsed with DPBS, treated with Accutase at 37 C for5 - 10 mins to allow for detachment, and then rinsed with complete medium.Cells were pelleted and resuspended at 1 106 cells/mL in Cell Staining Buffer(BioLegend, San Diego, CA) and 200 uL of cells were placed in individual microcentrifuge tubes and incubated with 5 uL of Fc block (Human TruStain FcX ,BioLegend, San Diego, CA) for 10 minutes at room temperature, followed byincubation with 1 ug of anti-TK1 antibody (ab91651, Abcam, Cambridge, United Kingdom) for 15 minutes on ice. Cells were then washed with 1 mLCellStaining Buffer, incubated with anti-rabbit AlexaFluor647 antibody (ThermoFisher, Waltham, MA, cat # A27040) and incubated on ice in the dark for 15minutes. Cells were washed 2X with Cell Staining Buffer and resuspended inFluorescence-activated cell sorting (FACS) buffer. FACS buffer was made withphosphate-buffered saline (PBS), 2% calf serum (Thermo Fisher, Waltham,MA), 1 mM EDTA (Thermo Fisher, Waltham, MA, CAS 6381-92-6), and 0.1%sodium azide (Sigma Aldrich, St. Louis, MO, CAS 26628-22-8). We collected 1 104 events per sample in a flow cytometer (Accuri C6 Plus, BD Biosicences, SanJose, CA) and data was analyzed using FlowJo software (FlowJo, Ashland, OR).2.5. Invasion AssayAn xCELLigence RTCA DP instrument (Cat. 05469759001) was utilized to deDOI: 10.4236/jct.2018.98052607Journal of Cancer Therapy
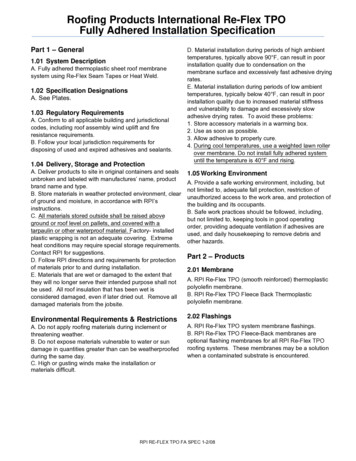
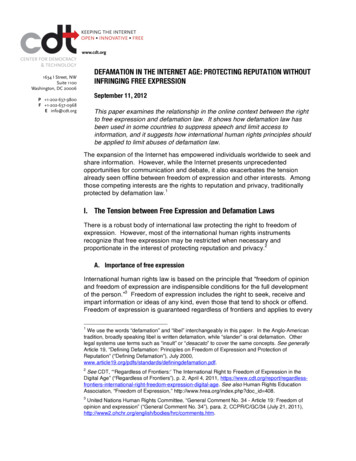
E. G. Weagel et al.termine real time invasion and cell motility of A549 cells either expressing TK1on their surface or after TK1 silencing. Invasion was assessed in 16 wellCIM-Plates (Cat. 05665817001) (n 4) composed of an upper and lower chamber, each containing 16 wells. The top wells were coated with a 1:40 Matrigelconcentration and incubated for 4 hrs. Cells were plated in the top chamber at aconcentration of 50,000 cells/well in serum-free RPMI in a total volume of 100µL in the presence of the cells’ corresponding media. The cells were allowed tomigrate toward the bottom chamber wells which were filled with 160 µL of 10%FBS growth medium, as a source of chemoattractant (directional migration).The cells were then placed in the RTCA DP instrument and invasion readingswere taken every 5 minutes for 24 hrs.2.6. Statistical AnalysisThe flow cytometry data was analyzed with a one-way ANOVA test using theSidak’s correction for multiple comparisons to compare the expression of TK1on the surface of the siRNA treated cells vs. isotype control. P-value significancewas set at 0.05. Error bars represent the standard error of the mean. Statisticalanalyses were performed using Prism software.3. Results3.1. Flow CytometryTo assess TK1 silencing on the surface of A549 cells, a cell line known to expresshigh levels of membrane TK1, we stained the control and siRNA treated cellswith antibodies against TK1. We chose to quantify silencing by flow cytometrybecause TK1 is a known cytoplasmic protein and we wanted to directly assess itsexpression on the cell membrane only. Flow cytometry revealed that A549 cellstreated with siRNA targeting TK1 displayed decreased expression of TK1 on thesurface. Cells treated with siRNA 58 and siRNA 59 showed significant reductionof TK1 on the surface, while siRNA 60 did not show a significant reduction(Figure 1). Cells treated with siRNA 58 had the most dramatic silencing in TK1surface expression with a 93.82% reduction in surface expression compared tocells treated with control siRNA. Cells treated with siRNA 59 showed a 15.98%reduction at 60 hours post transfection.3.2. Invasion StudyTo compare the invasion potential of A549 cells, with and without TK1 surface expression in vitro, we performed an invasion assay with A549 cellstreated with control siRNA, siRNA 58, siRNA 59, and siRNA 60. In ourstudy, the invasion potential of cells was measured by the cells crossing alayer of Matrigel from serum-free medium towards complete medium, as theyseek nutrients. We performed the experiment in an xCELLigence RTCA DP instrument, which is used to determine real time invasion over a period of time. Inour results, we observed that when TK1 is highly silenced on the membrane, theDOI: 10.4236/jct.2018.98052608Journal of Cancer Therapy
E. G. Weagel et al.Figure 1. Membrane expression of TK1 by flow cytometry at 60 hours post siRNA transfection. (a) Histograms showing membrane expression of TK1 compared to GAPDH and HLA. A549 cells transfected with siRNA 58 show a significant shift to the leftwhen stained with TK1 antibody, suggesting decreased TK1 expression on the surface; (b) Quantification of flow cytometry datashowing the percentage of cells positive for APC stain; (c) Quantification of flow cytometry data showing that transfection of A549cells with siRNA 58 decreases TK1 expression by 93.82%.invasion potential is reduced. In fact, only cells treated with siRNA 58, whichhad the most reduction of membrane TK1 expression, showed a significant reduction in invasion potential. Cells treated with siRNA 59 and siRNA 60 werestatistically equally invasive to cells treated with control siRNA (Figure 2). Weobserved no change in cell viability before the invasion assay. Due to the shortwindow of time post transfection, we did not evaluate growth rates. However,cell counts were similar between all transfected samples, suggesting no change inproliferation rates.4. DiscussionTK1 has been studied as a serum biomarker since the late 80’s. While its clinicalapplication has been proven to be useful as a monitoring tool for disease progression and prognosis of most cancers, our group has found it to be a potentialtarget in the clinic. TK1 was recently reported to be differentially expressed onthe membrane of hematological and solid malignancies compared to normalcells. The localization of TK1 on the membrane appears to be an event unique inmalignancy, as highly proliferative tissue like colon or normal lymphocytes induced to divide do not express TK1 on their surface. This posed the question asto why malignant cells upregulate TK1 on their surface and whether this givesthe malignant cells an advantage. Recently, it was reported that stemness andEMT markers were more positively and strongly correlated to TK1 levels inDOI: 10.4236/jct.2018.98052609Journal of Cancer Therapy
E. G. Weagel et al.Figure 2. Invasion assay with A549 cells transfected with TK1 siRNA. Only A549 cells that had a drastic TK1 silencing show decreased invasion compared to control siRNA treated cells.Table 1. Summary of Spearman’s correlation coefficients between TK1 and cell stemness or EMT markers in HER2 and TNBCpatients.Gene nameFunctionHER2 : TK1 vs. gene(Spearman’s correlationcoefficient)TNBC: TK vs. gene(Spearman’s correlationcoefficient)CD44Cell–cell interactions, cell adhesion and migration. Stemness marker.0.140.24SNAI1Induction of epithelial to mesenchymal transition. 0.010.13SNAI2Induction of epithelial to mesenchymal transition. 0.3 0.14TWIST1Induction of epithelial to mesenchymal transition. 0.34 0.02ZEB1Induction of epithelial to mesenchymal transition. 0.36 0.35TGFBInduction of cell migration and epithelial to mesenchymal transition. 0.23 0.13triple negative breast cancer compared to HER2 breast cancer, indicating thatTK1 expression levels may also correlate with tumor invasion potential (summarized in Table 1) [12]. While not all genes show positive correlations, there is apositive trend in the Spearman’s correlation coefficients between TK1 expressionand these cell stemness and EMT markers between HER2 and TNBC patients.Here we report that when we silence TK1 on the surface of A549 cells, their invasion potential decreases significantly. Further studies showing a connection ofTK1 and migration or EMT markers could elucidate a potential immunoregulatoDOI: 10.4236/jct.2018.98052610Journal of Cancer Therapy
E. G. Weagel et al.ry function.Conflicts of InterestThe authors declare no conflicts of interest regarding the publication of this paper.References[1]Chen, Y.-L., Eriksson, S. and Chang, Z.-F. (2010) Regulation and Functional Contribution of Thymidine Kinase 1 in Repair of DNA Damage. The Journal of Biological Chemistry, 285, 2]Mutahir, Z., Clausen, A.R., Andersson, K.-M., Wisen, S.M., Munch-Petersen, B. andPiškur, J. (2013) Thymidine Kinase 1 Regulatory Fine-Tuning Through TetramerFormation. The FEBS Journal, 280, 158https://doi.org/10.1111/febs.12154[3]Alegre, M.M., Robison, R.A. and O’Neill, K.L. (2014) The Clinical Significance andBiology of Thymidine Kinase 1. Oncology-Theory and Practice, iConcept PressLtd., Australia.[4]Alegre, M.M., Robison, R.A. and O’Neill, K.L. (2013) Thymidine Kinase 1: A Universal Marker for Cancer. Cancer and Clinical Oncology, 2, 159[5]Wu, B.-J., Li, W.-P., Qian, C., Ding, W., Zhou, Z.-W. and Jiang, H. (2013) IncreasedSerum Level of Thymidine Kinase 1 Correlates with Metastatic Site in Patients withMalignant Melanoma. Tumor Biology, 34, aki, R., Hata, K., Moriyama, M., Iwanari, O., Katabuchi, H., Okamura, H., etal. (2001) Clinical Value of Thymidine Kinase in Patients with Cervical Carcinoma.Oncology, 61, 47-54. /doi.org/10.1159/000055352DOI: 10.4236/jct.2018.98052[7]Svobodova, S., Topolcan, O., Holubec, L., Treska, V., Sutnar, A., Rupert, K., et al.(2007) Prognostic Importance of Thymidine Kinase in Colorectal and Breast Cancer. Anticancer Research, 27, 793[8]Luo, P., He, E., Eriksson, S., Zhou, J., Hu, G., Zhang, J., et al. (2009) Thymidine Kinase Activity in Serum of Renal Cell Carcinoma Patients Is a Useful PrognosticMarker. European Journal of Cancer Prevention, 18, rl?sid WKPTLP:landingpage&an J.0b013e328329d817[9]Zhang, J., Jia, Q., Zou, S., Zhang, P., Zhang, X., Skog, S., et al. (2006) ThymidineKinase 1: A Proliferation Marker for Determining Prognosis and Monitoring theSurgical Outcome of Primary Bladder Carcinoma Patients. Oncology Reports, 15,455-461. nal of Cancer Therapy
E. G. Weagel et al.[10] Gronowitz, J.S., Hagberg, H., Källander, C.F. and Simonsson, B. (1983) The Use ofSerum Deoxythymidine Kinase as a Prognostic Marker, and in the Monitoring ofPatients with Non-Hodgkin’s Lymphoma. British Journal of Cancer, 47, nder.fcgi?artid 2011337&tool pmcentrez&rendertype abstracthttps://doi.org/10.1038/bjc.1983.78[11] Alegre, M.M., Weyant, M.J.M.J., Bennet, D.T., Yu, J.A., Ramsden, M.K., Elnaggar,A., et al. (2014) Serum Detection of Thymidine Kinase 1 as a Means of Early Detection of Lung Cancer. Anticancer Research, 34, 2145.short[12] Weagel, E.G., Burrup, W., Kovtun, R., Velazquez, E.J., Felsted, A.M., Townsend,M.H., et al. (2018) Membrane Expression of Thymidine Kinase 1 and PotentialClinical Relevance in Lung, Breast, and Colorectal Malignancies. Cancer Cell International.DOI: 10.4236/jct.2018.98052612Journal of Cancer Therapy
Flow Cytometry Transfected A549 cells were rinsed with DPBS, treated with Accutase at 37 C for 5 - 10 mins to allow for detachment, and then rinsed with complete medium. . 104 events per sample in a flow cytometer (Accuri C6 Plus, BD Biosicences, San Jose, CA) and data was analyzed using FlowJo software (FlowJo, Ashland, OR). 2.5. Invasion Assay