Transcription
Guide to Performing Relative Quantitation of GeneExpression Using Real-Time Quantitative PCR1
Guide to Performing Relative Quantitation of Gene ExpressionUsing Real-Time Quantitative PCRTable of ContentsSection I: Introduction to Real-Time PCR and Relative Quantitation of GeneExpressionpg 41.2.3.4.IntroductionWhat is Relative Quantitation?Terms and AcronymsRelative Quantitation of Gene Expression Requires the Quantitation of TwoDifferent Genes (Target and Endogenous Control)5. Factors Affecting Accurate Real-Time PCR Results6. What is PCR Amplification Efficiency?Section II: RNA Preparation and Reverse Transcriptionpg 141. Introduction2. Quantifying Input RNA3. Reverse Transcription (RT) for Relative Quantitation of Gene Expressiona. Two-step RT-PCRb. One-step RT-PCR4. Selecting Reverse Transcription and Real-Time PCR Reagents5. Determination of Input RNA Amounts for a Relative QuantitationStudy6. Identifying PCR Inhibition7. How Much Genomic DNA Contamination can be Tolerated in a RelativeQuantitation of Gene Expression Assay?Section III: Assay Selection and Design for Relative Quantitationpg 301.2.3.4.Selecting or Designing Primers and TaqMan Probes for Relative Quantitation ofGene ExpressionTaqMan Gene Expression AssaysCustom TaqMan Gene Expression AssaysTaqMan MicroRNA AssaysUse of Primer Express Software for the Design of Primer and Probe Sets forRelative Quantitation of Gene ExpressionDesign of Assays for SYBR Green I Applications5.Section IV. Identification and Selection of Endogenous Controls for RelativeQuantitationpg 371. Uniformity of Endogenous Control Expression.2. Validation of Target and Control Genes for the Comparative CT Method3. Multiplexing Endogenous Controls and Target GenesSection V. Customized and Pre-Configured Relative Quantitation Gene ExpressionProductspg 391. TaqMan Low Density Arrays (Custom)2. TaqMan Low Density Arrays Gene Signature Arrays3. TaqMan Cytokine Gene Expression Plate 14. TaqMan Human Endogenous Control Plate2
Section VI. Ordering Real Time PCR Reagentspg 42Section VII. Relative Quantitation of Gene Expression Experimental Design andAnalysispg 431. Introduction2. The Relative Standard Curve Methoda. Example of the Standard Curve Method: Using an IndependentSample for a Standard Curveb. Standard Deviation Calculations Using the Standard Curve Methodpg 523. The Comparative Ct Method (ΔΔCT Method)a. A Validation Experiment is Necessary to Determine if your ΔΔCTCalculation is Validb. Plotting the Results of the Validation Experimentc. Validation Experiment Resultsd. The Comparative CT Method (ΔΔCT Method): Data Analysis Examplee. What if a ΔΔCT Value is Positive?Appendix A Definitionspg 60Appendix B Reagents, Protocols, and Supporting Documentationpg 643
Section IIntroduction to Real-Time PCR andRelative Quantitation of Gene Expression1. IntroductionReal-time quantitative PCR offers researchers a powerful tool for the quantitation oftarget nucleic acids. To understand the value that real-time PCR provides over traditionalPCR methods and to obtain basic information on chemistries and strategies, you canreview the following tutorials:Real Time PCR vs. Traditional PCREssentials of Real Time PCRThis document guides you through performing relative quantitation of gene expressionusing real-time PCR technologies developed by Applied Biosystems. It assists you inunderstanding the foundations of relative quantitation and provides guidance forselecting assays, experimental strategies, and methods of data analysis. The informationpresented is relevant for all instrumentation, reagents, and consumables provided byApplied Biosystems. This tutorial expands on many of the topics that are introduced inUser Bulletin #2: Relative Quantitation of Gene Expression.Throughout this tutorial there are many hyperlinks to external sites, documentation, andlinks to pages within this document. After you go to one of these hyperlinks, click theback button on your browser to return to your original location in the document.Applied Biosystems offers a variety of systems on which real-time quantitative PCR canbe performed. These real-time PCR instruments are: Applied Biosystems StepOne Real-Time PCR SystemApplied Biosystems StepOnePlus Real-Time PCR SystemApplied Biosystems 7300 Real-Time PCR SystemApplied Biosystems 7500 Real-Time PCR SystemApplied Biosystems 7500 Fast Real-Time PCR SystemApplied Biosystems 7900HT FAST Real-Time PCR SystemABI PRISM 7000 Sequence Detection System4
2. What is Relative Quantitation?Methods for relative quantitation of gene expression allow you to quantify differences inthe expression level of a specific target (gene) between different samples. The dataoutput is expressed as a fold-change or a fold-difference of expression levels. Forexample you might want to look at the change in expression of a particular gene over agiven time period in a treated vs. untreated samples.For this hypothetical study, you can choose a calibrator (reference) sample (i.e.untreated at day 0) and an endogenous control gene to normalize input amounts. For allsamples, levels of both target and endogenous control genes would be assessed by realtime PCR. The results (target levels normalized to endogenous control levels) would thenbe expressed in a format such as “At day 30, sample A had a 10-fold greater expressionlevel of the target gene than at day 0”.If you want to obtain absolute quantities of gene targets you need to perform absolutequantitation, which is beyond the scope of this document. Please see the following formore information about setting up and analyzing absolute quantitation (standard curveexperiments): Applied Biosystems 7300/7500/7500 Fast: Absolute Quantitation, Using StandardCurve Getting Started GuideApplied Biosystems 7900HT: Absolute Quantitation, Using Standard CurveGetting Started GuideApplied Biosystems StepOne : Standard Curve Experiments Getting StartedGuide3. Terms and Acronyms – The following terms and acronyms are used throughout thisdocument. Additional information on specific definitions is available in Appendix A or by clickingon the appropriate cationefficiencyBaselineCalibratorCTDefinitionAn active signal used to normalize experimental results. Endogenouscontrols are an example of an active reference. Active referencemeans the signal is generated as a result of PCR amplification. Theactive reference has its own set of primers and probe.A PCR product generated from a DNA or cDNA template.The rate at which a PCR amplicon is generated, commonly measuredas a percentage value. If a particular PCR amplicon doubles inquantity during the geometric phase of its PCR amplification then thePCR assay is said to have 100% efficiency. The value assigned to theefficiency of a PCR reaction is a measure of the overall performanceof a real-time PCR assay.The background fluorescence signal emitted during the early cycles ofthe PCR reaction before the real-time PCR instrument detects theamplification of the PCR product.A sample used as the basis for comparative expression results. Seealso reference sample.Threshold cycle. The CT is the cycle number at which the5
fluorescence generated within a reaction crosses the threshold line.CT values are logarithmic and are used either directly (comparative CTmethod) or indirectly (interpolation to standard curves to create linearvalues) for quantitative analyses.Custom TaqMan Gene Expression Assays are products designed,Custom TaqMan Gene synthesized, and delivered as pre-mixed primers and TaqMan MGBprobe sets based on sequence information submitted by theExpressioncustomer.ProductsCustom TaqMan Genotyping Assays are products designed,Customsynthesized, and delivered as a set of pre-mixed primers andTaqMan TaqMan MGB probes based on sequence information submitted byGenotypingthe customer.ProductsTherange (maximum to minimum) of sample concentrations or inputDynamic rangeamounts that a given assay is capable of detecting.A gene sequence contained in a sample that is used to normalizeEndogenoustarget quantities. In addition to the target sequence, an endogenouscontrolcontrol is quantified as a means of correcting results that can beskewed by input nucleic acid loading differences. Endogenouscontrols are an example of an active reference.An amplification that uses the same PCR reagents as anotherExperimentalamplification and that uses template preparations from similar but notreplicateidentical samples. Experimental replicates provide information aboutthe overall precision of the experiment. For example, if you want toexamine the effect of drug treatment on the level of a mouse mRNA,you would treat multiple mice identically with the drug to determinethe variation of response in the mouse population. A group of tenmice would represent ten experimental replicates.An amplification performed in multiple wells using the same templateIdenticalpreparation and the same PCR reagents. Identical replicates provide:replicate(Technical Data preservation: If amplification fails in one well, replicates inReplicate)other wells can potentially provide data. Monitoring: Replicates can be used to monitor the precision of thePCR amplification and detection steps.A dye that provides an internal fluorescence reference to which thePassivereporter dye signal can be normalized during data analysis. Thereferencereference dye does not participate in the PCR reaction. Thisnormalization corrects for fluorescence fluctuations that are caused bychanges in reaction concentration or volume. Failure to use a passivereference dye can compromise accurate target quantitation. AppliedBiosystems incorporates the internal passive reference dye ROXTM inall of its real-time PCR chemistries.6
Amplification and Detection Step: The degree to which identicalreplicates give similar values (degree of agreement). This type ofprecision can be used to monitor the accuracy of template andreagent pipetting, homogeneity of template, and instrumentperformance.Experimental: The degree to which experimental replicates givesimilar values.Note: For relative quantitation, better precision (identical andexperimental) enables smaller fold differences in nucleic acid copynumber to be distinguished with greater statistical confidence.A series of design and experiment guidelines developed by AppliedRapid assayBiosystems that specify:developmentguidelines The use of Applied Biosystems Genomic Assays or automatedprimer and probe design using Primer Express Software The use of TaqMan Universal PCR Master Mix or SYBR Green IPCR Master Mix (provides standardized componentconcentrations and simplifies assay set-up) Universal thermal cycling parameters (enables multiple assays tobe run on the same plate) Default primer and probe concentrations (to eliminate assayoptimization).An active fluorescence signal used to normalize experimental results.ReferenceEndogenous and exogenous controls are examples of activeGenereferences. An active reference means the signal is generated as theresult of PCR amplification using its own set of primers/probe.A sample used as the basis for comparative expression results. SeeReferencealso calibrator.SampleA sample of known concentration used to construct a standard curve.StandardsTaqMan Endogenous Controls are assays for housekeeping genesTaqMan that are commonly used as endogenous controls. Several areEndogenousavailable in with VIC TaqMan MGB probes in primer limited formatControlsfor multiplexing purposes. Organisms include: human, mouse, rat, andeukaryotic 18S.TaqMan Gene Expression Assays are biologically informative, preTaqMan formulated gene expression assays for rapid, reliable detection andGenequantification of mRNA transcripts from several model organisms.ExpressionEach product is delivered as pre-mixed primers and TaqMan MGBAssaysprobe at a 20X concentration TaqMan Genotyping Assays are biologically informative, validatedTaqManprimer and probe sets for detection of human SNPs. Each product isGenotypingdelivered as pre-mixed primers and TaqMan MGB probes at a 20XAssaysconcentrationTaqMan miRNA Assays include a miRNA specific RT primer and aTaqMan miRNA Assays 20X mix of a TaqMan MGB probe and primers. Assays are availablefor several model organisms.TaqMan MGB Fluorogenic probes that are designed and synthesized as TaqMan MGB probes contain a minor-groove-binding moiety that enhances theprobesTm differential between matched and mismatched probes. In addition,Precision andStatisticalTests7
TargetTest sampleThresholdTaqMan MGB probes contain a nonfluorescent quencher thatprovides enhanced spectral resolution when using multiple dyes in areaction. TaqMan MGB probes are ideal for use in both geneexpression and SNP analysis assays using the 5’ nuclease assay.An RNA or DNA sequence, or gene of interest.A sample compared against a calibrator as a means of testing aparameter change (for ex., the expression level of a gene) after anintervention such as a drug treatment, tumor transformation, growthfactor treatment and so on.A level of normalized reporter signal that is used for CT determinationin real-time assays. The level is set to be above the baseline butsufficiently low to be within the exponential growth region of anamplification curve. The cycle number at which the fluorescencesignal associated with a particular amplicon accumulation crosses thethreshold is referred to as the CT.4. Relative Quantitation of Gene Expression Requires Quantitation of TwoDifferent Genes (Target and Endogenous Control)To obtain accurate relative quantitation of a mRNA target, it is recommended to alsoevaluate the expression level of an endogenous control. By using an endogenous controlas an active reference, you can normalize quantitation of targets for differences in theamount of total nucleic acid added to each reaction. For example, if you determine that acalibrator sample has a two-fold greater amount of endogenous control than a testsample you would expect that the calibrator sample was loaded with two-fold more cDNAthan the test sample. Therefore, you would have to normalize the test sample target bytwo-fold to accurately quantify the fold-differences in target level between calibrator andtest samples. Some factors that can cause total cDNA or RNA sample loadingdifferences are: Imprecise RNA measurement after extraction RNA integrity Inaccurate pipettingFor detailed information regarding endogenous controls, see:"Identification and Selection of Endogenous Controls for Relative Quantitation".5. Factors Affecting Accurate Real-Time PCR ResultsA variety of factors must be considered when setting-up real-time PCR reactions. Duringthe initial set up it is important to include identical replicates for each input amount. Theuse of these replicates can help in identifying precision issues. After performing a realtime PCR run, you can gauge the accuracy of the results. If identical replicate sampleshave a CT standard deviation 0.3 and/or a standard curve has a correlation coefficient(R2 value) 0.99, the accuracy of the data is questionable. Some experiments may onlytolerate low variation among identical replicates, for example, if you are looking for lowfold changes in target expression. It is important to appreciate that due to statistical8
distribution there is always a high level of CT variation when target quantities approachsingle copy (CT values of 34 - 40). Therefore, sample masses that yield CT values in thisrange will unavoidably give rise to poorer precision and consequently less power todetect low-fold changes. The following practices help to achieve accurate real-time PCRresults.a. Use high quality RNAPoor quality RNA samples can lead to spurious real-time PCR results. Poorquality RNA preparation can be characterized by one or more of the following:Table 1: Effects of a poor quality RNA sample on PCR resultsCharacteristics of a poorPotential impact on PCR resultsquality RNA sampleCo-extracted proteinsPCR inhibition due to the presence of proteins and/orincluding RNasesdegradation of RNA template due to the presence ofRNasesCarry-over chemicalsPCR inhibition(eg. Phenol)Degraded RNA templateCo-extracted genomic DNALoss of detection of rare transcriptsCan serve as a PCR template and can confound RNAdetection resultsSee Section II “RNA Preparation and Reverse Transcription” for information onhow to evaluate the quantity and quality of the RNA template and how tocharacterize the presence of PCR inhibitors and/or genomic DNA.b. Test sample masses that yield results within the dynamic range of theassayFor more information see "Determination of input RNA amounts to be used in arelative quantitation study."c. Use the same pool of standards and/or calibrator through the wholestudyFore each study, it is recommended to prepare large pools of standard andcalibrator cDNAs then aliquot these cDNAs into single-use tubes. Preparingand using the same pool of standard and calibrator cDNAs through thecompletion of a study can provide consistent real-time PCR results.d. Use reagents that contain the internal reference dye ROX Applied Biosystems software normalizes reporter dye signals to the passivereference dye ROX . This normalization can compensate for minor variationsin signal strength, which results in better precision. All Applied Biosystems real time PCR reagents contain ROX dye.e. Use PCR master mixes and PCR reagent cocktailsThe use of PCR master mixes and PCR reagent cocktails will help reduce thepotential variability introduced from pipetting multiple reagents during setup.9
(i) Real-time PCR master mixes: Applied Biosystems real-time PCRMaster Mixes contain all of the components of the real-time-PCR reactionexcept primers, probe and nucleic acid template. Use of these greatlyreduces the chances of introducing pipetting errors during setup as well asvariations in formulation.(ii) PCR reagent cocktails: Mix all of the components of a reaction into areagent cocktail (PCR reagents, primers, probes, water, and so on) thendispense into the wells of a reaction plate. For an example of a real-timePCR reagent cocktail, refer to the tutorial Reconstituting and DilutingPrimers and TaqMan Probes, pages 3 and 4.f. Perform accurate sample and reagent pipettingAccurate pipetting with regularly calibrated pipettors is critical to obtainingaccurate and precise data. Low volume pipetting (i.e., 5μl) can contribute toimprecision and pipetting of volumes less than this is not recommended, unlessthe pipettors are designed for these low volumes and are regularly calibrated. Itis also recommended to briefly spin down the sealed plates, via low speedcentrifugation, prior to running on the machine. The following table lists someof the consequences of inaccurate pipetting.Table 2: Consequences of inaccurate pipettingPipetting problemSample: Poor pipetting of identical replicatesConsequenceHigh CT standard deviationsStandards: Poor pipetting of standardsHigh CT standard deviations (identicalreplicates), R2 value 0.99Standards: Consistent pipetting excess ofPotentially good R2 value 0.99, howeverdiluent in serial dilution (ex. 100 μL instead of slope of standard curve will be inaccurate;perceived lower PCR efficiency of assay90 μL)Standards: Consistent pipetting deficit ofPotentially good R2 value 0.99, howeverdiluent in serial dilution (ex. 80 μL instead of 90 slope of standard curve will be inaccurate;perceived higher PCR efficiency of assayμL)Standards: Consistent pipetting excess ofstandard sample in serial dilution (ex. 12 μLinstead of 10 μL)Standards: Consistent pipetting deficit ofstandard sample in serial dilution (ex. 8μLinstead of 10 μL)Potentially good R2 value 0.99, howeverslope of standard curve will be inaccurate;perceived higher PCR efficiency of assayPotentially good R2 value 0.99, howeverslope of standard curve will be inaccurate;perceived lower PCR efficiency of assayg. Thoroughly mix PCR reagentsThe various components within a real-time PCR reaction can settle out and bedistributed unevenly within a reaction set up and can have an effect onprecision. It is important to thaw and thoroughly mix all reagents during the setup procedure.10
h. Use assays with high PCR efficienciesPCR efficiency can be used to gauge the performance of a real-time PCRassay. Poor PCR efficiencies can result in poor quantitation. For information onestimating PCR efficiency, reference the section entitled “What is PCRAmplification Efficiency?”.Applied Biosystems TaqMan Gene Expression Assays have amplificationefficiencies of 100% when using high quality RNA. If your RNA is of poorquality (example: degraded, high protein co-purification) the assay efficiencycan be greatly compromised. For more information about RNA quality pleasesee “Assessing RNA Quantity and Quality.”For information on theperformance of TaqMan Gene Expression Assays, reference the ApplicationNote “Amplification Efficiency of TaqMan Gene Expression Assays.”High PCR amplification efficiencies (near 100%) can additionally be achieved ifApplied Biosystems rapid assay development guidelines are followed. Theguidelines recommend: The use of Applied Biosystems TaqMan Gene Expression Assaysor automated primer and probe design using the Primer Express Software.The use of Applied Biosystems TaqMan Universal PCR MasterMix or SYBR Green I PCR Master Mix (provides standardizedconcentration of components that simplify assay set-up).Universal PCR thermal cycling parameters (enable multiple assaysto be run on the same plate).Default primer and probe concentrations of 900 nM forward primer,900 nM reverse primer, and 250 nM probe when using eithercDNA or DNA as a substrate. A primer optimization study isrecommended when using SYBR Green I reagents due to thenon-specific nature of SYBR Green I reagents detection.For additional information see Optimizing primer and TaqMan probeconcentrations.i. Set appropriate baselines and thresholdsTo obtain accurate CT values, it is critical to set appropriate baselines andthresholds. Some Applied Biosystems real-time PCR systems softwarepackages can perform Auto CT and Auto Baseline calculations. If your softwaredoes not have Auto CT and Auto Baseline, or if you choose not to use thisfeature you need to set the baseline thresholds manually. For guidance onmanual baseline and threshold settings, refer to the appropriate system’s User’s Guide. ABI PRISM 7700 Sequence Detection System users can referto "Data Analysis on the ABI PRISM 7700 SDS: Setting Baselines andThresholds".11
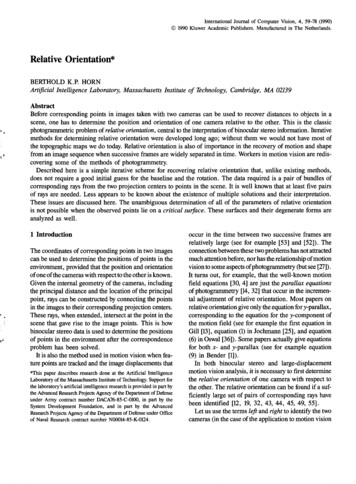
6. What is PCR Amplification Efficiency?Note: Accurate estimation of PCR efficiency depends on a variety of reagent, experimental setup, sample quality, and analysis factors. For a list of factors affecting the quality of real-time PCRresults, refer to Factors Affecting Accurate Real Time PCR Results.PCR amplification efficiency is the rate at which a PCR amplicon is generated, and iscommonly expressed as a percentage value. If a particular PCR amplicon doubles inquantity during the geometric phase of its PCR amplification then the PCR assay has100% efficiency.The slope of a standard curve is commonly used to estimate the PCR amplificationefficiency of a real-time PCR reaction. A real-time PCR standard curve is graphicallyrepresented as a semi-log regression line plot of CT value vs. log of input nucleic acid. Astandard curve slope of –3.32 indicates a PCR reaction with 100% efficiency. Slopesmore negative than –3.32 (ex. –3.9) indicate reactions that are less than 100% efficient.Slopes more positive than –3.32 (ex. –2.5) may indicate sample quality or pipettingproblems. For additional information, see Identifying PCR Inhibition.Note: A 100% efficient reaction will yield a 10-fold increase in PCR amplicon every 3.32 cyclesduring the exponential phase of amplification (log2 10 3.3219).CTReal Time PCR Standard Curvey -3.33x 202R 13331292725232119-4-3-2Log Input-10Predicted YLinear (Predicted Y)Figure 1: Real-Time PCR Standard Curve representing 100% PCR EfficiencyA calculation for estimating the efficiency (E) of a real-time PCR assay is:E (10 –1/slope –1) 100High PCR amplification efficiencies (near 100%) can routinely be achieved if you followApplied Biosystems rapid assay development guidelines and use high quality startingRNA/cDNA template. PCR efficiency can be used to gauge the performance of a realtime PCR assay. Poor PCR efficiencies can result in poor sample replicate precision(identical replicates & experimental replicates) and as a consequence can result in poorquantitation.12
For the comparative CT method of relative quantitation (discussed later in this tutorial) tobe valid, the efficiency of the target amplification and the efficiency of the activereference (endogenous control) amplification must be approximately equal. For moreinformation see “A Validation Experiment is Necessary to Determine if your ΔΔCTCalculation is Valid”.13
Section IIRNA Preparation and Reverse TranscriptionA: RNA Preparation: Obtaining High Quality RNATissue or Cell Sample Collection and DisruptionIsolating high quality, intact RNA is the first and often the most critical step in performing manyfundamental molecular biology experiments including RT-PCR. Proper treatment and handlingof tissues and cells prior to RNA isolation and storage of the isolated RNA are crucialcomponents of obtaining high quality RNA.I. Appropriate Sample Storage and Processing1. Fresh: Most animal tissues can be processed immediately after harvest. It is importantto keep fresh tissues on ice and to process them within 30 minutes of dissection.2. Frozen: Samples are usually frozen on dry ice or in liquid nitrogen when:a) they are collected over a period of time and cannot be processedsimultaneously,b) there are too many samples to process at once,c) samples are collected in the field, ord) the mechanical processing of fresh samples is insufficient for thoroughdisruption.While freezing allows the researcher to postpone RNA isolation, it is time consuming andmakes subsequent RNA isolation a more laborious process.3. Tissue Storage Solutions:a) Ambion RNAlater Tissue Storage:RNA Stabilization Solution allows the researcherto postpone RNA isolation for days, weeks, or even months after tissue collectionwithout sacrificing RNA integrity, and potentially without freezing the sample.Dissected tissue or harvested cells are simply dropped into the RNAlater solution atroom temperature. The solution permeates the cells and stabilizes the RNA. Thesamples are then stored at 4 C. Samples can be shipped on wet ice or even at roomtemperature if shipped overnight. Figure 1 below shows the integrity of RNA isolatedfrom tissues stored in RNAlater solution at 4 C, room temperature, and at 37 C.Samples stored at 4 C generate intact RNA even after storage for one month.Tissue and cells stored in RNAlater Solution are compatible with most RNAisolation procedures.b) Ambion RNAlater -ICE Frozen Tissue Transition Solution is a novel reagent fortransitioning frozen tissue to a state that is easily processed for extraction of highquality RNA. Frozen tissues are simply submerged in RNAlater -ICE and allowed to14
thaw overnight at -20 C. Once thawed, the tissues can be processed like freshtissues using standard RNA isolation procedures.Figure 1. High Quality RNA Isolated From Tissue Stored in RNAlater Tissue Storage:RNA Stabilization Solution. RNA was purified from the tissues using TRI Reagentl (Ambion ). Five µg of each RNA sample was separated ona denaturing agarose gel. Panel A shows ethidium bromide-staining of the gel.6Panel B shows a Northern blot of the same gel hybridized with 10 cpm/mL of4an RNA probe to p53 and 10 cpm/mL of an RNA probe to GAPDH, using the Ambion NorthernMax Kit.II. Complete, Quick Sample DisruptionFast and thorough sample disruption is another essential component of RNA isolation andaffects RNA yield and quality. Slow disruption by placing cells or tissues in a denaturant lysissolution without any additional physical shearing may result in RNA degradation by endogenousRNases that are inaccessible to the lysis solution. Incomplete disruption may also result indecreased yield because some of the RNA remains trapped in intact cells and is unavailable forpurification.1. Mechanical Disruption of fresh and frozen tissue, cultured cellsa) Fresh: When disrupting fresh tissue, all cells need to be sheared immediately at thetime the lysis solution is added. Samples should never be left undisrupted in lysissolution. Mechanical methods for disrupting fresh tissue and cells includehomogenization by the following methods: using a Dounce or mechanical homogenizer,vortexing, sonication, use of a French press, and bead milling.b) Frozen: Frozen samples are disrupted by grinding in liquid nitrogen with a mortar andpestle. During this process, it is important that the equipment and tissue remain atcryogenic temperatures—the tissue should be dry and powdery after grinding. Grindingshould be followed by thorough homogenization with a Dounce or mechanicalhomogenizer in a lysis buffer. Samples stored frozen in the Ambion RNAlater solutionor in the Ambion RNAlater -ICE solution can be processed like fresh tissue asdescribed earlier.15
c) Cultured Cells: Cells grown in suspension are collected by centrifugation, washed,and resuspended in a lysis solution. Lysis is completed by immediately vortexing orvigorously pipetting the solution. Attached cells can be lysed directly on the culture plate.Lysis solution is added directly to the plate or flask and cells are scraped into thesolution. The lysate is then transferred to a tube and vortexed or pipetted to ensurecomplete cellular disruption. Alternately, cells can be detached, and processed assuspension cultures. Placing the flask or plate on ice while washing and lysing the cellswill further protect
Methods for relative quantitation of gene expression allow you to quantify differences in the expression level of a specific target (gene) between different samples. The data output is expressed as a fold-change or a fold-difference of expression levels. For example you might want to look at the change in expression of a particular gene over a