Transcription
View metadata, citation and similar papers at core.ac.ukbrought to you byCOREprovided by UTPediaTotal Productive Maintenance Assessment on Discrete Manufacturing SystembyMohd Fairozlan Bin Ahmad TarmiziDissertation submitted in partial fulfilment ofthe requirements for theBachelor of Engineering (Hons)(Mechanical Engineering)JANUARY 2008Universiti Teknologi PETRONASBandar Seri Iskandar31750 TronohPerak Darul Ridzuan1
CERTIFICATION OF APPROVALTotal Productive Maintenance Assessment on Discrete ManufacturingSystembyMohd Fairozlan Bin Ahmad TarmiziA project dissertation submitted to theMechanical Engineering ProgrammeUniversiti Teknologi PETRONASin partial fulfilment of the requirement for theBACHELOR OF ENGINEERING (Hons)(MECHANICAL ENGINEERING)Approved by,(Mr. Kamal Ariff Bin Zainal Abidin)UNIVERSITI TEKNOLOGI PETRONASTRONOH, PERAKJanuary 20082
CERTIFICATION OF ORIGINALITYThis is to certify that I am responsible for the work submitted in this project, that theoriginal work is my own except as specified in the references and acknowledgements,and that the original work contained herein have not been undertaken or done byunspecified sources or persons.MOHD FAIROZLAN BIN AHMAD TARMIZI3
ABSTRACTThis project focuses on improvement and improvisation of a manufacturing line by usingTotal Productive Maintenance concept as tools to help reduce the amount of losses due tomachine breakdown and other blockage during production. The main objective of thisproject is to reduce the frequency of breakdown in order to avoid losses to scrap and alsoto increase internal supply chain performance in a given four month period. Themethodology of this project consists of visual observation of the actual production lineand at the same time doing the time study to help find out the waiting time for anybottleneck point and variability effect. Manufacturing simulation software WITNESSalso has been used in order to find the number of throughput in a controlled condition andshortest time possible. From that three models were developed to ensure every parameteris considered before taken into the real operation. Input data for the simulation is attainedfrom real data from copper wire factory. Model 1 is generated based on reliabilityanalysis, model 2 is focused on queuing theory and waiting time and model 3 is based onbuffer flexibility. The model is generated to target time of four month time usingWITNESS software. The breakdown problem in model 1 has been reduced from 40breakdowns per month to 25 breakdowns per month which is about 37.5% reductions.The total throughput from model 2 yield 16800 kg of copper wire compared to normalmodel which yield 8400 kg in a basis of four month. Model 2 is preferable to be use inreal production base on highest throughput yielding and considerable amount ofbreakdown per month.4
ACKNOWLEDGEMENTThanks to Allah for his blessings and opportunity given during the progress of thisproject. It is sure that without his help, this project will not be successfully completed.A highest appreciation to the supervisor, Mr. Kamal Ariff Zainal Abidin for hisgenerosity and kind consideration of collaborating me with his guidance, knowledge,motivation and many hours of consultations all to ensure that I have manage to completethis project.A many thanks to all mechanical engineering lecturers and technicians for helping me tocomplete this project. Not to forget Mr Matthias Wieland who has been a big help for mesince the first day of the project. Thank you to FYP committee and coordinators, who hasbeen very helpful in giving useful information and coordinating my final year project forthe last two semesters.Last but not least thanks to all my friends and families who has encourage me to do thisproject and those who involved directly and indirectly for the successful of this project.Their support, help and guidance are highly appreciated and only Allah can repay theirkindness.5
TABLE OF CONTENTSCERTIFICATION.i.iiACKNOWLEDGEMENT .iiiABSTRACT .CHAPTER 1:INTRODUCTION .1.1Background of Study .1.2Problem Statement .1.3Problem Identification1.4Significant of the Project1.5Objectives. .1.6Scope of Study.1.7The Relevancy of the Project1.8Feasibility of the Project.111222333CHAPTER 2:THEORY.2.1TPM Concepts.2.2TPM Principles.2.3TPM Quantitative Elements2.4Reliability Analysis .2.5Supply Chain Management2.6Variability in Production2.7Queuing Theory.44579121417CHAPTER 3:METHODOLOGY .3.1Procedure Identification.3.2Devised Plant Model for The Wire Company3.3Computer Simulation .18182029CHAPTER 4:RESULTS AND DISCUSSION.4.1Performance Measure of Production Level .4.2Time Study .313133CHAPTER 5:CONCLUSION AND RECOMMENDATION5.1Conclusion 376
LIST OF FIGURESFigure 2.1A conceptual depiction of TPM concepts and five pillarsFigure 2.2Reality DistributionsFigure 2.3A histogram of time to failureFigure 2.4probability density functionsFigure 2.5A probability density function of exponential distributionFigure 2.6Graphical depiction of low and moderate variabilityFigure 3.1Example of copper wire spool demand through production in drawing area.Figure 3.2General depiction of MTS and MTO product relationFigure 3.3Reliability block diagram representing each level in a serial productionFigure 3.4Reliability block diagram representing each with the existence of MTSFigure 3.5Process job route designed for old modelFigure 3.6Process job route designed for model 1Figure 3.7Process job route designed for model 2Figure 3.8Process job route designed for model 3LIST OF TABLESTable 3.1Top 5 produced copper wire specification for each diameter sizeTable 3.2Production input parameter for old modelTable 3.3Production input parameter for model 1Table 3.4Production input parameter for model 2Table 3.5Production input parameter for model 3Table 4.1Non production time during productionTable 4.2Non production time resulted from bottleneck operationTable 4.3Waiting time representation7
8
CHAPTER 1INTRODUCTION1.1 BACKGROUND OF STUDYThe current project is focused on the optimization of the copper wire plant system. The plant works indiscrete workstations whereby the production system is based on several levels. The factory is usingfirst in first out operation so that the production can be registered neatly. Productive maintenance plansuggest the use of preventive measure during planning in production. The machine will actually workevery time with the variable set up time and breakdown time. By reducing the amount of both times,the production will achieve more value added period which will help decrease the capital cost. In thismatter, increasing the profit implying decrease of cost of production as the element of trading are notyet involved.1.2 PROBLEM STATEMENTDiscrete manufacturing system are consists of several cluster of machine designed to be in specificarea due to its production requirement and geographical attributes of the factory. Despite having agood localized production system, this system is vulnerable to loss of communication to eachworkstation working outside the designated area. This harvests some critical problems especiallywhen the machines stop running due to near end life time. Those problems are;1. The output of production deteriorates by 25% from factory standard.2. Increase of frequent bottleneck problem in drawing area forcing labor to remove wire spools toother area increasing buffer area.3. Very high of scrap rate due to frequent breakdown which increase by 30% in the past six month.1
1.3 PROBLEM IDENTIFICATIONThe current problems which always delay the project are mostly the legal document when doing dataretrieval.Some of the issues also include:1. Buffer starvation due to increase in variability in production process.2. High quantity in Finished Good Inventories (FGI) due to unpredicted customer demand.3. Poor line balancing as the product does not have a justified production route.4. Increase in inventory level which slows production speed and excessive use ofmaterials.1.4 SIGNIFICANT OF THE PROJECTThe project is focused on a method or plan to decrease the set up time and forecasting the unplannedbreakdown time in order to decrease downtime and speed up manufacturing process. The Total ProductiveMaintenance has the entire tool to help improve the production performance and reduce loss problem dueto high scrap rate.1.5 OBJECTIVEThe objective of this project is to produce an effective production system based on productive maintenancesystem which is:1.To increase mean time between failure of drawing and enameling machine during busy hours.2.Provide a suitable routing for supply chain in order to reduce the amount of bottleneck in eachworkstation.3.To devise a working process plan in order to help to reduce breakdown problem and increaseproduction quantity.1.6 SCOPE OF STUDYThe scope of study is mainly on the total improvement of the plant where the total productive maintenanceis used as a new concept of changing the system works. The queuing theory will be used to monitor supplychain performance.1.7 THE RELEVANCY OF THE PROJECT2
The project is important to explain the effect of machine breakdown related to increase in bottlenecksituation in discrete manufacturing. The discreet manufacturing is more complicated as it doest nothave stable buffer capacity and also waiting time. Thus the project in this area of production is criticalto find the actual key factor of the problem and how to control it.1.8 FEASIBILITY OF THE PROJECTRight now the project is going to simulation and analysis phase as the data are yet to be collected.The project will be given about four month of period to actually collecting data in this period so thatit is more accurate and reliable. The project mostly covers only the breakdown analysis, materialplanning and waiting line models which can be carried out with several tests and simulation.3
CHAPTER 2THEORY AND LITERATURE REVIEW2.1 TPM CONCEPTSTotal Productive Maintenance (TPM) is defined as “concept that incorporates a plant methodologywhich enables continuous and rapid improvement of the manufacturing process through use ofemployee involvement, employee empowerment and closed-loop measurements of results”.(Robinson, Ginder, 1993, p.3)The concept came up with “several elements of strategies that have been defined by the JapanInstitute of Plant Maintenance”. (Suzuki, 1994, p.6). These strategies are to(1) maximize overall equipment effectiveness,(2) establish an understanding preventive maintenance (PM) system covering the life oftheequipment,(3) involve all departments that plan, and maintain equipment,(4) involve all employees from top management to front-line workers and(5) promoting preventive maintenance through motivation management.2.2 TPM PRINCIPLESTPM principles are based on five important elements known as “The Five Pillars of TPM”. Eachpillars represent different area that supports the TPM concept and applied to ensure increasedproductivity and free of equipment degradation. The principles as defined as;2.2.1Planned maintenancePlanned maintenance activities is described the activities which is planned by reducing the need to doreactive maintenance. This will ensure increase in equipment reliability and uptime, reduce qualitydefects and improve safety.4
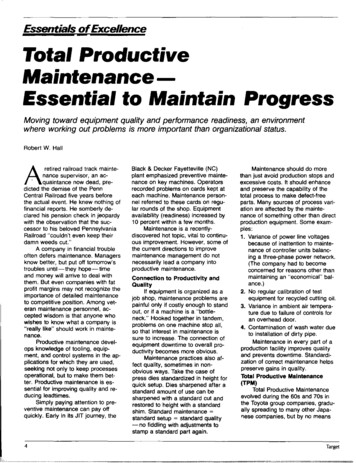
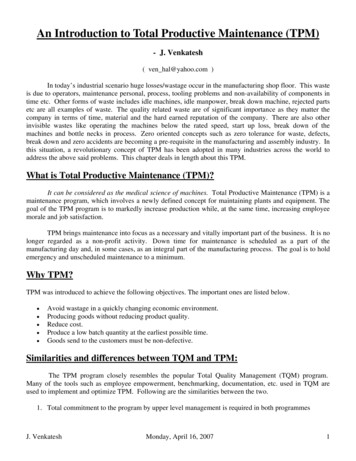
2.2.2Maintenance freeThis system is designed to practice the concept which equipment will need less maintenance in orderto improve reliability. Also if the equipment requires maintenance the system will help to speedrecovery process so the equipment can become operational faster.2.2.3Individual kaizenKaizen is one of the important concepts in Japan manufacturing industry that uses TPM as a methodof improvement. Its philosophy is the search of continuous improvement. Kaizen impose activities tobe directed towards improvement. Therefore, any team activity that focuses on the increasingequipment effectiveness, quality improvements or any area of business is considered fall under areaof kaizen.2.2.4Education and trainingAnother important concept of TPM is education and training. By acquiring knowledge, theemployees should be able to improve their effectiveness and quality of work. This depends on theirinvolvement and understanding of equipment and knowledge.2.2.5Self maintenanceThis maintenance is referring to a basic program of maintenance activities which are performed bythe operators. Some of self maintenance involves with activities like cleaning, dusting andlubricating. The graphical interpretation of the whole TPM ideas is shown in the figure below:5
ualkaizenEducational& TrainingSelfMaintenance5-SSafetyFigure 2.1: A conceptual depiction of TPM concepts and five pillars. (Stephens, 1992, p. 75)By adding quality and safety into the picture, it is also rather interesting to find the term 5-s in thefigure 2.1. It pointed that “The 5-s is a concept for a house keeping and it refers to five Japaneseword that start with letter “s”. It represents tidiness, organization, cleanliness and discipline”.(Stephens,1992,p.75). The five Japanese words is seiri (sorting), seiton (organization), seiso(sweeping, workplace hygiene),seiketsu (neatness) and shitsuke (strictness or discipline).2.3 TPM QUANTITATIVE ELEMENTS2.3.1Preventive Maintenance6
Preventive maintenance is defined as equipment inspection and testing to avoid premature equipmentfailures, and lubrications, cleaning, adjusting, and minor component replacement to extend equipmentlife. (Tomlingson, 1993. p. 23, p.27.)2.3.2PurposePreventive maintenance generally helps the reduction of equipment failures by implementing (1)equipment inspection to uncover deficiencies before failure and in sufficient time, plan deliberaterepairs(2)non-destructive testing techniques (predictive maintenance) to detect equipmentdegradation and monitor equipment condition to identify abnormal operation.(3) conditionmonitoring by preserving equipment life with;i.Lubrication to reduce friction or any other tribological effect on the equipment movingparts.ii.Routine cleaning and adjusting done in conjunction with inspection or lubrication, orperformed by operators.iii.Replacement of minor components to reduce chances of more important componentsfailing.2.3.3Cost of preventive maintenanceThe management system must always determine the return on investment (ROI) before allocate anyadditional investment for a preventive maintenance program. This is to ensure that the financial stateis sufficient for the program to go on. The problems with the return it is literally impossible tosegregate the intrinsic return of the investment of a few minutes of the operators’ time per day fromthe tangible financial benefits.By focusing on breakdown frequency we could justify just how much the preventive maintenance canhelp the situation in financial way. By starting with number of expected breakdowns we come to theequation by Stephens;Expected breakdowns Σ[(Number of failures) (Frequency)]Total frequency7
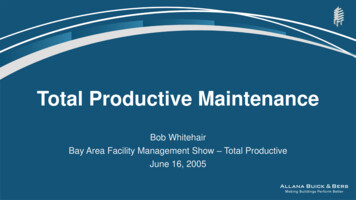
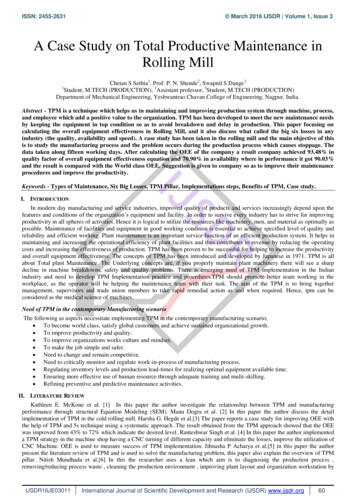
This lead to the cost by multiplying the number of PM procedures by the failure risk for the cost perfailureNumber of annual PM Available hours per year / PM frequencyAnnual PM cost Number of annual PM Cost per PM. . Cost of failure Number of PM per year (1- reliability) Cost per failureThus,Total cost of PM Annual PM cost Cost of failures (with PM)2.4 RELIABILITY ANALYSIS2.4.1DefinitionReliability is pointed as measure of production system to identify how the machine can producequality product before it fails and is a very useful toll to determine the maintenance level of eachproduction. The reliability of equipments, products and facilities is a crucial consideration duringdesign. It is significant to the planner and is a factor to consider in quality management and inmaintenance and replacement.Figure 2.2 shows the classic “bath tub” pattern. It determines the failure rate, i.e. the quantity offailures per unit time, expresses as a fraction of number of good products. There are three phasesinvolved:1-2 ‘burn-in’ or ‘infant mortality’ or ‘early life’ failures;2-3 ‘random’ or ‘normal operating, or, middle life, failures;3-4 ‘wear-out’ or ‘old age’ failures.8
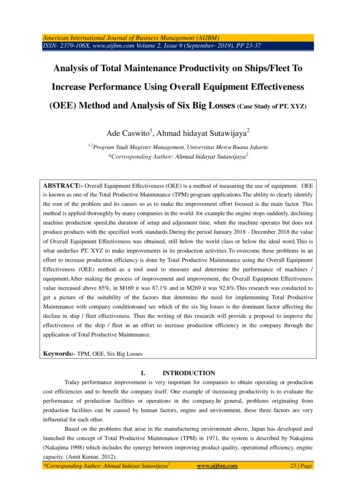
Failure RateFigure 2.2: Reality Distributions2.4.2Relative Frequency HistogramTo determine the probability of failure occurring between times ti-1 and ti, we can multiply theordinate y by the interval (ti-1, ti). Further observation in Figure 2.3 will discover that “probability ofa failure occurring between to and tn, where to and tn are the earliest and latest times, respectively, atwhich the equipment has broke down, is unity. This is valid only if the failure is occurring in theinterval (to, tn) and the area of the histogram”. (Jardine, Tsang, 2006, p.222)Figure 2.3: A histogram of time to failure (Jardine, Tsang, 2006, p.222)9
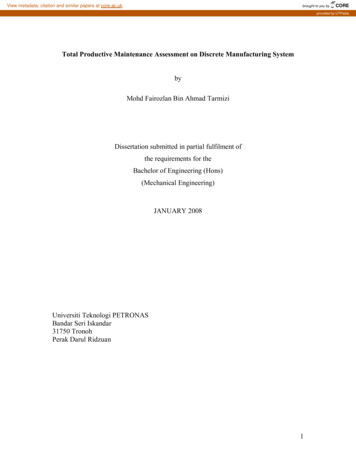
2.4.3Probability Density FunctionIn maintenance studies the probability density function is rather utilized rather than relative frequencyhistograms. This is because1.Most of the time the modeling variable such as time to failure is a continuous variable.2.It is the most easier to be exploited and utilize and,3.It gives a clearer clarification of the true failure distribution.Probability density distribution is similar to frequency histogram but it uses continuous curve insteadof bar, giving an advantage in accuracy in plotting data and tabulation. Figure 2.4 shows thegraphical interface of probability density distribution. The equation of the curve of the probabilitydensity function is depicted by f (t).Figure 2.4: Probability density function. (Jardine, Tsang 2006, p.222)As shown in figure 2.4, the curve has changes shape due to several modifications in the function ofthe probability density function. In this case, the function f(t) is denoted by f(t) 0.5 exp (-0.5t).Similar to relative frequency diagram the area under the curve is equal to 1.Figure 2.5: A probability density function of exponential distribution. (Jardine, Tsang, 2006,p.223)In figure 2.5, the probability (hazard) of a failure occurring between times ti and tj can be noted bythe shaded area under the curve. By using calculus method, this area can be the integral between tiand tj of f(t) represented by,tj f(t)dt10
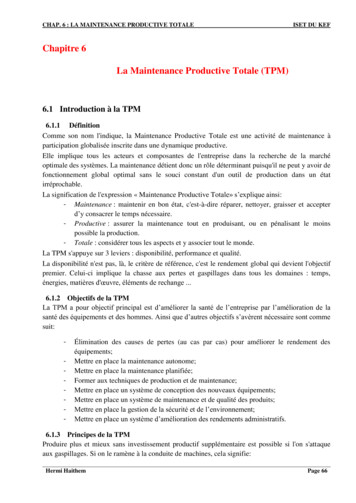
tiThus the probability of a failure to be occurred in between period t0 and t is thent0 f(t)dt 1t 2.5 VARIABILITY IN PRODUCTION2.5.1Process time variabilityThe random variable of primary interest in manufacturing is the effective process time of a job at aworkstation. The label effective is quoted because we are referring to the total time observed by a jobstation. By implementing this from logistical view, we could assume that if machine B is idle becauseit is waiting for a job to finish on machine A, it does not important to identify whether the job isactually being processed or is being put on hold due to maintenance of machine A. It is still give thesame impact to machine B. this condition and other effects will be put together into one aggregatemeasure of variability.2.5.2Measures and classes of variabilityTo analyze variability in an accurate manner some quantitative method should be done. This can beachieved by using standard measures from statistics to determine a set of factory physics variabilityclasses.Variance is a measure of absolute variability (denoted by σ2) is the same condition as the standarddeviation (Represented by σ) determined as the square root of variance. Normally obsolete variabilityis less critical than relative reliability. As example a standard deviation of 50 micrometers (μm)would show excessively low variability in the length of bar with a nominal length of two inches, butwould represent higher variability for a diameter of a copper wire whose mean diameter is 25micrometers.The term coefficient of variation (CV) is an appropriate measure of the variability. The variable t isused as mean because we are considering time as primary random variables. Thus the coefficient canbe written asc σtIn many cases, sometime it is easy to to use squared coefficient of variation (SCV)2.5.3c2 σ2t2Low and average variability11
In process time view it is better to think that the actual time that a machine or an operator spends onthe job by eliminating failure or setup condition. This period of time will actually generate a classicbell-shaped curve on the probability distribution. The curve in figure 2.6 shows the process time witha mean of 20 minutes and a standard deviation of 6.3 minutes. It can be seen that the area under thecurve is symmetrically distributed around the value of 20. Thus CV for this condition is around 0.32and classified as low variability range.Figure 2.6: Graphical depiction of low and moderate variabilityThe classes of variability has been standardize to develop easy understanding of a situation and tohelp planner plan for better control in process time. Table 2.1 below shows the classes of variabilityaccordingly.Variability ClassLow (low Variability)ModerateHigh (HV)Coefficient of VariationC 0.750.75 c 1.33Typical SituationProcess times without outagesProcess times with shortadjustments (e.g setups)C 1.33Process times with longoutages (e.g, failures)Table 2.1: Classes of variability (Hopp, Spearman, p. 252)2.6 SUPPLY CHAIN MANAGEMENTThe objective of every production is to produce as many end items in a shortest amount of time. Thiscan be achieved if there is a good inventory control which determine the relationship of eachproduction level and provide clearer condition for monitoring. In modern terms, the overall systemwide coordination of inventory is formerly konown as supply chain management. (Jardine, Tsang,2006, p.582, p.583 p.587)There are four categories of inventory which is crucial to ensure a good supply chin management:12
1.Raw materials in which denoted as components, subassemblies or materials that arepurchased outside the plant and then used for further production function and process.2.Work in process (WIP) which includes all unfinished items that have been released to theproduction line.3.Finished Good Inventory (FGI) is finished product that has yet to be sold or distributed.4.Spare parts which are define as the components that are used during maintenance or repairof production machine.2.6.1Raw MaterialsThere is not possible to always receive new raw materials from supplier in a given time beforeproduction. Thus most manufacturers carry stocks of raw materials. There are three main factors thatcontrol the size of these stocks.1.Batching. This refer to the inventory that addresses batching consideration as cycle stocks,since it represents stock held between ordering cycles.2.Variability. When the production start early from the planned start date, the deliveries willbe behind schedules or quality problems will cause excessive scrap loss. The line will shutdown because of the lack of materials when there is not enough extra stock.3.Obsolescence. Changes in demand or design will render some materials no longer required,thus some inventory in manufacturing systems does not address either of the abovepurposes.2.6.2Work in Process (WIP)Most of the production line should have a clear and steady WIP in order to ensure low variability andefficient manufacturing. The WIP can be identified as on of these conditions:1.Queuing if it is waiting for a resource (person, machine, or transport device)2.Processing if it is worked on by a resource.3.Waiting for batch if it has to wait for other jobs to arrive in order to form a batch. The batchmay serve as a bulk for a manufacturing operation or a move operation.4.Moving if it is actually being transported between resources.5.Waiting to match if it consists of components waiting at an assembly operation for theircounterparts to arrive so that assembly can be done. Once the entire set has arrived, anyadditional waiting time for the assembly will be considered as queuing time.2.6.3Finished Good inventory (FGI)13
Some end products have to just wait in the warehouse to be distributed to customer instead ofhaving delivered a soon after the production has ended. Thus many manufacturers have FGI afterproduction to keep them on hold after production. There are five factors that issues FGI;1.Customer responsiveness. To provide delivery lead times that are shorter than manufacturingcycle times, many firms make use of Make-to-stock (MTS) policy. This is influenced by thecommodity properties of product whereby the price is set by the market. The only issue ishow to deliver this to customer effectively. The amount of FGI needed to support a givenmake-to-stock system depends on the variability of customer demand and the desired levelof customer service.2.Batch production. If the production occurs in pre specified quantities (batches), then outputwill sometimes not match customer orders and any excess will go into finished goodinventory.3.Forecast errors. When jobs are released without firm customer orders, either to restore stockin a make-to-stock system or to meet anticipated orders in a make-to-order system, productwill be built that does not sell as predicted. This leftover will end up in FGI.4.Production variability. In a MTS system where orders can not be distributed early, somevariability effects in production timing will cause product to be in FGI while waiting forshipment. In either a make-to-order of a make-to-stock system, variability in productionquantity can result in overproduction relative to demand. This excess also will go to FGI.5.Seasonality. Some products will have demand which varies greatly with changing of season.Thus some manufacturers tend to produce this as a built-ahead inventory which laterbecomes part of FGI.2.6.4Spare Parts.Spare parts are defined as materials that are used in production but not directly to the product.They only support production by getting the machine running and avoid waste of time due tounplanned breakdown. The primary reasons for stocking up spare parts are;1.Service. The main function of any spare parts is to support maintenance and repair process.F a repair personnel must wait for a part from outside the plant, it will greatly increase repairtime which is nor preferable in any occasion. Thus to increase the service level a goodamount of spare parts should be in the stock.2.Purchasing and production lead times. If spare parts could be bought or producedinstantly, there is no need to stock them ahead of production. However this is not possiblethus to attain a certain service, spare parts should always be in the stock.3.Batch replenishment. If there are economies of scale in replenishing spare parts than it issensible to buy them in bulk.14
2.7 QUEUING THEORYThe science of waiting is known as queuing theory. A queuing system is “a combination thecomponents that have been considered so far which is an arrival process, a service process and aqueue”. (Groover, 2001,p 800, p.801.). In other verification it is noted that “all the results in queuingtheory suggest that both the arrival and the service processes are random”. (Nahmias, 2005,p. 457,p.458).Arrivals can consist of individual jobs or batches. Jobs can be identical or have differentcharacteristics. Inter arrival times can be set as constant or random. The workstation can have a singlemachine or cluster of machine in parallel, which can have constant or random process times. Thequeuing discipline can be first- in-first-out (FIFO), last-come-first-served (LCFS), earliest due date(EDD), shortest process time (SPT) or any schemes feasible. The queue space can be unlimited offinite.2.7.1Notation and measuresIn order to use queuing theory to determine the performance of a single workstation, some of theparameters are standardize. Table 2.2 shows the variables that denotes the parameterVariablesDescriptionraRate of arrival in jobs per unit time to station.ta1/ra; average time between arrivalscaArrival coefficient of variability(CV)mNumber of parallel machine at station.bBuffer sizeteMean effective process time. The rate of theworkstation is given by re m/teceCV of effective process timeTable 2.2: Queuing notations and variables used15
CHAPTER 3METHODOLOGY3.1 PROCEDURE IDENTIFICATIONMost of the data were acquired in a real working machine which is connected to a response feedbacksystem of the factory indoor mechanism system. The systems tabulates every 30 minutes the exact statuswhich is live information to retain reliability. The common method used for this analysis is to recall backthe information from this live input and output data for the past four month from 12th February. Theprocedure includes (by sequence):1.Identifying planning condition and parameters from drawing and enameling machine2.Quantify waiting time, throughput time and unplanned time in between production of eachworkstation.3.Analyzing buffer condition which includes quantity of spool and type available.4.Produce report on WIP for production, reliability status and performance measure and plantproductivity.5.Develop several simulations and testing on the data obtained to prove the theory.6.Devise several production plant models to pin point problematic area of production.18
3.1.1Identifying planning conditionThe most critical part of this project is to know the ground data which is the data of copper wire processbefore, during and after the production. Mostly the data from the production is based on copper wirespecification and machine capabilities. By manipulating this critical data a new and improved design couldbe design which can abolish small flaw in the production. Analysis focuses on five wire type or product asthey represent more weight in average and has more value added properties due to continuous demand fromcustomer. The dat
Total Productive Maintenance (TPM) is defined as "concept that incorporates a plant methodology which enables continuous and rapid improvement of the manufacturing process through use of employee involvement, employee empowerment and closed-loop measurements of results". (Robinson, Ginder, 1993, p.3)