Transcription
American International Journal of Business Management (AIJBM)ISSN- 2379-106X, www.aijbm.com Volume 2, Issue 9 (September- 2019), PP 23-37Analysis of Total Maintenance Productivity on Ships/Fleet ToIncrease Performance Using Overall Equipment Effectiveness(OEE) Method and Analysis of Six Big Losses (Case Study of PT. XYZ)Ade Caswito1, Ahmad hidayat Sutawijaya21.2Program Studi Magister Management, Universitas Mercu Buana Jakarta*Corrosponding Author: Ahmad hidayat Sutawijaya2ABSTRACT:- Overall Equipment Effectiveness (OEE) is a method of measuring the use of equipment. OEEis known as one of the Total Productive Maintenance (TPM) program applications.The ability to clearly identifythe root of the problem and its causes so as to make the improvement effort focused is the main factor. Thismethod is applied thoroughly by many companies in the world. for example the engine stops suddenly, decliningmachine production speed,the duration of setup and adjusment time, when the machine operates but does notproduce products with the specified work standards.During the period January 2018 - December 2018 the valueof Overall Equipment Effectiveness was obtained, still below the world class or below the ideal word.This iswhat underlies PT. XYZ to make improvements in its production activities.To overcome these problems in aneffort to increase production efficiency is done by Total Productive Maintenance using the Overall EquipmentEffectiveness (OEE) method as a tool used to measure and determine the performance of machines /equipment.After making the process of improvement and improvement, the Overall Equipment Effectivenessvalue increased above 85%, in M169 it was 87.1% and in M269 it was 92.8%.This research was conducted toget a picture of the suitability of the factors that determine the need for implementing Total ProductiveMaintenance with company conditionsand see which of the six big losses is the dominant factor affecting thedecline in ship / fleet effectiveness. Thus the writing of this research will provide a proposal to improve theeffectiveness of the ship / fleet in an effort to increase production efficiency in the company through theapplication of Total Productive Maintenance.Keywords:- TPM, OEE, Six Big LossesI.INTRODUCTIONToday performance improvement is very important for companies to obtain operating or productioncost efficiencies and to benefit the company itself. One example of increasing productivity is to evaluate theperformance of production facilities or operations in the company.In general, problems originating fromproduction facilities can be caused by human factors, engine and environment, these three factors are veryinfluential for each other.Based on the problems that arise in the manufacturing environment above, Japan has developed andlaunched the concept of Total Productive Maintenance (TPM) in 1971, the system is described by Nakajima(Nakajima 1998) which includes the synergy between improving product quality, operational efficiency, enginecapacity. (Amit Kumar, 2012).*Corresponding Author: Ahmad hidayat Sutawijaya2www.aijbm.com23 Page
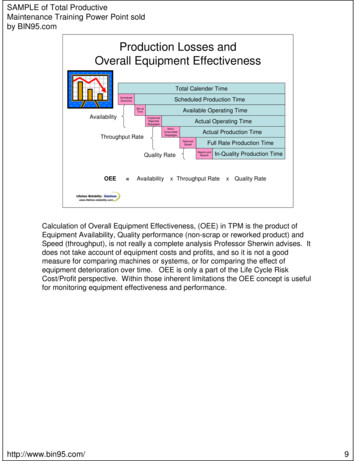
Analysis of Total Maintenance Productivity on Ships/Fleet To Increase Performance Using Over .Maintenance is currently considered as a strategic part and an integral part of business processes andprovides that fact“This creates added value”. Because understanding of the strategic importance of maintenancehas increased, then a company must try to control, properly measure and manage maintenance functions (Baluctet al., 2012).Steps to prevent or overcome these problems in an effort to increase production efficiency is done byTPM that uses the Overall Equipment Effectiveness (OEE) method as a tool used to measure and determine theperformance of machines/ equipment.With the application of TPM that uses the Overall EquipmentEffectiveness (OEE) method to find a picture of the suitability of the factors that determine the need forimplementing Total Productive Maintenance with company conditions and see which factors of the six biglosses are dominantly affecting the decline in the effectiveness of the machine/ equipment.The Research Questions to be examined, what is the main cause of the low performance of the ship/fleet, Breakdown Time, Idle minor stoppage, is the main factor that influences it?, What is the value of OEEvessels in January 2018-December 2018?., what is the achievement of OEE value after making improvements?.,And finnaly How to make improvements and improvements that are appropriate to improve the performance ofthe ship/ fleet?II.THEORY STUDY2.1. MaintenanceAccording to Assauri (2008), Maintenance is an activity to maintain facilities or equipment by carryingout repairs or adjustments or replacements needed in order to create a satisfactory operational productioncondition in accordance with what has been planned. From the above definition, maintenance is all activities sothat the equipment is maintained or returned to certain conditions and fit conditions to carry out its functions.a.Total Productive Maintenance (TPM)According to Nakajima TPM (Total Productive Maintenance) is a program for the fundamental development ofmaintenance functions within an organization, TPM will be able to increase productivity,quality, and minimizecosts (Kurniawan, 2013).The machine operator is responsible for maintaining the machine, apart from being responsible for itsoperations.The application of TPM can realize enormous cost savings through the process of increasingproductivity realized by TPM (Azwar, 2014).Total Productive Maintenance (TPM) aims to maximize the effectiveness of the equipment used in the industry,which is not focused on maintenance but on all aspects of the operation including to increase the motivation ofworkers in the company (Iftari, 2015).The TPM component generally consists of 3 parts,that is:1.Total Approach.In implementing TPM all involved are responsible and maintain all company facilities.2. Productive Action. All employees involved are required to be proactive about the conditions and operations ofthe production facility. 3. Maintenance. Implementation of care and maintenance in increasing the effectivenessof facilities in production operations.b.Overall Equipment Effectiveness (OEE)Overall Equpment Effectiveness (OEE) is a metric that focuses on how effectively a production operation iscarried out. The results are stated in a general form so as to allow comparisons between manufacturing units indifferent industries. OEE calculation values are as follows:OEE (%) Availability (%) Performance Rate (%) Quality Rate (%)Availability is knowing the ratio of operating time to loading time. Loading time is the time available days ormonthly reduced by the planned engine downtime.*Corresponding Author: Ahmad hidayat Sutawijaya2www.aijbm.com24 Page
Analysis of Total Maintenance Productivity on Ships/Fleet To Increase Performance Using Over .Loading Time Total Available Time – Planned Down Time, Operation time is the total effective processingtime. In this case the operation time is the result of reducing loading time with engine downtime.Down Time Breakdown Set Up. Operation Time Loading Time – Down Time. Availability value Operation time /Loading time.c.Perhitungan Performance EfficiencyPerformance efficiency is the ratio of the quantity of products produced multiplied by the ideal cycle time to theoperation time.Performance Efficiency Total Process X Ideal Cycle Time / Operation Time X 100 %Rate of Product Quality is the ratio of good products (good products) in accordance with predetermined productquality specifications to the number of products processed.Rate of Quality Product Procesed amount – Defect amount / Procesed amountX 100 %.Table 1. Standard Overall Equipment EffectivenessAvailability (Ketersediaan)Performance (Kinerja)Quality Yield (Kualitas)Overall Equipment Effetiveness (OEE)d. 90% 95% 99% 85%Cause and Effect DiagramsFishbone Diagram or Cause and Effect Diagram is one of the tools of QC 7 tools that are used to identify andshow the relationship between cause and effect in order to find the root cause of a problem. Fishbone Diagramsare used to show the causative factors and the quality caused by these causative factors. Prof. Kaoru Ishikawafrom Tokyo University in 1953. (Budi kho, 2016)MethodHumanProblemFigure 1 Cause - Effect Diagrame.Repair With 5 W 1 H5W - 1H is one method for making repairs,with analysis or investigation methods:1)What, what is the main target of improvement?2)Why, why such a plan of action is needed?3)Where, where the plan is implemented?4)Who,who will work on the plan activities?5)When, when this action will be carried out?6)How, how to work on the plan.III.METHODThe research methodology describes the procedures regarding research steps that are arrangedsystematically. Systematic steps are needed so that research can be carried out properly and research objectivesthat have been planned can be achieved. This research refers to the formulation of the problem.1.1.Population and SampleThe population that will be discussed is about the equipment that will be analyzed related to OEE, so in this*Corresponding Author: Ahmad hidayat Sutawijaya2www.aijbm.com25 Page
Analysis of Total Maintenance Productivity on Ships/Fleet To Increase Performance Using Over .company the population that will be used is the engine on the ship / fleet.The sample used in this study is the performance of the ship engine / fleet using only the type/ has the samecapacity.1.2.Method of collecting data1.2.1.Primary dataIs data directly obtained from direct research observations in the maintenance area.1.2.2.Secondary dataSecondary data is data in the form of company documentation such as the Daily report, Monthly reportandothers. his secondary data is obtained from company documents, especially reports on ship performance.IV.DATA ANALYSIS4.1. Calculation of Availability RateCalculation of Availability can be seen in Table 4.5 (Table of Availability Rate values in 2018).Availability is the level of operation time ratio to loading time.To calculate the availability of M269 vessels inFebruary 2108, the formula is as follows:Availibility Operationtime/Loadingtime X 100 %. (15.0 /21.0) x 100 % 70.8 %.Table 2. Availability of Vessels Period January to December 03.02.1-TotalOperating 0100.0100.075.357.8100.075.0100.0Source: Daily and Monthly Reports processed, 2018a.Performance Rate CalculationPerformance rate is the level of the ratio of the quantity of product produced to an ideal cycle time tothe time available to carry out the production process (operation time).To calculate the performance value of theJanuary 2018 ship M169 used the following formula:Performance Rate Total Process X Ideal Cycle Time / Operation Time X 100 %Performance Rate (2 trip x 8.3)/ 31.0 x 100% 53.8%.*Corresponding Author: Ahmad hidayat Sutawijaya2www.aijbm.com26 Page
Analysis of Total Maintenance Productivity on Ships/Fleet To Increase Performance Using Over .Table 3. Performance Rate for the period of January to December 2018BulanProcessedAmount (Trip)M169 .02.0Ideal CycleTimeOperation TimePerformance .780.6119.353.882.589.7Total96.7Source: Daily and Monthly Reports processed, 2018b.Calculation of Rate of Quality ProductThe Rate of Quality value of the ship code M169 for data in February 2018 isas follows:Rate of Quality Product Procesed amount – Defect amount / Procesed amountX 100 %Rate of Quality (1(trip) – 0.3)/2(trip) x 100% 67.0 %.Table 4. Rate of Product Quality for the period of January to December rocessed 3.03.03.02.02.03.03.02.03.03.02.0Defect .6Total0.1Rate of 7.346.7100.075.4279.00Source: Daily and Monthly Reports processed, 2018c.Calculation of Overall Equipment Effectiveness (OEE)After the value of the availability rate, performance rate, and rate of quality of the product what the ship isobtained, then the overall equipment effectiveness (OEE) value is calculated to determine the effectiveness ofthe use of ships at PT. XYZ. Standard Overal Equipment Effectiveness (OEE) Ideal Value. OEE calculation isthe result of multiplying the value of availability rate, performance rate, and rate of quality products that havebeen obtained. The OEE M169 value in January 2018 uses the following formula :OEE (%) Availability (%) Performance Rate (%) Quality Rate (%) 100%OEE A x P x Q 1.00 x 0.53 x 1.00 x 100,00 53.0 %*Corresponding Author: Ahmad hidayat Sutawijaya2www.aijbm.com27 Page
Analysis of Total Maintenance Productivity on Ships/Fleet To Increase Performance Using Over .Table 5. Overall Equipment Effectiveness of the January to December .000.840.73Performance 0.960.950.550.801.181.060.801.190.53Rate of verall .586.647.053.0Average55.544.2Source: Daily and Monthly Reports processed, 2018It is known that the highest OEE value is found on the M169 ship in July at 91.8%,M269 in Novemberworth 86.6%and in October worth 80.0%.the lowest OEE value occurred in M169 in September at 27.5%,M269in September valued at 30.2%.If you take the average value of OEE between January to December, each axworth M169 worth 55.2%, and M269 worth 44.2%.d.Six Big LossesFrom OEE calculations to improve ship performance, as a supporter, Six Big Losses is carried out to make iteasier to analyze the root causes of the most dominant problems resulting in suboptimal vessel performance.e.Calculation of Equipment Failure (Breakdown) LossesThe breakdown loss value for M269 vessels for February 2018 data is as follows:Breakdown Loss Total Breakdowns / Loading TimeX 100 %Breakdown Loss 6.3 / 21.7 X 100 % 29.2%.Table 6. Ship Breakdown Loss for the period January to December otal .66.326.025.03.03.02.1TotalLoading 7.931.0Breakdown 16.710.711.17.49.30Source: Daily and Monthly Reports processed, 2018f.Calculation of Setup & Adjustment LossTo find out the percentage of downtime loss caused by the setup and adjusment time, the following formula isused, the M269 ship setup & adjusment values for data in February 2018 are as follows:Setup dan Adjustment Loss Total Setup dan Adjustment / Loading Time X 100 %Setup dan Adjustment Loss 2.3 / 21.6 X 100 % 10.75 %.*Corresponding Author: Ahmad hidayat Sutawijaya2www.aijbm.com28 Page
Analysis of Total Maintenance Productivity on Ships/Fleet To Increase Performance Using Over .Table 7. Equipment Failure (Breakdown) for the period January to December 2018.Setup ktNopDesLoading 27.0031.0027.9231.00Rata - RataSet up &Adjusment 333.703.850.296.562.3310.76Source: Daily and Monthly Reports processed, 2018g.Calculation of Idling and Minor StoppageIdling and Minor Stoppage occurs if the ship stops repeatedly. To find out the percentage of idle loss caused bythe Idling and Minor Stoppage time the following formula is used, the value of the M169 Idling and MinorStoppage for the January 2018 period is as follows:Idling and Minor Stoppage Nonproductive Time / Loading Time X 100 %Idling dan Minor Stoppages 2.0 / 31 X 100 % 6.5 %.Table 8. Idling and Minor Stoppage Vessels Period January to December 2018Loading .024.4Non Productive 32.03.02.03.03.01.00.1-Minor Stoppage 0.710.850.050.06.510.711.13.20.3-9.7512.96Source: Daily and Monthly Reports processed, 2018h.Reduced Speed CalculationReduced Speed is the difference between the actual production speed and the ideal machine production speed.To find out the percentage of Speed loss caused by the time Reduced Speed is lost, then the following formula isused.Reduced Speed Ship values for M169 data in January 2018 are as follows:Reduce Speed Loss Actual Production Time – (IdealCycletime xTotal Product Proses / Loading Time X 100%. 31.0 – 8.33 x 2 / 31 X 100 % 0,46 %.*Corresponding Author: Ahmad hidayat Sutawijaya2www.aijbm.com29 Page
Analysis of Total Maintenance Productivity on Ships/Fleet To Increase Performance Using Over .Table 9. Reduced Speed of Vessels Period January to December 2018BulanTotal ktNopDesM269223322432323112332332ActualIdeal Cycle TimeProductive Time(day)Loading TimeReduced 00Rata - 19(0.15)0.460.19Source: Daily and Monthly Reports processed, 2018i.Rework Loss CalculationRework Loss is the difference between the actual production speed and the ideal machine speed. To find out thepercentage of Defect loss caused by lost Rework Loss time, the following formula is used, M169 Vessel ReworkLoss values for data in January 2018 are as follows:ReworkLoss IdealCycleTime X Rework/Loading Time X 100 % 8.33 X0/31 X 100 % 0 %.j.Yeild / Scrap Loss CalculationYield / Scrap Loss is a loss arising during an operational process that has not yet reached a stable state. To findout the magnitude of the percentage of Defect loss caused by Yeild/ Scrap Loss time lost, M169 Yeild / ScrapLoss value for data in January 2018 is as follows:Yield / Scrap Loss Ideal Cycle Time X Scrap / Loading Time X 100 % 8.33 X 0 / 31 X 100 % 0 %.k.Analysis of DiscussionOverall Equipment Effectiveness Calculation analysis is performed to see the level of effectiveness of the use ofships during the period January - December 2018. Measurement of Overall Equipment Effectiveness is acombination of time factor, the quality of the operation of the ship and the speed of the operational process ofthe ship.During the January s.d December 2018 period, OEE values obtained by vessels operated by PT. XYZ is:1.During the January to December 2018 period, the Availability Rate value on M169 vessels was around93.76%,M269 around 82.49% the average value is 88.1%. This proves that the ship has been operatingoptimally. Seen from the value obtained is higher than the ideal standard that is 90%.2.During the January to December 2018 period, the Performance Rate value for the M169 ship wasaround 82.5%,M269 is around 89.7% with an average value of 86.1%.This proves that the ship is still far fromthe ideal word. Seen from the value obtained is lower than the ideal standard 95%.3.During the January to December 2018 period, the Rate of Quality Product on the M169 ship wasaround 75.42%, M269 is around 79.0% with an average value of 77.2%. This proves that the ship is still farfrom the ideal word. Seen from the value obtained is lower than the ideal standard 99%.4.During the January to December 2018 period, the Overall Equipment Effectiveness value ranged fromM169 to 55.5%,M269 is around 44.2%with an average value of 49.8%.This proves that vessels in 2018 havestill not operated in an ideal state. Seen from the value obtained is lower than the ideal standard 85%.l.i.Analysis of Calculation of Six Big Losses before improvement (January to December 2018)Analysis Identifies the source and root cause of the problem*Corresponding Author: Ahmad hidayat Sutawijaya2www.aijbm.com30 Page
Analysis of Total Maintenance Productivity on Ships/Fleet To Increase Performance Using Over .so that repairs can be done immediately, then an analysis of the six big losses factors that result in loweffectiveness of the engine in OEE calculations, by using a causal diagram. The analysis will be more efficient ifonly applied to the dominant factors. From Table 8 it can be seen that the dominant ones are idling and minorstoppage with an average influence on M169 vesselswith a value of (9.75) and M269 worth (12.9),while thebreakdown losses with an average affect the value on the M169 ship with a value of (6.24)and M269 worth(10.29).Table. 10. The value of big lossesFour Big LossesBreakdown Loss (BL)Total .52Set Up and Adjustment Loss (SAL)2.3310.7612.59Reduced Speed Loss (RSL)0.150.290.830.23Idling Minor Stoppage Loss talm.Persentase %Analysis of Idling and Minor Stoppages Losses & Analysis of Breakdown LossesThe low performance of the ship due to idling and minor stoppages losses & breakdown losses caused bysudden and unexpected damage occurs so that the ship cannot operate. The cause and effect diagram ofbreakdown losses can be seen in Figure 4.5 for details of the effect of the low productivity of the ship caused by,among others :1.Human / Ship Crew Crew less responsive in supervising ship engines when operating. Not careful in treating andrarelyclean boat engines which can cause the engine to stop suddenly.2.Machine Sudden interference often occurs, due to unstable temperatures. Age of old shipengine.3.Method Maintenance process is not standard in ship engine maintenance, the crew only makes repairs whendamage has arisen.4.Environment Effects of fluctuating waters, dangerous during bad weather.In the estuary waters large logs oftenhamper the trip and sometimes get into the ship's engine. And often the tides of the river water when mooring sothat resulted in ships demolished.5.Material Stock spare parts are often empty / sparpart delivery for too long. Poor materia parepart quality (easilycracked, damaged, broken or broken)n.Cause / Fishbone DiagramThrough the Pareto diagram it can be seen that the factor that gave the biggest contribution from the six biglosses factor is Idling minor stoppage M169 of (9.75%)and M269 (12.96%)followed by M169 Breakdown Loss factor of (6.24%) and M269 of (10.29%).According to the Pareto Rule (80% rule), the cumulative percentage value close to or equal to 80% becomes apriority issue that will be discussed next.Therefore, these two factors will be analyzed using cause and effectdiagrams.*Corresponding Author: Ahmad hidayat Sutawijaya2www.aijbm.com31 Page
Analysis of Total Maintenance Productivity on Ships/Fleet To Increase Performance Using Over .MetodePemeliharaan tidak StandarManHuman ErrorPenjadwalan penggantiankomponen belum efektifMaintenance kurang berjalan baikKurang nya PengetahuanOperatorPerbaikan hanya dilakukanCuaca Perairanbila mesin rusakyang fluktuatifMesin sudah tuaStock sparpart kosong/delivery part lamaMetodePemeliharaan tidak StandarKurang responsifHuman ErrorPenjadwalan penggantiankomponen belum efektifMaintenance kurang berjalan baikIdling MinorStoppageStock sparpart kosong/delivery part lamaSulit Di perbaikiAir sungaipasang surutKualitas merial/Spartpart jelekmudah retak, rusak, aus/patah)ManKurang nya PengetahuanOperatorPerbaikan hanya dilakukanCuaca Perairanbila mesin rusakyang fluktuatifMesin sudah tuaKurang responsifBreakdown LossesSulit Di perbaikiAir sungaipasang surutKualitas merial/Spartpart jelekmudah retak, rusak, aus/patah)Figure 2 & 3. Fishbone Diagram for Ship / fleet Losses Breakdown AnalysisSource: Qualitative Data, 2018o.Recommended Improvements for Reduced Speed Losses & BreakdownRecommendations for improvement are given to increase the OEE value of the ship, after analyzing the causesof the problem using a fish bone diagram, then the next step is to propose improvements for the causes ofproblems with the 5W and 1H methods based on the analysis of downtime losses and so on as shown in thetable. 13 as follows.Table 11. 5W 1HWhatMachineDifficult to fixWhyWhoWhereSudden interference Supervisoroften occurs, due to & Teknisiunstable temperatures.The age of the engine is oldMaintenance process Crew kapal Production /is not standard, in the & StaffShipmaintenance of ship Maintenance functionengines, the crew onlycarries outmaintenance whenMaintenance is not going welldamage has arisen.p.Reduced efficiencySupervisor& TeknisiHowShipJanuary Provide sparpart andfunctionand so establish good(Workshop) on.relations with sparpart2018 suppliers that aredifficult to findEngine or boatreplacementMethodMaintenance is not standardMaterialPoor Material / Sparpartquality (easily cracked,damaged)WhenJanuaryand soon.2018Make a standardimplementation ofmaintenance which ifnot done crew willgive sanctionsKoordinasi dalammonitoring keadaankapalProduction / January Modifying parts orShipand so replacing parts withfunctionon.other materials2018OEE Calculation after Improvement (January 2019 to April 2019)OEE calculation is the result of multiplication of the availability rate value,performance rate, and the rate ofproduct quality that has been obtained.OEE M169 value in January 2019 uses the following formula:*Corresponding Author: Ahmad hidayat Sutawijaya2www.aijbm.com32 Page
Analysis of Total Maintenance Productivity on Ships/Fleet To Increase Performance Using Over .OEE (%) Availability (%) Performance Rate (%) Quality Rate (%)OEE M169 Jan 2019 A x P x Q 0.93 x 0.83 x 0.97 x 100% 74.5%.OEE M269 Jan 2019 A x P x Q 100.0 x 0.81 x 1.00 x 100% 80.7%.Table 12. Overall Equipment Effectiveness of Vessels for the period January s.d April .93M2691.001.000.930.97Performance RateM1690.831.250.810.96M2690.810.891.230.89Rate of QualityM1690.971.031.000.96Overall e: Daily and Monthly Reports processed, 2019q.DiscussionBased on the calculation of Overall Equipment Effectiveness and six big losses,and analysis to find thecause of the problem, both with pareto diagrams,fishbone diagram that has been presented in several mainfindings that affect the value of Overall Equipment Effectiveness (Availability and Performance with 100%Quality)and also against the six big losses. In this chapter there is discussion to explain some of the findings anddata processing and try to evaluate the improvements that have been made.r.Obtaining Overall Equipement Effectiveness ValueAchievement of OEE value after improvement has increased, in Table 5 and Table 12. from M169(62%) to M169 (91%), from M269 (41%) to M269 (100%).OEE M169 (91%), M269 (100%)is a value that hasalready passed world-class OEE companies on services. The detailed details of OEE namely the availability andperformance values are as shown in Figure 3 in the form of a comparison between overall equipmenteffectiveness in 2018 (before repairs) and 2019 (after repairs).The OEE value of XYZ companies has an upward trend since OEE measurements were carried out in2018 until the end of April 2019. Even the last two months from March 2019 to April 2019 OEE values haveincreased, OEE value was originally (50.11%) to (91.00%). In detail, OEE parameters.Achievement of OEE value after improvement has increased,seen in previous OEE values Table 5.inthe original M169 ship code (55.5%) and OEE values thereafter Table 12.in the ship code M169 becomes(87.1%).Table 12 in the original M269 ship code was (44.2%) which was (92.8%). OEE M169 (87.1%) andM269 (92.8%) are values that have exceeded world-class OEE companies in services. The detailed details ofOEE namely the availability and performance values are as shown in Figure 4. which is a comparison betweenoverall equipment effectiveness in 2018 (before repairs) and 2019 (after repairs).The OEE value of XYZ companies has an upward trend since OEE measurements were carried out in 2018 untilthe end of April 2019. Even the last two months from March 2019 to April 2019 OEE values have increased, theOEE value was (55.5%) to (87.1%). In detail, OEE parameters can be seen in figure 4.*Corresponding Author: Ahmad hidayat Sutawijaya2www.aijbm.com33 Page
Analysis of Total Maintenance Productivity on Ships/Fleet To Increase Performance Using Over .Figure 4. Comparison graph of OEE 2018 and 2019 valuesSource: Processed report d
Total Productive Maintenance (TPM) aims to maximize the effectiveness of the equipment used in the industry, which is not focused on maintenance but on all aspects of the operation including to increase the motivation of workers in the company (Iftari, 2015). The TPM component generally consists of 3 parts,that is: 1.