Transcription
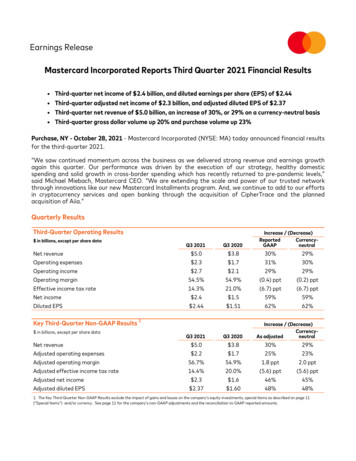
Earnings ReleaseMastercard Incorporated Reports Third Quarter 2021 Financial Results Third-quarter net income of 2.4 billion, and diluted earnings per share (EPS) of 2.44Third-quarter adjusted net income of 2.3 billion, and adjusted diluted EPS of 2.37Third-quarter net revenue of 5.0 billion, an increase of 30%, or 29% on a currency-neutral basisThird-quarter gross dollar volume up 20% and purchase volume up 23%Purchase, NY - October 28, 2021 - Mastercard Incorporated (NYSE: MA) today announced financial resultsfor the third-quarter 2021.“We saw continued momentum across the business as we delivered strong revenue and earnings growthagain this quarter. Our performance was driven by the execution of our strategy, healthy domesticspending and solid growth in cross-border spending which has recently returned to pre-pandemic levels,”said Michael Miebach, Mastercard CEO. “We are extending the scale and power of our trusted networkthrough innovations like our new Mastercard Installments program. And, we continue to add to our effortsin cryptocurrency services and open banking through the acquisition of CipherTrace and the plannedacquisition of Aiia.”Quarterly ResultsThird-Quarter Operating Results in billions, except per share dataIncrease / (Decrease)ReportedCurrencyGAAPneutralQ3 2021Q3 2020Net revenueOperating expensesOperating incomeOperating marginEffective income tax rate 5.0 2.3 2.754.5%14.3% 3.8 1.7 2.154.9%21.0%30%31%29%(0.4) ppt(6.7) ppt29%30%29%(0.2) ppt(6.7) pptNet incomeDiluted EPS 2.4 2.44 1.5 1.5159%62%59%62%Key Third-Quarter Non-GAAP Results in billions, except per share dataNet revenueAdjusted operating expensesAdjusted operating marginAdjusted effective income tax rateAdjusted net incomeAdjusted diluted EPS1Q3 2021Q3 2020 5.0 2.256.7%14.4% 2.3 2.37 3.8 1.754.9%20.0% 1.6 1.60Increase / (Decrease)CurrencyAs adjustedneutral30%25%1.8 ppt(5.6) ppt46%48%29%23%2.0 ppt(5.6) ppt45%48%1. The Key Third-Quarter Non-GAAP Results exclude the impact of gains and losses on the company’s equity investments, special items as described on page 11(“Special Items”) and/or currency. See page 11 for the company’s non-GAAP adjustments and the reconciliation to GAAP reported amounts.
Q3 2021 Key Business Drivers(YoY growth)2Gross dollar volumeCross-border volume(local currency basis)(local currency basis)up 20%up 52%Switched 2transactionsup 25%2. Growth rates normalized to eliminate the effects of differing switching and carryover days between periods.The following additional details are provided to aid in understanding Mastercard’s third-quarter 2021results, versus the year-ago period: Net revenue increased 30%, or 29% on a currency-neutral basis, which includes a 3 percentage pointbenefit from acquisitions. The increase was driven by the impact of the following factors: Gross dollar volume growth of 20%, on a local currency basis, to 2.0 trillion. Cross-border volume growth of 52% on a local currency basis. Switched transactions growth of 25%. Other revenues increased 37%. On a currency-neutral basis, other revenues increased 35%, whichincludes 10 percentage points of growth due to acquisitions. The remaining growth was drivenprimarily by the company’s Cyber & Intelligence and Data & Services solutions. These increases to net revenue were partially offset by: Rebates and incentives growth of 35%, or 34% on a currency-neutral basis, reflecting thehigher growth in volume and transactions and new and renewed deals. Total operating expenses increased 31%. Excluding the impact of Special Items, adjusted operatingexpenses increased 25%, or 23% on a currency-neutral basis. This includes an 8 percentage pointincrease from acquisitions. The remaining increase was primarily due to higher personnel costs tosupport our continued investment in our strategic initiatives, increased spending on advertising andmarketing and increased data processing costs. Other income (expense) was favorable 289 million versus the year-ago period, primarily due to netgains in the current period versus net losses in the prior period related to unrealized fair market valueadjustments on marketable and non-marketable equity securities. Adjusted other income (expense)was favorable 7 million versus the year-ago period. The effective tax rate for the third quarter of 2021 was 14.3%, versus 21.0% for the comparable periodin 2020. The adjusted effective tax rate for the third quarter of 2021 was 14.4%, versus 20.0% for thecomparable period in 2020, primarily due to the recognition of U.S. tax benefits in the current period,the majority of which were discrete, resulting from a higher foreign derived intangible income deductionand greater utilization of foreign tax credits in the U.S. As of September 30, 2021, the company’s customers had issued 2.9 billion Mastercard and Maestrobranded cards.Return of Capital to ShareholdersDuring the third quarter of 2021, Mastercard repurchased approximately 4.3 million shares at a cost of 1.6 billion and paid 434 million in dividends. Quarter-to-date through October 25, the companyrepurchased approximately 1.0 million shares at a cost of 361 million, which leaves 4.8 billion remainingunder the current repurchase program authorizations.2
Year-to-Date ResultsYear-to-date Operating Results in billions, except per share dataNet revenueOperating expensesOperating incomeOperating marginEffective income tax rateNet incomeDiluted EPSKey Year-to-date Non-GAAP Results in billions, except per share dataNet revenueAdjusted operating expensesAdjusted operating marginAdjusted effective income tax rateAdjusted net incomeAdjusted diluted EPS20212020 13.7 6.4 7.353.1%15.7% 6.3 6.35 11.2 5.2 6.053.9%17.3% 4.6 4.59120212020 13.7 6.254.4%15.6% 6.0 6.06 11.2 5.154.1%17.1% 4.8 4.78Increase / ) ppt(1.6) ppt36%38%20%22%19%(0.6) ppt(1.6) ppt35%37%Increase / (decrease)CurrencyAs adjustedneutral22%22%0.2 ppt(1.4) ppt25%27%20%19%0.4 ppt(1.5) ppt23%25%1. The Key Year-to-Date Non-GAAP Results exclude the impact of gains and losses on the company’s equity investments, special items as described on page 12 (“Yearto-Date Special Items”) and/or currency. See page 12 for the company’s non-GAAP adjustments and the reconciliation to GAAP reported amounts.Year-to-date 2021 Key Business Drivers(YoY growth)2Gross dollar volumeCross-border volume(local currency basis)(local currency basis)up 20%up 25%Switched2Transactionsup 24%2. Growth rates normalized to eliminate the effects of differing switching and carryover days between periods.The following additional details are provided to aid in understanding Mastercard’s year-to-date 2021results, versus the year-ago period: Net revenue increased 22%, or 20% on a currency-neutral basis, which includes a 2 percentage pointbenefit from acquisitions. The increase was driven by the impact of the following factors: Gross dollar volume growth of 20%, on a local currency basis, to 5.6 trillion. Cross-border volume growth of 25% on a local currency basis. Switched transactions growth of 24%. Other revenues increased 33%. On a currency-neutral basis, other revenues increased 32%, whichincludes 7 percentage points of growth due to acquisitions. The remaining growth was drivenprimarily by the company’s Cyber & Intelligence and Data & Services solutions. These increases to net revenue were partially offset by: Rebates and incentives growth of 30%, or 28% on a currency-neutral basis, primarily due toincreased volumes and transactions and new and renewed deals.3
Total operating expenses increased 24%. Excluding the impact of Special Items, adjusted operatingexpenses increased 22%, or 19% on a currency-neutral basis. This includes a 6 percentage pointincrease from acquisitions. The remaining increase was primarily due to higher personnel costs tosupport our continued investment in our strategic initiatives, increased spending on advertising andmarketing and increased data processing costs.Other income (expense) was favorable 660 million versus the year-ago period, primarily due to netgains in the current period versus net losses in the prior period related to unrealized fair market valueadjustments on marketable and non-marketable equity securities. Adjusted other income (expense)was unfavorable 58 million versus the year-ago period, primarily due to increased interest expenserelated to debt issuances and a decrease in investment income.The effective tax rate for the first nine months of 2021 was 15.7%, versus 17.3% for the comparableperiod in 2020. The adjusted effective tax rate for the first nine months of 2021 was 15.6%, versus17.1% for the comparable period in 2020, primarily due to the recognition of U.S. tax benefits in thethird quarter of 2021, the majority of which were discrete, resulting from a higher foreign derivedintangible income deduction and greater utilization of foreign tax credits in the U.S., partially offset bya lower discrete tax benefit related to share-based payments and a change in the company’sgeographic mix of earnings.Third Quarter 2021 Financial Results Conference Call DetailsAt 9:00 a.m. ET today, the company will host a conference call to discuss its third quarter 2021 results. Thedial-in information for this call is 833-714-0894 (within the U.S.) and 778-560-2664 (outside the U.S.). Areplay of the call will be available for 30 days and can be accessed by dialing 800-585-8367 (within theU.S.) and 416-621-4642 (outside the U.S.), using passcode 9160547.A live audio webcast of this call, along with presentation slides, can also be accessed through the InvestorRelations section of the company’s website at investor.mastercard.com.Forward-Looking StatementsThis press release contains forward-looking statements pursuant to the safe harbor provisions of thePrivate Securities Litigation Reform Act of 1995. All statements other than statements of historical factsmay be forward-looking statements. When used in this press release, the words “believe”, “expect”, “could”,“may”, “would”, “will”, “trend” and similar words are intended to identify forward-looking statements.Examples of forward-looking statements include, but are not limited to, statements that relate toMastercard’s future prospects, developments and business strategies. We caution you to not place unduereliance on these forward-looking statements, as they speak only as of the date they are made. Except forthe company’s ongoing obligations under the U.S. federal securities laws, the company does not intend toupdate or otherwise revise the forward-looking information to reflect actual results of operations, changesin financial condition, changes in estimates, expectations or assumptions, changes in general economic orindustry conditions or other circumstances arising and/or existing since the preparation of this press releaseor to reflect the occurrence of any unanticipated events.Many factors and uncertainties relating to our operations and business environment, all of which aredifficult to predict and many of which are outside of our control, influence whether any forward-lookingstatements can or will be achieved. Any one of those factors could cause our actual results to differmaterially from those expressed or implied in writing in any forward-looking statements made byMastercard or on its behalf, including, but not limited to, the following factors: regulation directly related to the payments industry (including regulatory, legislative and litigationactivity with respect to interchange rates and surcharging)4
the impact of preferential or protective government actions regulation of privacy, data, security and the digital economy regulation that directly or indirectly applies to us based on our participation in the global paymentsindustry (including anti-money laundering, counter financing of terrorism, economic sanctions and anticorruption; account-based payment systems and issuer practice regulation) the impact of changes in tax laws, as well as regulations and interpretations of such laws or challengesto our tax positions potential or incurred liability and limitations on business related to any litigation or litigation settlements the impact of the global coronavirus (COVID-19) pandemic and measures taken in response the impact of competition in the global payments industry (including disintermediation and pricingpressure) the challenges relating to rapid technological developments and changes the challenges relating to operating a real-time account-based payment system and to working withnew customers and end users the impact of information security incidents, account data breaches or service disruptions issues related to our relationships with our stakeholders (including loss of substantial business fromsignificant customers, competitor relationships with our customers, banking industry consolidation,merchants’ continued focus on acceptance costs and unique risks from our work with governments) exposure to loss or illiquidity due to our role as guarantor and other contractual obligations the impact of global economic, political, financial and societal events and conditions, including adversecurrency fluctuations and foreign exchange controls reputational impact, including impact related to brand perception and lack of visibility of our brands inproducts and services the inability to attract, hire and retain a highly qualified and diverse workforce, or maintain ourcorporate culture issues related to acquisition integration, strategic investments and entry into new businesses issues related to our Class A common stock and corporate governance structureFor additional information on these and other factors that could cause the company’s actual results todiffer materially from expected results, please see the company’s filings with the Securities and ExchangeCommission, including the company’s Annual Report on Form 10-K for the year ended December 31, 2020and any subsequent reports on Forms 10-Q and 8-K.About Mastercard IncorporatedMastercard (NYSE: MA), www.mastercard.com, is a technology company in the global payments industry.Our global payments processing network connects consumers, financial institutions, merchants,governments and businesses in more than 210 countries and territories. Mastercard products and solutionsmake everyday commerce activities - such as shopping, traveling, running a business and managing finances- easier, more secure and more efficient for everyone. Follow us on Twitter @MastercardNews, join thediscussion on the Beyond the Transaction Blog and subscribe for the latest news on the EngagementBureau.5
Contacts:Investor Relations:Warren Kneeshaw or Jud 65Media Relations:Seth EisenSeth.Eisen@mastercard.com914-249-31536
Consolidated Statement of Operations (Unaudited)Three Months Ended September 30,Nine Months Ended September 30,2021202020212020(in millions, except per share data)Net RevenueOperating Expenses:General and administrativeAdvertising and marketingDepreciation and amortizationProvision for litigationTotal operating expensesOperating incomeOther Income (Expense):Investment incomeGains (losses) on equity investments, netInterest expenseOther income (expense), netTotal other income (expense)Income before income taxesIncome tax expenseNet Income Basic Earnings per ShareBasic weighted-average shares outstandingDiluted Earnings per ShareDiluted weighted-average shares outstanding 4,985 3,837 13,668 197(110)7992,8164022,414 3(91)(105)3(190)1,9154021,513 9534(323)92297,4841,1766,308 27(190)(275)7(431)5,5929664,6262.459862.44990 1.511,0011.511,005 6.379906.35994 4.611,0034.591,0087
Consolidated Balance Sheet (Unaudited)September 30,2021December 31,2020(in millions, except per share data)AssetsCurrent assets:Cash and cash equivalentsRestricted cash for litigation settlementInvestmentsAccounts receivableSettlement due from customersRestricted security deposits held for customersPrepaid expenses and other current assetsTotal current assetsProperty, equipment and right-of-use assets, net of accumulated depreciation andamortization of 1,570 and 1,390, respectivelyDeferred income taxesGoodwillOther intangible assets, net of accumulated amortization of 1,676 and 1,489,respectivelyOther assetsTotal AssetsLiabilities, Redeemable Non-controlling Interests and EquityCurrent liabilities:Accounts payableSettlement due to customersRestricted security deposits held for customersAccrued litigationAccrued expensesCurrent portion of long-term debtOther current liabilitiesTotal current liabilitiesLong-term debtDeferred income taxesOther liabilitiesTotal Liabilities 6,4065865102,8208611,8322,36715,382 961,8328385,9646501,22411,56113,2113743,46228,608 ,067Commitments and ContingenciesRedeemable Non-controlling Interests2929——Stockholders’ EquityClass A common stock, 0.0001 par value; authorized 3,000 shares, 1,397 and 1,396 sharesissued and 976 and 987 shares outstanding, respectivelyClass B common stock, 0.0001 par value; authorized 1,200 shares, 8 shares issued andoutstandingAdditional paid-in-capitalClass A treasury stock, at cost, 422 and 409 shares, respectivelyRetained earningsAccumulated other comprehensive income (loss)Mastercard Incorporated Stockholders' EquityNon-controlling interestsTotal EquityTotal Liabilities, Redeemable Non-controlling Interests and Equity —5,026(41,282)43,750(791)6,703706,77335,410 —4,982(36,658)38,747(680)6,391976,48833,5848
Consolidated Statement of Cash Flows (Unaudited)Nine Months Ended September 30,20212020(in millions)Operating ActivitiesNet incomeAdjustments to reconcile net income to net cash provided by operating activities:Amortization of customer and merchant incentivesDepreciation and amortization(Gains) losses on equity investments, netShare-based compensationDeferred income taxesOtherChanges in operating assets and liabilities:Accounts receivableSettlement due from customersPrepaid expensesAccrued litigation and legal settlementsRestricted security deposits held for customersAccounts payableSettlement due to customersAccrued expensesNet change in other assets and liabilitiesNet cash provided by operating activitiesInvesting ActivitiesPurchases of investment securities available-for-salePurchases of investments held-to-maturityProceeds from sales of investment securities available-for-saleProceeds from maturities of investment securities available-for-saleProceeds from maturities of investments held-to-maturityPurchases of property and equipmentCapitalized softwarePurchases of equity investmentsProceeds from sales of equity investmentsAcquisition of businesses, net of cash acquiredSettlement of interest rate derivative contractsOther investing activitiesNet cash used in investing activitiesFinancing ActivitiesPurchases of treasury stockDividends paidProceeds from debt, netAcquisition of redeemable non-controlling interestsAcquisition of non-controlling interestContingent consideration paidTax withholdings related to share-based paymentsCash proceeds from exercise of stock optionsOther financing activitiesNet cash used in financing activitiesEffect of exchange rate changes on cash, cash equivalents, restricted cash and restricted cash equivalentsNet increase (decrease) in cash, cash equivalents, restricted cash and restricted cash equivalentsCash, cash equivalents, restricted cash and restricted cash equivalents - beginning of periodCash, cash equivalents, restricted cash and restricted cash equivalents - end of period 6,308 995537(534)241(49)34 )(130)55(13)(4,938)(80)(3,578)12,4198,841 8,96912,4049
Non-GAAP Financial InformationMastercard discloses the following non-GAAP financial measures: adjusted operating expenses, adjustedoperating margin, adjusted other income (expense), adjusted effective income tax rate, adjusted netincome and adjusted diluted earnings per share (as well as related applicable growth rates versus thecomparable period in the prior year). These non-GAAP financial measures exclude the impact of gains andlosses on the company’s equity investments which primarily includes mark-to-market fair valueadjustments, impairments and gains and losses upon disposition, as well as the related tax impacts. Thesenon-GAAP financial measures also exclude the impact of special items, where applicable, which representlitigation judgments and settlements and certain one-time items, as well as the related tax impacts. Thecompany excludes these items because management evaluates the underlying operations and performanceof the company separately from these recurring and nonrecurring items.In addition, the company presents growth rates adjusted for the impact of currency, which is a non-GAAPfinancial measure. Currency-neutral growth rates are calculated by remeasuring the prior period’s resultsusing the current period’s exchange rates for both the translational and transactional impacts on operatingresults as well as removing the related impact of the company’s foreign exchange derivative contractsdesignated as cash flow hedging instruments. The impact of currency translation represents the effect oftranslating operating results where the functional currency is different from the company’s U.S. dollarreporting currency. The impact of the transactional currency represents the effect of converting revenueand expenses occurring in a currency other than the functional currency. The impact of the related realizedgains and losses resulting from the company’s foreign exchange derivative contracts designated as cashflow hedging instruments is recognized in the respective financial statement line item on the statement ofoperations when the underlying forecasted transactions impact earnings. The company believes thepresentation of currency-neutral growth rates provides relevant information to facilitate an understandingof its operating results.The company believes that the non-GAAP financial measures presented facilitate an understanding ofoperating performance and provide a meaningful comparison of its results between periods. Thecompany’s management uses non-GAAP financial measures to, among other things, evaluate its ongoingoperations in relation to historical results, for internal planning and forecasting purposes and in thecalculation of performance-based compensation.The company includes reconciliations of the requisite non-GAAP financial measures to the most directlycomparable GAAP financial measures. The presentation of non-GAAP financial measures should not beconsidered in isolation or as a substitute for the company’s related financial results prepared in accordancewith GAAP.10
Non-GAAP Reconciliations (QTD)OperatingexpensesThree Months Ended September 30, 2021EffectiveOperatingOther Incomeincome taxmargin(Expense)rateNet incomeDiluted earningsper share( in millions, except per share data)Reported - GAAP (Gains) losses on equity investmentsLitigation provisionsIndirect tax matter123Non-GAAP 2,26854.5 % 9914.3 % 2,414 2.44****(197)(0.2) %(163)(0.16)(27)0.6 %**0.1 %220.02(82)1.6 %60.2 %690.072,158Operatingexpenses56.7 % (92)14.4 % 2,341Three Months Ended September 30, 2020EffectiveOperatingOther Incomeincome taxmargin(Expense)rateNet income 2.37Diluted earningsper share( in millions, except per share data)Reported - GAAP (Gains) losses on equity investments1Non-GAAP1,73254.9 % ** 1,732**54.9 % (190)91(99)21.0 % (1.0) %20.0 % 1,513 921,6051.510.09 1.60Three Months Ended September 30, 2021 as compared to the Three Months Ended September 30,2020Net revenueReported - GAAP(Gains) losses on equity investmentsLitigation provisionsIndirect tax matter123Non-GAAPCurrency impact4Non-GAAP - currency-neutralNote:Tables may not sum due to rounding.**Not ome taxmarginrateOperatingexpensesNet incomeDiluted earningsper share30 %31 %(0.4) ppt(6.7) ppt59 %62 %******0.8 ppt(20) %(19) %**(2) %0.6 ppt0.1 ppt1%1%**(5) %1.6 ppt0.2 ppt5%5%30 %25 %1.8 ppt(5.6) ppt46 %48 %(1) %(1) %0.1 ppt— ppt(1) %(1) %29 %23 %2.0 ppt(5.6) ppt45 %48 %Gains and Losses on Equity Investments1. Q3’21 and Q3’20, pre-tax net gains of 197 million and net losses 91 million, respectively, were primarily related to unrealizedfair market value adjustments on marketable and non-marketable equity securities.Special Items2. Q3’21 pre-tax charges of 27 million were related to litigation settlements and estimated attorneys’ fees with U.K. merchants.3. Q3’21 pre-tax charge of 88 million, related to the anticipated resolution of a foreign indirect tax matter for 2015 through thecurrent period and the related interest.Other Notes4. Represents the translational and transactional impact of currency and the related impact of the company’s foreign exchangederivative contracts designated as cash flow hedging instruments.11
Non-GAAP Reconciliations (YTD)OperatingexpensesOperatingmarginNine Months Ended September 30, 2021EffectiveOther Incomeincome tax(Expense)rateNet incomeDiluted earningsper share( in millions, except per share data)Reported - GAAP (Gains) losses on equity investmentsLitigation provisionsIndirect tax matter123Non-GAAP 6,41353.1 % 22915.7 % 6,308 6.35****(534)(0.3) %(432)(0.43)(94)0.7 %**0.1 %740.07(82)0.6 %60.1 %690.076,23754.4 % Operatingexpenses(299)15.6 % 6,018Nine Months Ended September 30, 2020EffectiveOperatingOther Incomeincome taxmargin(Expense)rateNet income 6.06Diluted earningsper share( in millions, except per share data)Reported - GAAP (Gains) losses on equity investmentsLitigation provisions14Non-GAAP 5,15853.9 % ****(28)0.3 %5,12954.1 % (431)190**(241)17.3 % 4,626 4.59(0.2) %1710.17—%220.0217.1 % 4,819 4.78Nine Months Ended September 30, 2021 as compared to the Nine Months Ended September 30,2020Net revenueReported - GAAP(Gains) losses on equity investmentsLitigation provisionsIndirect tax matter12,43Non-GAAPCurrency impact5Non-GAAP - eOperatingincome taxmarginrateOperatingexpensesNet incomeDiluted earningsper share22 %24 %(0.8) ppt(1.6) ppt36 %38 %******— ppt(14) %(14) %**(1) %0.4 ppt0.1 ppt1%1%**(2) %0.6 ppt0.1 ppt1%2%22 %22 %0.2 ppt(1.4) ppt25 %27 %(2) %(2) %0.1 ppt— ppt(2) %(2) %20 %19 %0.4 ppt(1.5) ppt23 %25 %Tables may not sum due to rounding.Not applicableGains and Losses on Equity Investments1. Year-to-date 2021 and 2020, pre-tax net gains of 534 million and pre-tax net losses of 190 million, respectively, wereprimarily related to unrealized fair market value adjustments on marketable and non-marketable equity securities.Special Items2. Year-to-date 2021 pre-tax charges of 94 million were related to litigation settlements and estimated attorneys’ fees with U.K.merchants.3. Year-to-date 2021 pre-tax charge of 88 million related to the anticipated resolution of a foreign indirect tax matter for 2015through the current period and the related interest.4. Year-to-date 2020 pre-tax charges of 28 million were related to estimated attorneys’ fees and litigation settlements with U.K.and Pan-European merchants.Other Notes5. Represents the translational and transactional impact of currency and the related impact of the company’s foreign exchangederivative contracts designated as cash flow hedging instruments.12
Mastercard Incorporated Operating PerformanceFor the 3 Months Ended September 30, Mil.)Cards(Mil.)All Mastercard Credit, Charge and Debit ProgramsAPMEA 53611.4 %37510.9 %7,8556.5 %1,591893Canada5623.6 %16.8 %5416.7 %82814.7 %119.6 %565Europe66227.5 %27.0 %47432.9 %15,22430.0 %18714.1 %1,123713Latin America12238.7 %33.7 %8541.6 %3,85840.0 %3718.6 %3012811,37621.4 %19.7 %98923.4 %27,76526.3 %38711.2 %3,0201,95261820.3 %20.3 %55422.9 %9,02415.2 %641.9 %3195511,99321.1 %19.9 %1,54323.2 %36,79023.4 %4509.8 %3,3392,503Worldwide lessUnited StatesUnited StatesWorldwide9.6 % 15.7 % 161Mastercard Credit and Charge ProgramsWorldwide lessUnited States62219.0 %16.4 %58416.6 %12,19421.4 %3812.4 %162750United States29236.1 %36.1 %28434.5 %3,13529.3 %8126.3 %8264Worldwide91424.0 %22.0 %86821.9 %15,32922.9 %4623.2 %1701,014Mastercard Debit ProgramsWorldwide lessUnited States75323.4 %22.6 %40534.5 %15,57130.5 %34911.1 %2,8581,202United States3269.0 %9.0 %27112.6 %5,8898.8 %56(5.6)%3112871,07918.7 %18.1 %67524.8 %21,46123.7 %4048.5 %3,1691,489WorldwideFor the 9 Months Ended September 30, Mil.)Cards(Mil.)All Mastercard Credit, Charge and Debit ProgramsAPMEA 1,57916.5 %11.9 % 1,09813.1 %22,602Canada15423.6 %14.4 %14916.2 %2,22714.3 %1,75627.0 %23.8 %1,24328.7 %40,00733725.7 %26.2 %23134.0 %10,445Worldwide lessUnited States3,82622.2 %18.4 %2,72121.6 %United States1,78022.4 %22.4 %1,58324.2 %Worldwide5,60722.2 %19.6 %4,303EuropeLatin America19.1 % 4819.0 %4,7328935(24.3)%136529.1 %51413.4 %3,07571330.4 %10712.2 %85028175,28125.6 %1,10611.1 %8,6711,95225,71016.2 %1989.8 %96455122.6 %100,99223.1 %1,30310.9 %9,6352,503Mastercard Credit and Charge ProgramsWorldwide lessUnited StatesUnited StatesWorldwide1,73616.8 %12.4 %1,62713.2 %33,57519.2 %1092.7 %46075079226.9 %26.9 %77127.3 %8,
A live audio webcast of this call, along with presentation slides, can also be accessed through the Investor Relations section of the company's website at investor.mastercard.com. Forward-Looking Statements This press release contains forward-looking statements pursuant to the safe harbor provisions of the
