Transcription
Front coverIBM CICS Performance Series:CICS TS V5.3 Benchmarkon IBM z13John BurgessIan MitchellCatherine MoxeyRedpaper
IntroductionThis IBM Redpaper publication documents the performance characteristic benchmarks oftwo high-transaction rate IBM CICS Transaction Server for IBM z/OS workloads: The first workload executes on a single IBM z13 logical partition (LPAR) with 18 centralprocessors (CPs) up to a rate of 174,000 CICS transactions per second. The second workload executes on a single z13 LPAR with 26 CPs up to a rate of 227,000CICS transactions per second (TPS).The motivation for the benchmark is to demonstrate some of the benefits of CICS TransactionServer (CICS TS) V5.3, compared with previous releases in terms of: Improved performance Enhanced interaction with IBM z/OS Workload Manager (WLM) for transaction CPUtracking and IBM Mobile Workload Pricing (MWP) The ability to demonstrate the stability and scalability of CICS handling high-transactionrates in excess of those tested previouslyIn particular, CICS TS V5.3 has optimized transaction dispatching for HTTP requests. In thisrelease, CICS is able to directly dispatch an application transaction for each request that itreceives, without first needing to run a CWXN (web attach) transaction.Note: The CWXN transaction is still used if your application uses an analyzer program orcannot take advantage of Application Transparent Transport Layer Security (AT-TLS) for itsSecure Sockets Layer (SSL) needs.Eliminating CWXN reduces CPU usage and in addition, reduces the amount of direct-accessstorage device (DASD) space used to store standard System Management Facility (SMF)records when CICS Performance monitoring is active.Together with z/OS V2.1 and later WLM enhancements, transactions running in CICS TSV5.3 can be classified into service and report classes that directly measure and report theirCPU consumption. CICS has been enhanced to continuously measure CPU consumption ofevery transaction, without the need to activate CICS Performance class monitoring. Thesemeasurements are aggregated by z/OS WLM to provide enhanced reporting in SMF recordsand IBM Resource Measurement Facility (RMF ) reports. The CPU measurements forworkloads classified in this way make it simpler and more efficient to collect the data requiredfor Mobile Workload Pricing. Copyright IBM Corp. 2016. All rights reserved.ibm.com/redbooks1
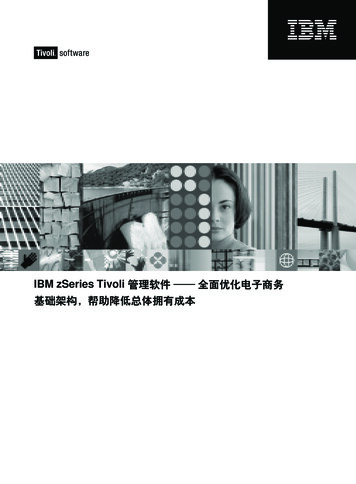
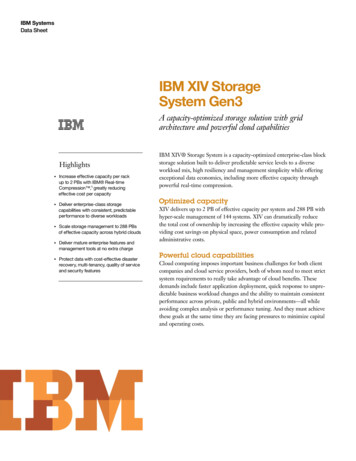
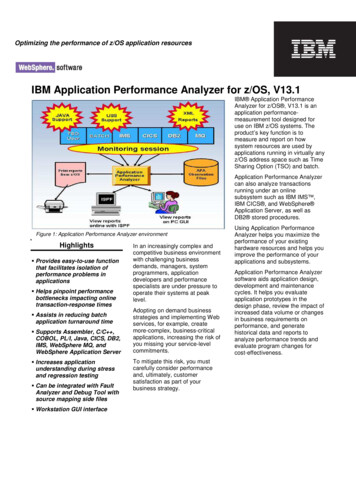
These enhancements and optimizations make it possible to drive CICS TS to even highertransaction rates than were previously possible, allowing applications that need to run at highvolumes of requests and with increasing workloads to be hosted in CICS with confidence.The primary audience for this paper includes technical specialists who need to makearchitectural, capacity, and performance-related decisions regarding new or existingapplication workloads on the IBM z Systems platform. While this benchmark is deeplytechnical in nature, the results have been laid out in a straightforward manner that should alsoappeal to technical executives who are making platform choices, especially those whereextremely high levels of throughput and linear scalability are important consideration factors.The CICS TS applicationFor our testing, the CICS workload consisted of an application providing two distinct servicesaccessing common data. One service is accessed via terminals using the LU2 protocol, andthe other using TCP/IP clients with a CICS HTTP WEB interface. The majority of transactionsissued an EXEC CICS STARTBROWSE command to locate a starting position in a recoverableCICS maintained shared data table and then issued five EXEC CICS READNEXT commands. TheCICS Maintained Data Table (CMT) was backed by a Virtual Storage Access Method (VSAM)data set. Approximately 10% of the LU2 client transactions issued an EXEC CICS READ UPDATE,followed by an EXEC CICS REWRITE, updating the VSAM file record. A smaller proportion of theTCP/IP clients issued updates. All updates needed to be function shipped to the file-owningregion (FOR) by the use of a multiregion operation (MRO) connection where data integrityand recoverability were maintained.As shown in Figure 1 on page 3, the LU2 transactions were sent using IBM EnterpriseExtender into a set of six terminal-owning regions (TORs). All of these transactions were thenrouted to a set of 10 application-owning regions (AORs) using IBM CICSPlex SM SysplexOptimized routing over MRO XM.2IBM CICS Performance Series: CICS TS V5.3 Benchmark on IBM z13
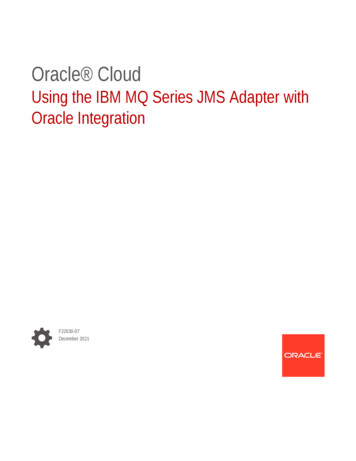
Figure 1 CICS configuration for benchmark testing of CICS TS V5.2 and CICS TS V5.3You can also see in Figure 1 that the TCP/IP clients entered the system directly into the AORsvia TCP/IP port-sharing, maintaining persistent connections.IBM Workload Simulator for z/OS (WSim) was used on two other LPARs to simulate theclients.Retail catalog shopping scenarioThe CICS workload used for this benchmark might represent the back-end processing for anumber of applications. We describe in this paper how it might correspond to a retailapplication scenario, involving shopping from an online catalog.A retailer provides kiosks in-store for customers to browse for items they want to reserve. Alsoprovided is a mobile application on which customers can find and purchase items. Eachrequest results in a browse through, on average, five items of a particular category of goods(such as training shoes or T-shirts) before a customer moves on to look at a different categoryof items, initiating another request. Customers typically browse through many items beforedeciding upon a purchase.During a sales promotion, the retailer needs to be able to handle a very high volume ofrequests being made at the same time, and throughout the day. The retailer wants to be ableto account for CPU usage by the requests that come from the mobile application, but withoutthe requirement to run with CICS performance-class monitoring enabled.3
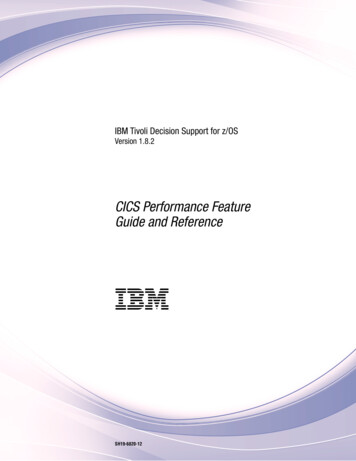
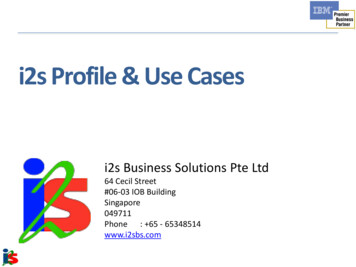
Figure 2 depicts this retail catalog shopping scenario.Figure 2 Retail shopping scenarioThe retail catalog is held in a recoverable CICS maintained shared data table, backed by aVirtual Storage Access Method (VSAM) key sequenced data set (KSDS) file. Browsing thecatalog results in direct access to the shared data table, whereas purchase requests map toupdates that are also applied to the backing VSAM data set.Requests made at the kiosks are processed by LU2 transactions, which are sent using theEnterprise Extender protocol into six terminal-owning regions, and then routed across 10application-owning regions using CICSPlex SM Sysplex optimized routing.Requests made from the mobile application are processed by using HTTP web requestsdirectly into the application-owning regions using TCP/IP shared ports.4IBM CICS Performance Series: CICS TS V5.3 Benchmark on IBM z13
Hardware and software configurationThe following section provides the hardware and software configurations that are necessaryfor the retail catalog shopping scenario.HardwareThe following hardware was used for this benchmark: IBM z13 (type 2964) model NE1LPAR with 18 dedicated processors (CPs) for the system under testAn alternate configuration with 26 dedicated CPs was also used for some measurementsInternal coupling facility with interval control program (ICP) linksDS8870 (2424-961) DASDSoftwareThe following software was used for this benchmark: CICS Transaction Server V5.3 and CICS Transaction Server V5.2 z/OS V2R1 plus WLM and RMF Authorized Program Analysis Reports (APARs) OA47042,PI47638, and OA48466 WSim RMF Monitor I and IIIPerformance monitoring toolsFor our benchmark sampling period, we used the tools described in this section.RMF Monitor IRMF Monitor I was used to record system resource usage, including CPU, direct accessstorage device (DASD), and storage, and was also used with the z/OS WLM configuration torecord the CPU, transaction rates, and response times for CICS service classes and reportclasses. SMF records 70-79 are written on an interval basis and can be post-processed byusing the RMF postprocessor (program ERBRMFPP).A new function in CICS TS V5.3 passes the CPU times used by transactions to z/OS WLM.This enables CPU time collection for groups of transactions based on WLM classifications.Also introduced are two new CICS classifications based on TCP/IP service name andtransaction class. Within a classification, a value of MOBILE can be specified for a reportingattribute, which enables WLM to accumulate all of the CPU time for this classification andreport it directly as Mobile CPU time for consideration for discounted mobile pricing. Thesevalues are also displayed in RMF postprocessor reports.z/OS WLM APAR OA47042 and RMF APAR OA48466 are needed to use this new function,and also, if z/OSMF is used, APAR PI47638.5
RMF Monitor IIIRMF Monitor III was used to record the coupling facility activity for the Logger and theCoupling Facility Data table used by CICSPlex SM Sysplex Optimized Routing. RMF MonitorIII can also be used on an interactive basis and the data can also be written to VSAM datasets for later review via the interactive RMF TSO application.CICS TS statisticsCICS statistics were used to monitor and report CICS resource usage, including CPU,storage, file accesses, number of request transactions routed, number of requests functionshipped, and so on.CICS interval statistics have most of the counters reset at the start of each interval so that anyresource consumption reported only relates to the measurement period being observed.Interval statistics can be activated using CEMT SET STATISTICS. When you set this, the firstinterval can be adjusted to a shorter time so that all the intervals are synchronized to theend-of-day time (STATEOD) parameter. For example, in Example 1, if you were to use CEMT toset and an interval of 15 minutes at 10 minutes past the hour, the first interval would expire in5 minutes so that all future intervals line up on 15-minute wall clock boundaries. The values inthis first report can also be associated with a much longer period, depending on the time ofthe last reset.Another alternative to using interval statistics would be to use CEMT to reset the countersand then at the end of the measurement period, use CEMT to record all the statistics.Resetting the statistics requires a change of state from ON to OFF or from OFF to ON. Toensure this happens, the commands in Example 1 serve as an example of resetting thestatistics in one of the AORs in this configuration.Example 1 Collecting CICS statisticsF CICSA001,CEMT SET STAT OFF RESETF CICSA001,CEMT SET STAT ON RESETMeasurement period is between the RESET and the RECORDF CICSA001,CEMT PERFORM STAT ALL RECORDRegardless of whether the statistics are ON or OFF, when PERFORM RECORD is issued, astatistics record is written.CICS statistics are written as SMF 110 subtype 2 records and can be post-processed byusing the CICS statistics utility program, DFHSTUP, or by using CICS Performance Analyzer(CICS PA).6IBM CICS Performance Series: CICS TS V5.3 Benchmark on IBM z13
Benchmark methodologyThis section describes the approach used in running and measuring the benchmark.Workload Simulator, running on two separate LPARs, was used to simulate the clients thatdrive the workload. For the 18 CP measurements, we had 14700 LU2 3270 simulated clientsand 6000 web clients. For the 26 CP measurements, we increased the web clients to 9000.The LU2 traffic flowed over Enterprise Extender, which allows SNA data to flow over TCP/IP.The HTTP traffic flowed over IBM HiperSockets .Simulated client think times were selected to produce a specific overall throughput rate in theCICS address spaces. The system was allowed to settle into a steady state, and thenperformance measurement data was collected for a 5-minute interval. RMF I, RMF III, andCICS statistics were collected for this interval, and then the simulated think time was reducedto create a higher throughput rate. The process was then repeated. Data for five separatemeasurement intervals was collected.Throughput was measured in terms of business transactions per second (BTPS). Forexample, consider a transaction entered a TOR, was routed to the AOR, then functionshipped a file request to the FOR. In terms of CICS transactions, this would involve onetransaction in the TOR, another in the AOR, and a third CSMI (mirror) transaction in the FOR.We counted this as one business transaction, and, in terms of RMF service and report class,this would be counting only the Begin to End (BTE) transactions, not the executedtransactions. That is, in this case, the three individual transactions are counted as onebusiness transaction.We also did not count the separate CWXN transaction in CICS TS V5.2 that is used inprocessing the HTTP requests entering the AORs. We only counted the CWBA equivalenttransaction that carried out the business processing. In CICS TS V5.3, the need to run thisCWXN transaction has, in many circumstances, been eliminated, as was the case in thisbenchmark. Excluding the counting of the CWXN transaction in CICS TS V5.2 gave a directcomparison in terms of business transaction rates with CICS TS V5.3.z/OS Workload Manager classificationsThis section describes the z/OS classifications that were used for this benchmark andexplains how you can use these classifications to collect CPU time for separate types ofworkload, such as work initiated from mobile devices.From a z/OS WLM point of view, using CICS TS V5.3 for this benchmark, we were able toclassify all of the transactions arriving on a specific TCP/IP service installed in the AORs. Inthis workload, all of the AORs had a TCP/IP service that we called HTTP1 enabled. Anytransaction arriving over this TCP/IP service was classified into a service class called CICSJBand reported in a report class called SCALHTTP. All of these transactions arriving on thisTCP/IP service also had their CPU times attributed to Mobile CPU time. This facility hasenabled the collection of CPU times for transaction types to be accumulated without the needto turn on CICS Performance class monitoring. This accumulation includes any CPU times fortransactions in other regions running on behalf of these arriving on this TCP/IP service, suchas a function ship or transaction route.Transactions arriving in the TORs were also classified into service class CICSJB and reportedin a report class called SCAL3270. These were not classified as mobile in this workload.7
Figure 3 and Figure 4 show the CICS subsystem classification definition used for thisworkload. Figure 4 shows the view when using PF11 to page right from the view shown inFigure 3, including the new reporting attribute, MOBILE.Figure 3 CICS WLM classificationFigure 4 WLM CICS classification (PF11)Before CICS TS V5.3, using this new z/OS WLM facility, the CICS subsystem service classCICSJB would not show any CPU time related to CICS. Now this CICS subsystem serviceclass shows the transaction CPU APPL% related to CICS transactions running in it. It alsoseparates out the CPU time associated with those transactions that were classified asMOBILE.The two report classes, SCALHTTP and SCAL3270, will also have the transaction CPU timesrecorded, but only the SCALHTTP will show any Mobile CPU time. CPU times captured in thismethod will be similar in magnitude to the times that would be collected with CICSPerformance class monitoring.8IBM CICS Performance Series: CICS TS V5.3 Benchmark on IBM z13
Figure 5 shows the Job Entry Subsystem (JES) classification rules for the CICS addressspaces.Figure 5 JES subsystem classification rulesWhen CICS initially starts, it is classified either as a JES or STC subsystem type. In our case,the CICS regions were started by submitting job control language (JCL), so they were JESclassified. These CICS regions are managed to the service classes specified in the JESsubsystem classifications until transactions start running in them. In our case, we specifiedthat these CICS regions should be Transaction Managed so while transactions are running,the regions will be managed by the service classes specified in the associated CICSsubsystem classification rules, rather than the JES subsystem.In the JES subsystem classification, we have associated the TOR, AOR, and FOR reportclasses with the same corresponding report classes that we used for the CICS regions in theCICS subsystem classification.This provides the opportunity to report CICS transaction counts and response times, plus theCICS region CPU usage, and now, with CICS TS V5.3, the CPU times used by transactionsare also reported.Note: An important factor when using service and reporting classes for reportingtransactions through RMF is that CICS transactions only get reported in the regions inwhich they were originally initiated, classified, and then ended.For example, in the TOR/AOR/FOR environment suppose that 5000 transactions arrived inthe TOR, these will be classified accordingly and if they are all routed to the AOR they willcarry that classification with them. The same is true for any transaction running on behalf ofthese in the FOR such as the CSMI (mirror) transaction. When looking at an RMF report, theonly transaction count that will appear will be the 5000 in the TOR. This count will contain thenumber of transactions ended, which is the total number of transactions that were initiated inthe region or set of regions represented by this report class or service class.RMF only reports the count of the initial transactions; it is not accumulating the count of anytransaction that was started as a result of a transaction route or function ship. In this example,where all the transactions were routed to an AOR, there would be an ENDED count of 5000and an Executed (EXCTD) count of 5000 in the RMF report for the TOR. Ended transactionsrepresent the BTE counts.EXCTD count is a count of transactions that have been routed to another CICS region.9
Also shown in a CICS report class in an RMF report are the Actual and Execution Responsetimes. The Actual Response time refers to the overall response time of transactions, andExecution Response time refers to the time spent executing in the AORs and FORs.If you look at an RMF report in the TOR/AOR/FOR configuration where all transactionsarrived in the TOR, the only report class with a transaction count would be the TOR becauseall of the transactions running in the AOR and FOR are in the Execution phase running onbehalf of those arriving in the TOR. The report class would show the total address spaceAPPL% CPU time, but it would now also show the actual transaction APPL% CPU time.Note: This new CPU time for transactions follows the same rules as BTE countedtransactions. That is, CPU times recorded for those transactions in execution states in theAORs and FORs will be accumulated back to the TOR where they originated.TOR transaction APPL% can therefore be greater than the TOR address space APPL%. PureAORs and FORs will have little transaction APPL% compared to z/OS region APPL%.Figure 6 shows an example of a report class that has both a JES and a CICS subsystemclassification associated with it.Figure 6 Example of a TOR report classAs shown in Figure 6, we see both transaction rates from the CICS classification and the totaladdress CPU APPL % from the JES classification. Notice that the TRANSACTION APPL% of37.24 is greater than the address space APPL % of 10.16. This is because 67577transactions out of the 74001 were routed to other regions, and the CPU from thoseEXECUTED transactions has been accumulated back to the TORs’ Transaction APPL%.In this example, no Mobile CPU time has been recorded for this report class.10IBM CICS Performance Series: CICS TS V5.3 Benchmark on IBM z13
Figure 7 shows the flow of transactions in this workload through a TOR to an AOR usingtransaction routing, and in some cases, on to an AOR region using function shipping. Thisillustrates the meaning of BTE and EXEcution in z/OS WLM terms.FirstRegion!CICS TORTransactionRouting RequestClassify TransactionInitialize PBCICS AORSwitch ContinueChange PB stateInitialize PBSwitch ContinueChange PB stateDistributed ProgramLink (DPL) and/orFunction ShippingRequest(s)CICS AOR/FORInitialize PBChange PB stateBegin-To-End(BTE)Response timeEXEcutiontimeChange PB stateChange PB stateChange PB stateSwitch ReturnNotify WLMChange PB stateSwitch ReturnReport WLMBTE PhaseNotify WLMEXE PhaseCompletion NoEXE PhaseCompletion YesPB Performance BlockFigure 7 CICS and z/OS transaction tracking11
Figure 8 shows the relationship between the CICS regions and the service classes thattransactions were being managed by, in addition to the report classes associated with them.The TORs were classified with an attribution of BOTH. This means that they are managed tothe performance goal of the JES service class, but will nevertheless classify and track alltransactions in the correct CICS specified service class so that z/OS WLM can still managetransactions to their response time goals.Figure 8 Service classes and report classesTerms used in the resultsThe following list gives a description of the terms used in the following tables of results: ETR: The transaction rate per second based on Begin to End (BTE) transactions only andexcluding any CWXN transaction that we did not consider as one of the businesstransactions. TOR CPU%: The percent of 1 CP that is being used by the CICS regions to which all theLU2 clients were attached. This is as reported by RMF Monitor I under the ---APPL %--heading for that report class. This region might also be known as a routing region. AOR CPU%: The percent of 1 CP that is being used by the CICS regions that all the LU2transactions were routed to and that the TCP/IP clients were connected to. This is asreported by RMF Monitor I under the ---APPL %--- heading for that report class. FOR CPU%: The percent of 1 CP that is being used by the CICS region owning theShared Data table to which all file updates were function shipped to. This is as reported byRMF Monitor I under the ---APPL %--- heading for that report class.12IBM CICS Performance Series: CICS TS V5.3 Benchmark on IBM z13
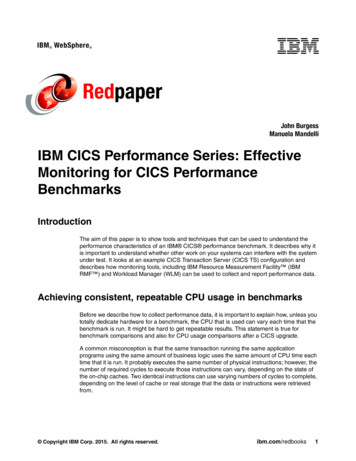
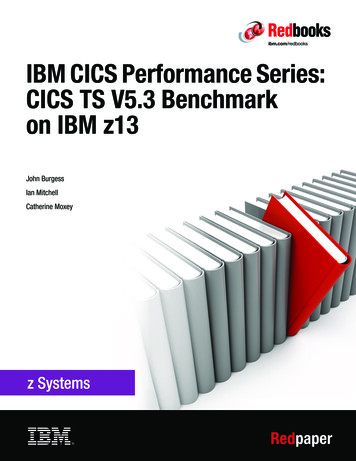
Total CICS CPU%: The percent of 1 CP that is being used by the combination of all theCICS address spaces. This is as reported by RMF Monitor I under the ---APPL %--heading for that Workload report that contains all the service classes. LPAR Busy %: The LPAR busy as taken from the RMF CPU Activity reports. CPs used: Total CPU used by the CICS address spaces to run the workload.ResultsThis section contains the results extracted from the RMF reports.Table 1 shows key performance data extracted from the RMF I reports. It shows a range offive different transaction rates running on the 18 CP LPAR, starting at 38 K TPS, up to amaximum in this configuration of 174 K TPS.Table 1 CICS V5.3 results with 18 CPsETRTOR CPU%AOR CPU%FOR CPU%Total 6065.341499.40Figure 9 shows only the CPU used by the CICS address space. CPU usage grows linearly asthe transaction rate increases, demonstrating good scalability.Figure 9 CICS CPU versus ETR for the 18 CP LPAR13
More detail from the higher ETRThis section highlights more of the performance data from the upper measurement viewpoint.Figure 10 is the RMF Workload Five-Minute Interval report extracted from RMF. It representsthe 17 CICS regions and shows a total of 174624 TPS. Note also that 52545856 transactionsended in total and of those, 6996693 were executed (routed from TORs to AORs). Thedifference between the ended and the executed represent the transactions that arriveddirectly into the AORs via TCP/IP.Figure 10 RMF Workload Five-Minute Interval reportThe new capability for capturing CICS transaction CPU time is shown in Figure 10, where thetotal time is 1493.8% of 1 CP. Out of that, 648.53% of a CP has been identified as MobileCPU usage.14IBM CICS Performance Series: CICS TS V5.3 Benchmark on IBM z13
Figure 11 shows the report class for the transactions arriving on the new TCP/IP service(Connection type) classification, named HTTP1. It shows a transaction rate of 151342 TPS,all of which ran in the regions in which they arrived (EXCTD 0). All of these transactions wereclassified as MOBILE and as shown, used 648.53% of 1 CP (6.48 CPs). This ties in with theended – executed value in Figure 10 on page 14.Figure 11 CICS TCP/IP service report classIn total, there were 151 K HTTP TPS (52545856 – 6996693 / 300) 151 K TPS (shown inFigure 12 on page 17) and 23 K LU2 transactions that were routed from the TORs to theAORs.Data summary at maximum throughputTable 2 shows some of the key data points for the 18 CP measurement at maximumthroughput.Table 2 LPAR data summary for 18 CPsMeasurementValueTotal TPS174,624HTTP TPS151,342LU2 TPS23,251CICSPlex SM routed TPS23,251Shared data table reads per second831,835Reads for update per second8,257Rewrites per second8,257Physical coupling facility log writes per second10,87815
CICS V5.3 comparison with CICS V5.2This section contains a comparison of CICS TS V5.3 with CICS TS V5.2 running the sameworkload and using the same configuration. The main advantage that CICS TS V5.3 displaysin this benchmark from a purely performance point of view is that it can eliminate the need torun the CWXN transaction, although there are other performance benefits in CICS TS V5.3that also contribute to the differences with CICS TS V5.2.One of the performance improvements that we were able to show in this benchmark is themore efficient TCP/IP processing within CICS TS V5.3. HTTP requests that arrive in CICS(and that do not require the use of an analyzer program and are not using CICS SSL) areoptimized in CICS TS V5.3. The transaction that runs the target application or pipeline (the'CWBA' or 'CPIH' transaction) can be attached directly by the socket listener task ('CSOL')without the need to attach the 'CWXN' transaction first. Eliminating CWXN reduces CPUusage and also reduces the DASD space required to store SMF records when CICSPerformance monitoring is active.CICS TS V5.3 has a new interaction with z/OS WLM in which it records transaction CPUusage for later post processing with RMF and, which enables a simpler method for theidentification of the CPU time eligible for mobile workload pricing. Transaction CPU times cannow be recorded without the need to turn on CICS Performance monitoring.Also in CICS TS V5.3, there is an improved algorithm for selecting MRO sessions to be usedfor transaction routing and function shipping.There is no transaction CPU reporting using z/OS WLM in CICS TS V5.2. This is a feature ofCICS TS V5.3.CICS TS V5.2 18 CP results summaryTable 3 shows some of the key data points for the 18 CP measurement when using CICS TSV5.2.Table 3 Table of CICS TS V5.2 results16ETRTOR CPU%AOR CPU%FOR CPU%Total 48.511261.40IBM CICS Performance Series: CICS TS V5.3 Benchmark on IBM z13
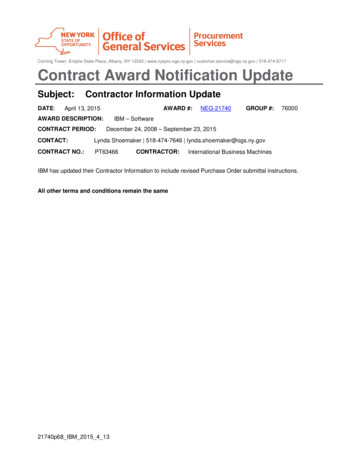
As shown in Figure 12 and in the results in Figure 10 on page 14, CICS TS V5.3 reaches ahigher throughput rate and uses less CPU than CICS TS V5.2.Figure 12 Comparison of TPS and CPU between CICS TS V5.2 and CICS TS V5.3The main reason for the lower throughput rate for CICS TS V5.2, as shown in Figure 12, isbecause the AORs became constrained by the QR TCB in each of the AORs at a lowertransaction rate. A slight increase in response times also caused more concurrenttransactions in the system at any one time, leading to an increase in MXT conditions,compared to CICS TS V5.3. Higher throughput in CICS TS V5.2 can be achieved byincreasing the number of AORs, but that did not form part of this exercise.CICS TS with performance class monitoringCICS TS V5.3 now provides the ability to identify and collect transaction CPU times usingWLM classifications for possible inclusion for mobile pricing discounts. Before CICS TS V5.3,to identify and accumulate CPU times for certain transaction types, performance classmonitoring would need to be turned on. This has a CPU cost associated with it, and additionalDASD would be needed to store the SMF data.This section compares the same CICS TS V5.3 workload running with and withoutperformance class monitoring.17
Figure 13 shows a comparison of ETR and CPU for CICS TS V5.3, with and withoutperformance class monitoring. With performance class monitoring active, the highest ETRachieved is reduced from 174 K to about 135 K TPS. The main reason for this is theincreased use of the QR TCB becoming a constraint at the higher transaction rate.Figure 13 CICS with and without performance class monitoringAlso in Figure 13, the non-linear line shows the increase in CPU per transaction at the higherrate. When CICS regions become constrained, like any software system, it takes more CPUto process the higher numbers of active, concurrent transactions that are competing forresources. Also, the LPAR was already running at 97% before monitoring was turned on, sonot only was the QR constraint causing a drop in throughput, but the LPAR was alsoconstrained by the number of CPs available.There can be other benefits to running CICS with performance class monitoring enabled,because the more detailed data that it provides can be used to understand performancecharacteristics of the system and diagnose any unexpected behavior in your application.While the results in this section do show a reduced throughput with performance classmonitoring active, it also demonstrates that a considerably high transaction rate is stillachievable with CICS performance class monitoring enabled. The results show that evenwhen monitoring is enabled, the transaction rate we achieved is high (135,000 tps).If perf
2 IBM CICS Performance Series: CICS TS V5.3 Benchmark on IBM z13 These enhancements and optimizations make it possible to drive CICS TS to even higher transaction rates than were previously possible, allowing applications that need to run at high volumes of requests and with increasing workloads to be hosted in CICS with confidence.