Transcription
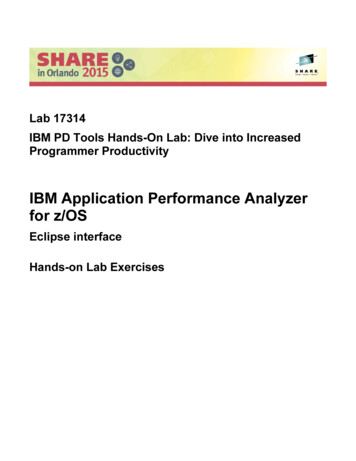
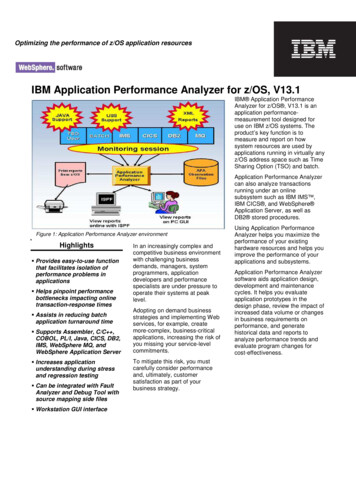
Optimizing the performance of z/OS application resourcesIBM Application Performance Analyzer for z/OS, V13.1IBM Application PerformanceAnalyzer for z/OS , V13.1 is anapplication performancemeasurement tool designed foruse on IBM z/OS systems. Theproduct’s key function is tomeasure and report on howsystem resources are used byapplications running in virtually anyz/OS address space such as TimeSharing Option (TSO) and batch.Application Performance Analyzercan also analyze transactionsrunning under an onlinesubsystem such as IBM IMS ,IBM CICS , and WebSphere Application Server, as well asDB2 stored procedures.Figure 1: Application Performance Analyzer environmentHighlightsProvides easy-to-use functionthat facilitates isolation ofperformance problems inapplicationsHelps pinpoint performancebottlenecks impacting onlinetransaction-response timesAssists in reducing batchapplication turnaround timeSupports Assembler, C/C ,COBOL, PL/I, Java, CICS, DB2,IMS, WebSphere MQ, andWebSphere Application ServerIncreases applicationunderstanding during stressand regression testingCan be integrated with FaultAnalyzer and Debug Tool withsource mapping side filesWorkstation GUI interfaceIn an increasingly complex andcompetitive business environmentwith challenging businessdemands, managers, systemprogrammers, applicationdevelopers and performancespecialists are under pressure tooperate their systems at peaklevel.Adopting on demand businessstrategies and implementing Webservices, for example, createmore-complex, business-criticalapplications, increasing the risk ofyou missing your service-levelcommitments.To mitigate this risk, you mustcarefully consider performanceand, ultimately, customersatisfaction as part of yourbusiness strategy.Using Application PerformanceAnalyzer helps you maximize theperformance of your existinghardware resources and helps youimprove the performance of yourapplications and subsystems.Application Performance Analyzersoftware aids application design,development and maintenancecycles. It helps you evaluateapplication prototypes in thedesign phase, review the impact ofincreased data volume or changesin business requirements onperformance, and generatehistorical data and reports toanalyze performance trends andevaluate program changes forcost-effectiveness.
Application Performance Analyzercollects samples from themonitored address space andanalyzes the system or resourceapplication in the followingcategories: Control section (CSECT) usagewithin each load module Instruction or statement usagewithin each CSECT Assembler, COBOL and PL/Istatement usage within eachmodule or disassembly formodules without source Direct access storage device(DASD) statistics Processor usage IMS transactions and databases DB2 databases, including storedprocedures, Structured QueryLanguage (SQL), DistributedData Facility(DDF) and detailedDB2 delay information CICS transactions and themultiplicity of relationships inthose transactions from aperformance perspective IBM WebSphere MQ queueinformationRobust features to helpyou meet your applicationperformance objectivesApplication Performance Analyzersoftware includes a number ofrobust features designed to helpyou optimize the performance ofyour application resources.Online analysisThis feature provides displays ofoverall system activity, enablingyou to check on all jobs runningonline or to select a specific activejob to monitor.Flexible monitoringThe flexible monitoring capabilitiesof Application PerformanceAnalyzer offer a wide variety ofways to help ensure that theperformance of your applicationsFigure 2: Application Performance Analyzer views and reports2meets your needs: Specify the number of times thatApplication PerformanceAnalyzer should monitor a job’sperformance when that job orprogram becomes active. Enable DB2, IMS, CICS andWebSphere MQ applications tobe monitored. Select how long to monitorselected applications — basedon when the job ends, theduration of sampling or thenumber of samples to be taken. Invoke the monitoring capabilityfrom other programs such asIBM Tivoli OMEGAMON , IBMTivoli Enterprise Portal and IBMApplication PerformanceAnalyzer Automation Assistantusing the ApplicationPerformance Analyzer batchcommand interface. Compare two observation reportsto see the relevant differences, tosupplement threshold monitoring.
Use threshold monitoring toenable an observation request tomonitor an application byspecifying the processor-usage,execute channel program(EXCP) and job-durationthresholds. For jobs that havehad problems, you can use thisfeature to initiate an observationwithout any direct involvement topermit analysis after thesampling is complete.ReportsReports generated by ApplicationPerformance Analyzer help you toidentify key performancebottlenecks that need examinationand resolution. This data isavailable in printed reports thatyou can choose to create as textfiles, Adobe PostScript files, orXML files, to view on yourworkstation.Other monitoring informationAs well as providing performanceinformation about your applicationcode, Application PerformanceAnalyzer also delivers otherimportant information. Forexample, you can use ApplicationPerformance Analyzer to trackperformance issues to a DASDproblem.Processing performance analysisshows processor usage byprocedure, referred attribution,wait time by task, category andmodule, as well as multiple DASDstatistics including EXCP, virtualstorage access method (VSAM)statistics and input-output waittimes.Support for IBM Parallel Sysplex Coupling Facility lets you monitorjobs and transactions on anylogical partition (LPAR) image inthe Parallel Sysplex environmentyou choose and also report howIBM Workload Manager for z/OSaffects application performance.Figure 3: Application Performance Analyzer provides detailed informationabout running CICS transactionsSixty-four bit memory use is nowreported in ApplicationPerformance Analyzer.User InterfaceWith a single interface, you canmonitor applications in test, as wellas in production, and in multiplesource languages, includingAssembler, C/C , COBOL andPL/I. Optimized code support forCOBOL and PL/I is provided toenable you to monitor productionapplications.Support for IBM subsystemsApplication Performance Analyzer,a single tool, provides applicationmonitoring support for all of IBM’smajor subsystems:CICSSupport for IBM CICS TransactionServer, including V5, enables youto monitor specific CICStransactions using wildcardtransaction prefixes or by termedselection. With this support, youcan trace transactions duringcritical situations, rather thanwaiting to review data collectedperiodically.3DB2Support for DB2, including V11,delivers relevant information forperformance analysis and tuning,including SQL statements andprocessor usage by SQLstatement as well as for IBM DB2stored procedures written inJava . You can also choose totrace all DB2 calls.IMSSupport for IMS applications,including V13, means you canhave IMS application-performancedata-on-call time and service-calltime for DL/I. You can also chooseto trace all IMS calls. Over 20 IMSreports are now provided, helpingto improve your ability to analyzethe influences of IMS onapplication performance.WebSphere MQWebSphere MQ support providesinformation about CPU usage byqueue, by request and bytransaction in WebSphere MQ.Application Performance Analyzeralso provides service time byqueue, request and transaction, aswell as wait time, for the samecategories.
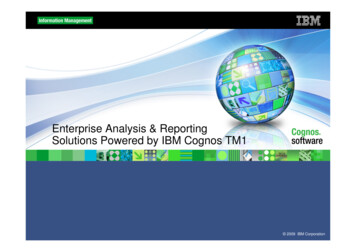
New in V13.1 Enhancements to started tasks,sampling, exits and intercepts- Recognize LanguageEnvironment mode switchfor CPU attribution.- SMS classes for ApplicationPerformance Analyzer createdfiles- Repeat observations of batchjobs- WebSphere measurementsautomatically measure servantregions and report Java andDB2 activity- Preloaded JVMTI agent- CICS recognizes CICS filteringcriteria- IEFU84 SMF exit programsupports DB2 V10 compressedrecords- Support of the DB2 V10 bindoption for DB2 Explain- Clear Application PerformanceAnalyzer exits when started taskends- Dynamic change of selectedCONFIG settings- Export file name configurationsetting- Export and Import a hierarchy ofsample files-Import operation checks forduplicate sample file names- Compatibility support forEnterprise COBOL V5, CICS TSV5.1, DB2 V11, IMS V13, z/OSV2.1, and Adabas V8.2.4 Enhancements to reportingcapability- Observation List displays setupfilters.- Observation List allows sort byowner.- Observation List displays statusof "ErrMsg" when a non-criticalerror occurs during sampling.- JobId is added to observationdetails pop-up.- Display separate counts forgeneral and specialprocessors in MeasurementProfile report.- Optionally attribute CPU usageto system modules inCPU Referred Attributionreport.- Report statistics for multivolume datasets in DASDI/O Analysis reports.- Identify CICS remote files in theDASD EXCP Summary report.- New WebSphere report displaysCICS distributed program linkcalls are initiated from theservant regions-New WebSphere reportcorrelates WebSphereApplication Server activity withDB2 activity.- Create XML report files asvariable block by default.- Support SYSDEBUG source filescreated by Enterprise PL/I forz/OS V4. Enhancements to the listener andplug-in- Replace report options view witha dialog.- Add report options and reportdownload to individualreports toolbar.- Display procedure names inCPU Usage byProcedure report.- Allow the user to select thelocation of the localreports repository.- Allow access to local reports forinactive started tasks.- Support connection toApplication PerformanceAnalyzer instances operating ondifferent z/OS systems.-.Figure 4: The GUI provides a workstation interface to request and view reports4
IBM Application Performance Analyzer for z/OS, V13.1, at a glanceHardware requirements Any hardware configuration capable of running IBM z/OSSoftware requirements IBM z/OS, V1.12 (5694-A01) or later Depending on the functions used in the product, other relatedproducts may be required. See the product Web site, listed below,for more detailed software requirementsPart of a leading-edgefamily of z/OS toolsApplication Performance Analyzeris part of the IBM ProblemDetermination family of products.These include IBM ApplicationPerformance Analyzer for z/OS,IBM Debug Tool for z/OS, IBMFault Analyzer for z/OS, IBM FileManager for z/OS, and IBMWorkload Simulator for OS/390and z/OS.Designed to help you maximizeyour investment in IBM System z products, these products are arobust suite of integrateddevelopment tools that enable youto improve IT operational efficiencyand transform applications toachieve greater business flexibility.The IBM Problem Determinationtools help application developersto improve application deliverythroughout the application lifecycle. You can use these tools tohelp increase productivity and ITeffectiveness across source codedebugging, application ABENDanalysis, data management andapplication performance analysis. Copyright IBM Corporation 2013IBM Corporation555 Bailey AveSan Jose, CA 95141, U.S.A.For more informationTo learn more about IBM problemdetermination tools, contact yourIBM representative orIBM Business Partner, or visit thefollowing Web sites:IBM Problem Determination BM Application PerformanceAnalyzer for z/OS:ibm.com/software/awdtools/apa/IBM Debug Tool for z/OS:ibm.com/software/awdtools/debug tool/IBM Fault Analyzer for z/OS:ibm.com/software/awdtools/faultanalyzerIBM File Manager for z/OS:ibm.com/software/awdtools/filemanagerIBM Workload Simulator for z/OSand The IBM Problem Determinationtools do much more than supporttraditional applications. Theyinclude capabilities that enable youto build SOA applications. Theyare tightly integrated with othertools in the IBM problemdetermination tools portfolio, aswell as other tool sets. The toolsalso continue to support and makethe most of the latest subsystemlevels. These capabilities helpmake IBM problem determinationtools an excellent choice for yourbusiness.Produced in the U.S.A.October 2013All Rights ReservedIBM, the IBM logo, ibm.com, andWebSphere are trademarks of IBMCorporation, registered in manyjurisdictions worldwide. A currentlist of IBM trademarks is availableon the Web at “Copyright andtrademark information” atibm.com/legal/copytrade.shtml .Java and all Java-basedtrademarks and logos aretrademarks of Sun Microsystems,Inc, in the United States, othercountries, or both.Microsoft and Windows aretrademarks of MicrosoftCorporation, in the United States,other countries, or both.UNIX is a registered trademark ofThe Open Group in the UnitedStates and other countriesOther company, product andservice names may be trademarksor service marks of others.References in this publication toIBM products or services do notimply that IBM intends to makethem available in all countries inwhich IBM operates.The IBM home page on theinternet can be found at ibm.com5
Application Performance Analyzer can also analyze transactions running under an online subsystem such as IBM IMS , IBM CICS , and WebSphere Application Server, as well as DB2 stored procedures. Using Application Performance Analyzer helps you maximize the performance of your existing hardware resources and helps you improve the .