Transcription
April 7, 2014NOTE TO: All Medicare Advantage Organizations, Prescription Drug Plan Sponsors, andOther Interested PartiesSUBJECT:Announcement of Calendar Year (CY) 2015 Medicare Advantage Capitation Rates andMedicare Advantage and Part D Payment Policies and Final Call LetterIn accordance with section 1853(b)(1) of the Social Security Act (the Act), we are notifying youof the annual Medicare Advantage (MA) capitation rate for each MA payment area for CY 2015and the risk and other factors to be used in adjusting such rates. The capitation rate tables for2015 are posted on the Centers for Medicare & Medicaid Services (CMS) web site eAdvtgSpecRateStats/index.html underRatebooks and Supporting Data. The statutory component of the regional benchmarks,transitional phase-in periods for the Affordable Care Act rates, qualifying counties, and eachcounty’s applicable percentage are also posted at this website.Attachment I shows the final estimates of the National Per Capita MA Growth Percentage for2015 and the National Medicare Fee-for-Service (FFS) Growth Percentage for 2015. Thesegrowth rates will be used to calculate the 2015 capitation rates. As discussed in Attachment I,the final estimate of the National Per Capita MA Growth Percentage for combined aged anddisabled beneficiaries is -4.07 percent, and the final estimate of the FFS Growth Percentage is 3.3 percent. Attachment II provides a set of tables that summarizes many of the key Medicareassumptions used in the calculation of the National Per Capita MA Growth Percentage.Section 1853(b)(4) of the Act requires CMS to release county-specific per capita FFSexpenditure information on an annual basis, beginning with March 1, 2001. In accordance withthis requirement, FFS data for CY 2012 are being posted on the above website.Attachment III presents responses to comments on the Advance Notice of MethodologicalChanges for CY 2015 MA Capitation Rates and Part C and Part D Payment Policies (AdvanceNotice). Attachment IV contains the changes in the payment methodology for Medicare Part Dfor CY 2015. Attachment V contains tables with the Part D benefit parameters.Attachment VI contains details on Part D benefit parameters.Attachment VII presents the final Call Letter. We received many submissions in response toCMS’ request for comments on the Advance Notice/Call Letter, published on February 21, 2014.Comments were received from professional organizations, MA and Part D sponsors, advocacygroups, the pharmaceutical industry, pharmacy benefit managers, pharmacies, and concernedcitizens.1
Key Changes from the Advance Notice:Growth Percentages: Attachment I provides the final estimates of the National MA GrowthPercentage and the FFS Growth Percentage and information on deductibles for MSAs.CMS-HCC Risk Adjustment Models for CY2015: For reasons discussed in Attachment II,for the 2015 payment year we will blend the risk scores calculated using the 2013 CMS-HCCand 2014 CMS-HCC models by 67 percent and 33 percent, respectively.Medicare Advantage Enrollee Risk Assessments: CMS is not implementing, for 2015, theproposed policy to exclude, for payment purposes, diagnoses identified during a home visitthat are not confirmed by a subsequent clinical encounter.Normalization Factors: The final 2015 normalization factors are:CMS-HCC model implemented in 2013: 0.992Clinically Revised CMS-HCC model implemented in 2014: 0.978CMS-HCC model for PACE plans: 1.028ESRD Dialysis/Transplant model: 1.004ESRD Functioning Graft model: 1.028RxHCC model: 0.961RxHCC Risk Adjustment Model: CMS will not implement the updated RxHCC model in 2015.We will continue to use the RxHCC model used in 2014, as published in the 2014 RateAnnouncement (Attachment VII, Tables, 6-10).International Classification of Diseases-10 (ICD-10) Code Sets and Diagnosis Data Sources for2015 Risk Scores: As proposed in the Advance Notice, CMS will use the prior calendar year asthe data collection year for 2015 risk scores (specifically, we will use CY 2014 diagnoses tocalculate the risk scores used in 2015 payment). In addition, as proposed in the Advance Notice,CMS will use diagnoses from the Encounter Data System submissions for the calculation of2015 risk scores (2014 dates of service), in addition to diagnoses submitted to the RiskAdjustment Processing System. In the Advance Notice, we anticipated that data from both ofthese data sources would include diagnoses from ICD-10 code sets beginning with October 1,2014 dates of service. Section 212 of the “Protecting Access to Medicare Act of 2014” delayedthe adoption of ICD-10 standard code sets to no earlier than October 1, 2015. Therefore, onlyICD-9 standard code sets will be used for diagnoses for 2014 dates of service and, therefore, for2015 risk scores.Proposals Adopted as Issued in the Advance Notice:As in past years, policies proposed in the Advance Notice that are not modified or retracted inthe Rate Announcement become effective in the upcoming payment year. Clarifications in theRate Announcement supersede materials in the Advance Notice.2
MA Benchmark, Quality Bonus Payments and Rebate: The Affordable Care Act (ACA)established a new blended benchmark as the county MA rate effective in 2012. In the AdvanceNotice we announced the continued implementation of the methodology used to derive the newACA blended benchmark county rates, how the qualifying bonus counties will be identified, andhow transitional phase in periods are determined. The continued applicability of the star systemwas also announced, along with the end of the Quality Bonus Payment demonstration. ThisAnnouncement finalizes these proposals.Calculation of FFS Rates: We rebased the FFS capitation rates for 2015, using historical claimsdata for 2008 through 2012. We are finalizing, as proposed, transitioning to 100 percentrepricing of the historical claims data to reflect the most current wage and cost indices. For2015, we repriced the claims to account for the changes made by the ACA to payments todisproportionate share hospitals. We also repriced durable medical equipment claims to accountfor the change in prices associated with the competitive bid program.IME Phase Out: For 2015, CMS will continue phasing out indirect medical education amountsfrom MA capitation rates.ESRD State Rates: We will continue to determine the 2015 ESRD dialysis rates by state as wespecified in the Advance Notice.Clinical Trials: We are continuing the policy of paying on a FFS basis for qualified clinical trialitems and services provided to MA plan members that are covered under the National CoverageDeterminations on clinical trials.Location of Network Areas for PFFS Plans in Plan Year 2016: The list of network areas for planyear 2016 is available on the CMS website at r PFFS Plan Network Requirements.Adjustment for MA Coding Pattern Differences: We will implement an MA coding patterndifference adjustment of 5.16 percent for payment year 2015.Frailty Adjustment for PACE organizations and FIDE SNPs: We are finalizing as proposed the2015 frailty factors.MSP Factor: The MSP adjuster for 2015 is 0.173 for working aged and working disabledbeneficiaries and the ESRD MSP factor for 2015 is 0.215.Medical Loss Ratio Credibility Adjustment: We are finalizing the credibility adjustment factorsas published in the MLR final rule (CMS-4173-F).Payment Reconciliation: The 2015 risk percentages and payment adjustments for Part D risksharing will be finalized as stated in the Advance Notice.3
Part D Benefit Parameters: Attachment V provides the updated 2015 Part D benefit parametersfor the defined standard benefit, low-income subsidy, and retiree drug subsidy./s/Jonathan BlumPrincipal Deputy AdministratorCenters for Medicare & Medicaid Services/s/Richard F. Coyle, Jr., A.S.A., M.A.A.A.Acting DirectorParts C & D Actuarial GroupOffice of the ActuaryAttachments4
2015 ANNOUNCEMENTAnnouncement of Calendar Year (CY) 2015 Medicare Advantage Capitation Rates andMedicare Advantage and Part D Payment Policies and Final Call Letter . . . . . . . . . . . . 1Key Changes from the Advance Notice: . . . . . . . . . . . . . . . . . . . . . . . . . . . . . . . . . . . . . . 2Proposals Adopted as Issued in the Advance Notice: . . . . . . . . . . . . . . . . . . . . . . . . . . . . . 2Attachment I. Final Estimate of the National Per Capita MA Growth Percentage and theNational Medicare Fee-for-Service Growth Percentage for 2015 . . . . . . . . . . . . . . . . . 7Attachment II. Key Assumptions and Financial Information . . . . . . . . . . . . . . . . . . . . . . . . . . 9Attachment III. Responses to Public Comments . . . . . . . . . . . . . . . . . . . . . . . . . . . . . . . . . . 17Section A. Final Estimate of the National Per Capita Growth Percentage and the Feefor-Service (FFS) Growth Percentage for Calendar Year 2015 . . . . . . . . . . . . . . . . 17Section B. MA Benchmark, Quality Bonus Payments and Rebate . . . . . . . . . . . . . . . . . . 20Section C. Calculation of Fee for Service Rates . . . . . . . . . . . . . . . . . . . . . . . . . . . . . . . . 22Section D. IME Phase Out . . . . . . . . . . . . . . . . . . . . . . . . . . . . . . . . . . . . . . . . . . . . . . . 25Section E. ESRD State Rates . . . . . . . . . . . . . . . . . . . . . . . . . . . . . . . . . . . . . . . . . . . . . 26Section F. Clinical Trials. . . . . . . . . . . . . . . . . . . . . . . . . . . . . . . . . . . . . . . . . . . . . . . . 26Section G. CMS-HCC Risk Adjustment Model for CY 2015 . . . . . . . . . . . . . . . . . . . . . 26Section H. Medicare Advantage Enrollee Risk Assessments . . . . . . . . . . . . . . . . . . . . . . 27Section I. Adjustment for MA Coding Pattern Differences . . . . . . . . . . . . . . . . . . . . . . . . 28Section J. Normalization Factors . . . . . . . . . . . . . . . . . . . . . . . . . . . . . . . . . . . . . . . . . . 29Section K. Frailty Adjustment for PACE organizations and FIDE SNPs . . . . . . . . . . . . . 30Section L. MSP Factor . . . . . . . . . . . . . . . . . . . . . . . . . . . . . . . . . . . . . . . . . . . . . . . . . 31Section M. Medical Loss Ratio Credibility Adjustment . . . . . . . . . . . . . . . . . . . . . . . . . 31Section N. International Classification of Diseases-10 (ICD-10) Code Sets and DiagnosisData Sources for 2015 Risk Scores . . . . . . . . . . . . . . . . . . . . . . . . . . . . . . . . . . . . 32Attachment IV. Changes in the Payment Methodology for Medicare Part D for CY 2015 . . . 34Section A. Update of the RxHCC Model . . . . . . . . . . . . . . . . . . . . . . . . . . . . . . . . . . . . 34Section B. Payment Reconciliation . . . . . . . . . . . . . . . . . . . . . . . . . . . . . . . . . . . . . . . . 35Section C. Part D Benefit Parameters for the Defined Standard Benefit: . . . . . . . . . . . . . 35Annual Adjustments for 2015 . . . . . . . . . . . . . . . . . . . . . . . . . . . . . . . . . . . . . . . . . . 35Attachment V. Final Updated Part D Benefit Parameters for Defined Standard Benefit,Low-Income Subsidy, and Retiree Drug Subsidy . . . . . . . . . . . . . . . . . . . . . . . . . . . . 375
Section A. Annual Percentage Increase in Average Expenditures for Part D Drugs perEligible Beneficiary . . . . . . . . . . . . . . . . . . . . . . . . . . . . . . . . . . . . . . . . . . . . . . . 39Section B. Annual Percentage Increase in Consumer Price Index, All Urban Consumers(all items, U.S. city average) . . . . . . . . . . . . . . . . . . . . . . . . . . . . . . . . . . . . . . . . . 39Section C. Calculation Methodology . . . . . . . . . . . . . . . . . . . . . . . . . . . . . . . . . . . . . . . 40Annual Percentage Increase . . . . . . . . . . . . . . . . . . . . . . . . . . . . . . . . . . . . . . . . . . . 40Annual Percentage Increase in Consumer Price Index, All Urban Consumers (allitems, U.S. city average) . . . . . . . . . . . . . . . . . . . . . . . . . . . . . . . . . . . . . . . . 41Section D. Retiree Drug Subsidy Amounts . . . . . . . . . . . . . . . . . . . . . . . . . . . . . . . . . . . 42Section E. Estimated Total Covered Part D Spending at Out-of-Pocket Threshold forApplicable Beneficiaries . . . . . . . . . . . . . . . . . . . . . . . . . . . . . . . . . . . . . . . . . . . . 42Attachment VI. 2015 Call Letter . . . . . . . . . . . . . . . . . . . . . . . . . . . . . . . . . . . . . . . . . . . . . 45How to Use This Call Letter . . . . . . . . . . . . . . . . . . . . . . . . . . . . . . . . . . . . . . . . . . . 46Section I – Parts C and D . . . . . . . . . . . . . . . . . . . . . . . . . . . . . . . . . . . . . . . . . . . . . . . . 47Annual Calendar . . . . . . . . . . . . . . . . . . . . . . . . . . . . . . . . . . . . . . . . . . . . . . . . . . . 47Incomplete and Inaccurate Bid Submissions . . . . . . . . . . . . . . . . . . . . . . . . . . . . . . . 53Providing Materials to Individuals with Disabilities . . . . . . . . . . . . . . . . . . . . . . . . . . 82Summary of Benefits . . . . . . . . . . . . . . . . . . . . . . . . . . . . . . . . . . . . . . . . . . . . . . . . 83B. Transferability of MOOP Contributions When an Enrollee Changes Plans Duringthe Contract Year . . . . . . . . . . . . . . . . . . . . . . . . . . . . . . . . . . . . . . . . . . 95Part C Change of Ownership Transactions Requiring Service Area Expansions . . . . . 108Part D Benefit Parameters for Non-Defined Standard Plans . . . . . . . . . . . . . . . . . . . 123Appendix 1 – Contract Year 2015 Guidance for Prescription Drug Plan (PDP) Renewalsand Non-Renewals . . . . . . . . . . . . . . . . . . . . . . . . . . . . . . . . . . . . . . . . . . . . . . . 132Appendix 2 – Contract Year 2015 Guidance for Prescription Drug Plan (PDP) Renewalsand Non-Renewals - Table . . . . . . . . . . . . . . . . . . . . . . . . . . . . . . . . . . . . . . . . . 136Appendix 3 - Summary of Comments on the Draft Call Letter to ProposedEnhancements to the 2015 Star Ratings and Beyond . . . . . . . . . . . . . . . . . . . . . . . 1416
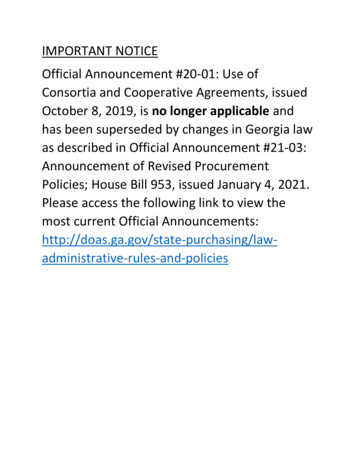
Attachment I. Final Estimate of the National Per Capita MA Growth Percentage and theNational Medicare Fee-for-Service Growth Percentage for 2015The Table I-1 below shows the National Per Capita MA Growth Percentage (NPCMAGP) for2015. Consistent with the 2014 payment announcement, the basis for the growth percentagereflects an assumption that Congress will act to prevent the projected 24.1 percent reduction inMedicare physician payment rates from occurring in 2015. The Office of the Actuary has beendirected by the Secretary to use this assumption on the grounds that it is a more reasonableexpectation than the reduction required under the statutory “sustainable growth rate” (SGR)formula. We have calculated the final MA Growth Percentage and the FFS Growth Percentagebased on the assumption of a zero percent update for the physician fee schedule for 2015.An adjustment of -4.00 percent for the combined aged and disabled is included in theNPCMAGP to account for corrections to prior years’ estimates as required by section1853(c)(6)(C). The combined aged and disabled change is used in the development of theratebook.Table I-1 - National Per Capita MA Growth Percentage for 2015Prior ChangesAged Disabled1Current Changes2003 to 20142003 to 20142014 to 20152003 to 201549.06%43.10%-0.07%43.00%NPCMAGP for 2015With §1853(c)(6)(C)1adjustment-4.07%Current changes for 2003-2015 divided by the prior changes for 2003 to 2014.The Affordable Care Act of 2010 requires the Medicare Advantage benchmark amounts be tiedto a percentage of the county FFS amounts. There will be a transition to the percentage of FFSover a number of years. Table I-2 below provides the change in the FFS USPCC which will beused for the county FFS portion of the benchmark. The percentage change in the FFS USPCC isshown as the current projected FFS USPCC for 2015 divided by projected FFS USPCC for 2014as estimated in the 2014 Rate Announcement released on April 1, 2013.Table I-2 – FFS USPCC Growth Percentage for CY 2015Aged DisabledDialysis –only ESRDCurrent projected 2015 FFS USPCC 768.84 6,951.56Prior projected 2014 FFS USPCC 795.11 7,063.55Percent change-3.30%-1.59%Table I-3 below shows the monthly actuarial value of the Medicare deductible and coinsurancefor 2014 and 2015. In addition, for 2015, the actuarial value of deductibles and coinsurance is7
being shown for non-ESRD only, since the plan bids will not include ESRD benefits in 2015.These data were furnished by the Office of the Actuary.Table I-3 - Monthly Actuarial Value of Medicare Deductible and Coinsurance for 2014 and 2015Part A Benefits1Part B BenefitsTotal Medicare120142015Change2015 non-ESRD 39.13 37.23-4.9% 35.34 114.99 111.14-3.4% 102.22 154.12 148.37-3.7% 137.56Includes the amounts for outpatient psychiatric charges.Medical Savings Account (MSA) Plans. The maximum deductible for current law MSA plansfor 2015 is 10,750.8
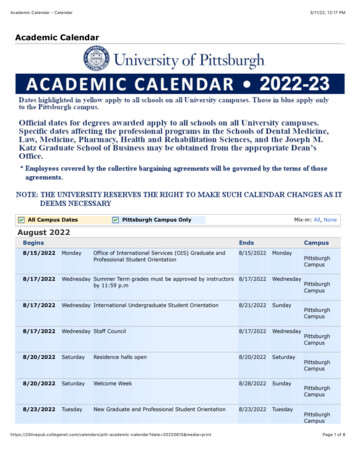
Attachment II. Key Assumptions and Financial InformationThe USPCCs are the basis for the National Per Capita MA Growth Percentage. Attached is atable that compares last year’s estimate of United States Per Capita Costs (USPCC) with currentestimates for 2003 to 2016. In addition, this table shows the current projections of the USPCCsthrough 2017. We are also providing an attached set of tables that summarize many of the keyMedicare assumptions used in the calculation of the USPCCs. Most of the tables includeinformation for the years 2003 through 2017.Most of the tables in this attachment present combined aged and disabled non-ESRD data. TheESRD information presented is for the combined aged-ESRD, disabled-ESRD and ESRD only.All of the information provided in this enclosure applies to the Medicare Part A and Part Bprograms. Caution should be employed in the use of this information. It is based uponnationwide averages, and local conditions can differ substantially from conditions nationwide.None of the data presented here pertain to the Medicare prescription drug benefit.9
Comparison of Current & Previous Estimates of the Total USPCC – 102011201220132014201520162017Part ACurrent Last Year’sEstimateEstimatePart BCurrent Last Year’sEstimateEstimateCurrentEstimate 295.77 313.80 334.52 344.97 355.59 371.88 385.42 384.96 387.89 375.27 376.48 366.12 360.16 366.13 377.41 247.41 270.70 292.49 313.33 330.32 350.66 367.56 376.37 385.86 392.69 397.25 411.17 416.59 428.68 447.97 543.18 584.50 627.01 658.30 685.91 722.54 752.98 761.33 773.75 767.96 773.73 777.29 776.75 794.81 825.38 295.77 313.80 334.52 344.97 355.59 373.36 385.74 385.58 390.04 382.67 386.10 382.36 383.54 396.10 249.37 273.97 293.53 314.44 332.26 352.68 369.93 378.57 388.44 398.54 409.27 430.24 442.62 457.28Part A & Part BLast Year’sEstimateRatio 545.14 587.77 628.05 659.41 687.85 726.04 755.67 764.15 778.48 781.21 795.37 812.60 826.16 40.9830.9730.9570.9400.931Comparison of Current & Previous Estimates of the FFS USPCC – 17Part ACurrent Last Year’sEstimateEstimatePart BCurrent Last Year’sEstimateEstimateCurrentEstimate 372.39 371.16 353.75 359.28 358.09 358.67 363.95 374.25 374.18 383.77 391.46 393.53 399.37 410.17 421.63 439.41 746.57 754.93 745.21 752.81 757.46 768.84 785.58 813.66 373.21 373.94 363.60 371.79 375.59 380.58 393.40 377.18 387.71 398.83 409.18 419.52 436.60 451.66Part A & Part BLast Year’sEstimateRatio 750.39 761.65 762.43 780.97 795.11 817.18 n of Current & Previous Estimates of the ESRD Dialysis-only FFS 14201520162017 6,834.14 6,770.39 6,719.08 6,780.23 6,813.82 6,951.56 7,239.14 7,529.4010Part A BLast Year’sEstimateRatio 6,834.14 6,770.39 6,834.71 7,039.85 7,063.55 7,324.21 7,945.051.0001.0000.9830.9630.9650.9490.911
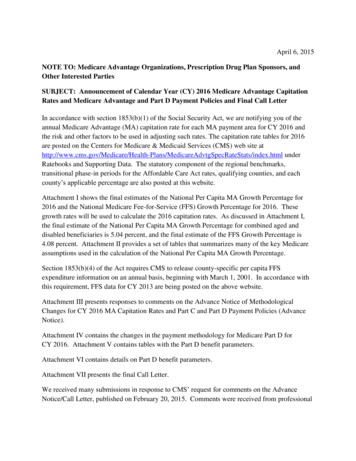
Basis for ESRD Dialysis-only FFS USPCC TrendCalendarYearPart A BAdjustmentAdjustedAll ESRDFactor for Dialysis-onlyCumulative DialysisCumulativeFFS 1.01411.03461.07741.1206Note: 2012 All ESRD FFS USPCC is 4870.99Summary of Key ProjectionsPart A1YearCalendar YearCPI Percent ChangeFiscal YearPPS Update %1.9%-0.6%-0.1%2.8%0.9%1.5%2.0%1.5%FY Part A Total %2.9%4.2%0.3%3.7%1.4%1.5%4.1%5.6%Part B2Calendar 14201520162017Physician Fee art B 6.4%12.2%6.2%7.0%6.7%Percent change over prior year.Percent change in charges per Aged Part B enrollee.3Residual factors are factors other than price, including volume of services, intensity of services, and age/sex 3%1.7%0.1%2.6%0.3%3.3%4.2%
Medicare Enrollment Projections (In Millions)Non-ESRD TotalPart ACalendar 0348.997Part 9007.2087.4497.6187.7717.9178.0338.117Non-ESRD Fee For ServicePart ACalendar 1633.860Part .6915.7265.6775.6405.7605.8015.781ESRDCalendar 14201520162017ESRD-TotalTotal Part ATotal Part 112ESRD-Fee For ServiceTotal Part ATotal Part 9
Part A Projections for non-ESRD (Aged 0102011201220132014201520162017Inpatient HospitalAged 5.502,351.072,366.912,406.13SNFAged me HealthAged erage reimbursement per enrollee on an incurred basis, except where noted.13Managed CareAged 831,282.841,350.04Hospice: TotalReimbursement(in Millions)Aged 8814,03415,18416,10617,11818,27919,62221,160
Part B Projections for non-ESRD (Aged Disabled)Calendar YearPhysician Fee ScheduleAged DisabledPart B HospitalAged DisabledDurable Medical EquipmentAged 75131.75116.18118.62Calendar YearCarrier LabAged DisabledOther CarrierAged DisabledIntermediary LabAged 404.50407.93405.84403.94417.19426.21439.50Calendar 14201520162017Other IntermediaryAged me HealthAged erage reimbursement per enrollee on an incurred .3096.8193.2733.0434.5936.3538.11Managed CareAged 751,707.081,821.65
2015 Projections by Service Category for non-ESRD (Aged Disabled)*Service TypePart AInpatient HospitalSNFHome HealthManaged CarePart BPhysician Fee SchedulePart B HospitalDurable Medical EquipmentCarrier LabOther CarrierIntermediary LabOther IntermediaryHome HealthManaged CareCurrentEstimateLast 171.007* Average reimbursement per enrollee on an incurred basisClaims Processing Costs as a Fraction of 102011201220132014201520162017Part 009940.0009940.000994Part 028460.0028460.002846Approximate Calculation of the USPCC, the National MA Growth Percentage forCombined (Aged Disabled) Beneficiaries, and the FFS USPCC (Aged Disabled)The following procedure will approximate the actual calculation of the USPCCs from theunderlying assumptions for the contract year for both Part A and Part B.Part A:15
The Part A USPCC can be approximated by using the assumptions in the tables titled “Part AProjections Under Present Law for non-ESRD (Aged Disabled)” and “Claims Processing Costsas a Fraction of Benefits.” Information in the “Part A Projections” table is presented on acalendar year per capita basis. First, add the per capita amounts over all types of providers(excluding hospice). Next, multiply this amount by 1 plus the loading factor for administrativeexpenses from the “Claims Processing Costs” table. Then, divide by 12 to put this amount on amonthly basis.Part B:The Part B USPCC can be approximated by using the assumptions in the tables titled “Part BProjections under Present Law for non-ESRD (Aged Disabled)” and “Claims Processing Costsas a Fraction of Benefits.” Information in the “Part B Projections” table is presented on acalendar year per capita basis. First, add the per capita amounts over all types of providers.Next, multiply by 1 plus the loading factor for administrative expenses and divide by 12 to putthis amount on a monthly basis.The National Per Capita MA Growth Percentage:The National Per Capita MA Growth Percentage for 2015 (before adjustment for prior years’over/under estimates) is calculated by adding the USPCCs for Part A and Part B for 2015 andthen dividing by the sum of the current estimates of the USPCCs for Part A and Part B for 2014.The FFS USPCC:The tables used to calculate the total USPCC can also be used to approximate the calculations ofthe FFS USPCC. The per capita data presented by type of provider in the projections tables forboth Part A and B are based on total enrollment. To approximate the FFS USPCCs, first add thecorresponding provider types under Part A and Part B separately. For the FFS calculations, donot include the managed care provider type. Next, rebase the sum of the per capita amounts forFFS enrollees, i.e., multiply the sum by total enrollees and divide by FFS enrollees. (Theenrollment tables in this attachment now also include FFS enrollment). Then, multiply by 1 plusthe loading factor for administrative expenses and divide by 12. The result will only beapproximate because there is an additional adjustment to the FFS data which accounts for costplan data which comes through the FFS data system. This cost plan data is in the total per capitaamounts by type of provider, but is removed for the FFS calculations.16
Attachment III. Responses to Public CommentsSection A. Final Estimate of the National Per Capita Growth Percentage and the Fee-forService (FFS) Growth Percentage for Calendar Year 2015Comment: Several commenters had concerns about the magnitude of changes proposed in theAdvance Notice and the potential impact to Medicare beneficiaries and plans. Commentersraised concerns that the payment reductions described in the Advance Notice would lead tosignificantly higher MA premiums, significantly reduced benefits, or both. Some commentersargued that these cuts would lead to MA plans exiting the market. Some providers noted that thereductions to MA contained in the Advance Notice would seriously threaten their ability toprovide high quality care to beneficiaries. We also received comments that the cuts would leadto market contraction, less competition, and ultimately less access for beneficiaries.Commenters requested that we keep Medicare Advantage revenue flat for 2015.Response: We are committed to a strong, stable Medicare Advantage program and to continuedaccess to high quality plan choices for Medicare beneficiaries. Over the past several years, evenas the Medicare Advantage program transitioned to payments that are more aligned with FFSMedicare costs, enrollment in Medicare Advantage h
Announcement of Calendar Year (CY) 2015 Medicare Advantage Capitation Rates and Medicare Advantage and Part D Payment Policies and Final Call Letter . In accordance with section 1853(b)(1) of the Social Security Act (the Act), we are notifying you of the annual Medicare Advantage (MA) capitation rate for each MA payment area for CY 2015