Transcription
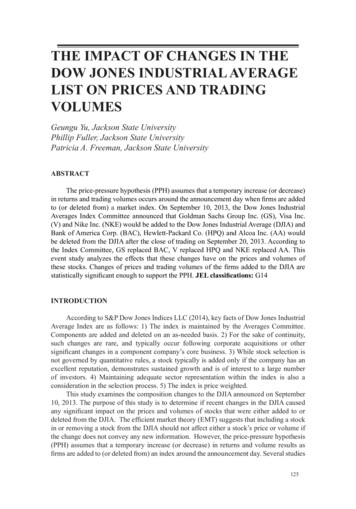
THE IMPACT OF CHANGES IN THEDOW JONES INDUSTRIAL AVERAGELIST ON PRICES AND TRADINGVOLUMESGeungu Yu, Jackson State UniversityPhillip Fuller, Jackson State UniversityPatricia A. Freeman, Jackson State UniversityABSTRACTThe price-pressure hypothesis (PPH) assumes that a temporary increase (or decrease)in returns and trading volumes occurs around the announcement day when firms are addedto (or deleted from) a market index. On September 10, 2013, the Dow Jones IndustrialAverages Index Committee announced that Goldman Sachs Group Inc. (GS), Visa Inc.(V) and Nike Inc. (NKE) would be added to the Dow Jones Industrial Average (DJIA) andBank of America Corp. (BAC), Hewlett-Packard Co. (HPQ) and Alcoa Inc. (AA) wouldbe deleted from the DJIA after the close of trading on September 20, 2013. According tothe Index Committee, GS replaced BAC, V replaced HPQ and NKE replaced AA. Thisevent study analyzes the effects that these changes have on the prices and volumes ofthese stocks. Changes of prices and trading volumes of the firms added to the DJIA arestatistically significant enough to support the PPH. JEL classifications: G14INTRODUCTIONAccording to S&P Dow Jones Indices LLC (2014), key facts of Dow Jones IndustrialAverage Index are as follows: 1) The index is maintained by the Averages Committee.Components are added and deleted on an as-needed basis. 2) For the sake of continuity,such changes are rare, and typically occur following corporate acquisitions or othersignificant changes in a component company’s core business. 3) While stock selection isnot governed by quantitative rules, a stock typically is added only if the company has anexcellent reputation, demonstrates sustained growth and is of interest to a large numberof investors. 4) Maintaining adequate sector representation within the index is also aconsideration in the selection process. 5) The index is price weighted.This study examines the composition changes to the DJIA announced on September10, 2013. The purpose of this study is to determine if recent changes in the DJIA causedany significant impact on the prices and volumes of stocks that were either added to ordeleted from the DJIA. The efficient market theory (EMT) suggests that including a stockin or removing a stock from the DJIA should not affect either a stock’s price or volume ifthe change does not convey any new information. However, the price-pressure hypothesis(PPH) assumes that a temporary increase (or decrease) in returns and volume results asfirms are added to (or deleted from) an index around the announcement day. Several studies125
have been conducted to examine these important issues. Prior studies focused on changesin the composition of the S&P 500, FTSE 100, Australian All Ordinaries and DJIA.This paper is organized as follows: the first section is a literature review; the secondsection describes the methodology; the third section explains the findings; the final sectionsets forth a summary and conclusion. There are three tables presenting the key descriptiveand analytical statistics of this study.LITERATURE REVIEWHarris and Gurel (1986) confirmed the PPH in examining prices and volumesurrounding changes in the composition of the S&P 500. The PPH assumes that investorswho accommodate demand shifts must be compensated for the transaction costs andportfolio risks that they bear when they agree to immediately buy or sell securities, whichthey otherwise would not trade. The PPH and EMH are similar in that both suggest thatlong-run demand is elastic at the full-information price, but they differ in that the PPHhypothesizes that short-term demand curves may be less than perfectly elastic. They foundthat immediately after an addition is announced, prices increased by more than 3 percent,but the increase was nearly fully reversed after two weeks.Lamoureux and Wansley (1987) supported the PPH. By examining market responsesto changes in the S&P 500, they found that stocks added to (or deleted from) the indexexperienced a significant positive (or negative) announcement day excess return. Theaverage announcement day trading volume for firms added to the S&P 500 was substantiallylarger than the average pre-period trading volume of traded stocks. Pruitt and Wei (1989)also supported the PPH by showing that institutional holdings increased when listingoccurred.Sahin (2005) analyzed the valuation and volume effects of 219 additions of RealEstate Investment Trusts (REITs) to various S&P indices since 2001. Salin’s analysissupported the PPH. The study found that the inclusions of REITS in various S&P indicesexperienced approximately a 5 percent market-adjusted abnormal return on average at thetime of the announcement.Chan and Howard (2002) examined additions to and deletions from the Australian AllOrdinaries Share Price Index (AOI). They found significant changes in daily returns andvolume around the change date, which supported the PPH. They believed their findings,which were contrary to some findings based on the S&P500, were due to institutionaldifferences in how changes in the composition of the AOI and S&P 500 are determined.Gregoriou and Ioannidis (2006) examined changes in the FTSE 100. They foundno evidence that suggested that changes of the FTSE 100 supported the PPH. However,their findings were consistent with the information cost and liquidity explanation in thatinclusion in (or deletion from) the FTSE 100 list increased (or decreased) the likelihoodthat they would be widely followed. Their study supported Merton’s attention hypothesisin that the changes in the FTSE 100 affected the likelihood of the market’s attention.Beneish and Gardner (1995), examining changes in the composition of the DJIA,found that the price and the trading volume of newly added DJIA firms were unaffected.However, firms removed from the index experienced significant price declines, which wasconsistent with the PPH. They believed that the market demanded an extra-return premiumfor higher trading costs due to relatively less information available to those stocks removedfrom the index. This suggested that the short-term demand curves of firms removed from126
the index would not be perfectly elastic, supporting the downward-sloping demand curvehypothesis.Poloncheck and Krehbiel (1994) compared the price and volume responses associatedwith changes in the DJIA and Dow Jones Transportation Averages. They found thatfirms added to the roster of the DJIA experienced significantly positive abnormal returnsand significantly greater trading volume on the event date; however, firms added to theTransportation Average experienced neither event period abnormal returns nor increasedtrading volume. They attributed the lack of significant effects on the Transportation Averageto much less media attention, supporting Merton’s (1987) attention hypothesis.METHODOLOGYTable 1 shows profiles of the additions and deletions of DJIA constituents effectivewith the close of trading on Friday, September 20, 2013 with the key descriptive statistics asof close on Feb. 14, 2014. The actual trading with the new constituents began on Monday,September 23, 2013. The average retail price per share of the added stocks is eight timeshigher than that of the deleted stocks; the market caps and dividend yields are about in thesame ranges, but the average P/E ratio of the added stocks is 1.4 times higher than that ofthe deleted. The significantly higher average price of the new additions means that thesestocks will influence the index value in much greater proportion due to the fact that DJIAindex is price-weighted. Another conspicuous difference is on PEG, Price/Earnings toGrowth ratio. That is, the average PEG of the added stocks is 1.77, which is absolutelysuperior to that of the deleted stocks, -1.63. An implication of this comparison is thatinvestors and the index observers should pay attention to the PEG ratio in particular foridentifying likely candidates for additions or deletions.As shown in TABLE 1, three firms, GS, V, and NKE, were added and three firms,BAC, HPQ, and AA, were deleted. For all six firms, daily stock price and trading volumedata were collected from historical data provided by Commodity Systems, Inc. for theperiod from June 27, 2013 to December 16, 2013, spanning 121 days, 60 days before andafter September 23, 2013, the first day of trading reflecting the changes. Actual rates ofreturn data will be calculated for 59 days before and after Monday, September 23, 2013.DIA, DIAMONDS Trust Series I (ETF) was used for market proxy with the data collectedfor the same period.An event study was conducted to evaluate the impact on returns and volume on thetwo portfolios. The market model was used to calculate excess returns or the predictionerror as follows:PEt Rt – [a (b*RMt)](1)where PEt the prediction error for market period or day t,Rt the logarithmic return of the stock for day t, defined by ln (Pt/Pt-1) or ln (Pt) – ln (Pt-1),RMt the logarithmic market return for period t or day t, anda and b are ordinary least squares estimates of the coefficients of the market model.127
A positive (or negative) prediction error means that the underlying stock priceincreased (or decreased) more than was predicted. As in Beneish and Gardner (1995) andGregoriou and Ioannidis (2003), prediction errors are examined over the 120-day periodthat extends from 59 days before to 59 days after the changes were announced. Averageprediction errors, APE, are computed by dividing the prediction errors by the number offirms in the sample on each day t.To assess the presence of abnormal returns, the average prediction errors are cumulatedover intervals of k days from t through t k to obtain cumulative average prediction errors,CAE. That is,CAEt,t k APEii t, t 1, t 2, t 3, . . . , t k.(2)Following the procedure used by Beneish and Gardner (1995) and Gregoriou andIoannidis (2003) to test the null hypothesis that CAE equals zero, the following t-statisticwith 79 degrees of freedom was computed:t CAEt,t k /[ks2APE]1/22s APE 1 80 ( APEt APE ) 279 t 1(3)(4)where s2APE is an equally weighted portfolio variance estimate and APE is the mean averageprediction error for the 80-trading-day estimation period.The behavior of trading volume is analyzed based on the procedures used by Beneishand Gardner (1995) and Polonchek and Krehbiel (1994). Three announcement periodsare examined: 1) the day of the announcement; 2) the day of the announcement and theday before the announcement; and 3) the day before the announcement, the day of theannouncement, and the day after the announcement. First, trading volume is evaluatedaround the announcement with the mean volume in the prior eight weeks adjusted forchanges in the market volume. Then, the mean trading volume for the eight weeks priorto and after the announcement period of DJIA changes (excluding days -1 to 1) arecompared.Following the procedure of Beneish and Gardner (1995), Polonchek and Krehbiel(1994) and Gregoriou and Ioannidis (2003), trading volume is examined using the marketvolume adjustment approach. The null hypothesis is that this ratio is 1. The relative tradingvolume, VR, is measured for firm i by the following equation:VRit (VOLit/VOLmt)(5)where VOLit is the natural logarithm of trading volume of security i traded in period t ofadded (deleted) firms and VOLmt is the natural logarithm of trading volume for DIA inperiod t.The natural logarithm is used to compensate for the fact that daily volume distributionshave been found to be skewed to the right and leptokurtotic (Polonchek and Krehbiel,1994). Ajinkya and Jain (1989) found that natural log transformations of the volumemeasures are approximately normally distributed. Following the procedure of Beneish andGardner (1995) and Gregoriou and Ioannidis(2003), the t-test is used to test the hypothesisof no significant statistical difference.128
FINDINGSTable 2 summarizes the results of the tests to determine if stock prices are affectedwhen stocks are either added to or deleted from the DJIA list. As can be seen from Table2, the stock returns of firms added to the DJIA are significantly affected by their inclusion.For example, the CAE is significant at the 1 % level for the added firms: on the day afterannouncement day (Day -9) is 2.183% (t 2.8910); on the day before first trading day(Day -1), 2.626% (t 3.4767); and on Day 4, 2.111% (t 2.7962).The stock returns of firms deleted from the DJIA are mostly not affected by theirdeletion. However, the CAE on the Day 4 for firms deleted from the DJIA is statisticallysignificant at the 5 % level; on the Day -3, 2.1% (t 1.8952). Our findings suggest thatchanging the composition of the DJIA does provide significant new information or pricingpressure as proposed by the PPH in that the stock returns of the added firms are significantlyaffected by the decision.Table 3 presents the results of the tests on market-adjusted trading volume effects.For the five sets of trading periods, there are significant increases in trading volume onthe days surrounding the first trading day compared to the prior eight weeks for firms thatwere either added to or deleted from the DJIA. For the case of stocks added, the magnitudeof trading volume increases is much more significant around the first trading day afterthe DJIA list changes become effective, compared to the days around the announcementday (Day -10). For example, the mean VR of days -1 1 is 7.648 times the benchmarkvolume, statistically significant at the 1 percent level; the mean VR of days -9 -8 is 3.343times the benchmark volume, significant only at the 10 percent level. Overall, the volumeanalyses support the PPH.SUMMARY AND CONCLUSIONThis study examines the 2013 changes to the DJIA that had not previously beenexamined. In recent years, the stock markets have experienced several operational changes.For example, high-frequency trading has become a dominant force; individual investorsare able to quickly alter their portfolios for tactical and/or strategic reasons by engagingin online trading; individuals and institutions can easily invest in DJIA by purchasingDiamonds ETF fund (DIA). Probably because of these changes, significant additionalinformation was provided when stocks were announced to be included in the DJIA list onSeptember 10, 2013. Trading volumes changed significantly both for added and deletedstocks around the first trading day. Therefore, the findings of this study are consistentwith prior research findings supporting the PPH. In essence, changing the composition ofthe DJIA in September 2013 provided the market with significant changes in returns andtrading volumes particularly for the added firms.129
REFERENCESAjinkya, B., & Jain, P. (1989). The Behavior of Daily Stock Market Trading Volume.Journal of Accounting and Economics, 11(4), 331–359. doi:10.1016/01654101(89)90018-9Beneish, M., & Gardner, J. (1995). Information Costs and Liquidity Effects fromChanges in the Dow Jones Industrial Average List. The Journal of Financial andQuantitative Analysis, 30(1), 135–157. doi:10.2307/2331257Chan, W. H., & Howard, P. (2002). Additions to and Deletions from an Open-EndedMarket Index: Evidence from the Australian All Ordinaries. Australian Journal ofManagement, 27(1), 45–74.doi:10.1177/031289620202700103Gregoriou, A., & Ioannidis, C. (2006). Information Costs and Liquidity Effects fromChanges in the FTSE 100 List. The European Journal of Finance, 12(4), 347–360doi:10.1080/13518470500249340Harris, L., & Gurel, E. (1986). Price and Volume Effects Associated with Changes in theS&P 500 List: New Evidence for the Existence of Price Pressures. The Journal ofFinance, 41(4), 815–829. doi:10.2307/2328230Lamoureux, C., & Wansley, J. (1987). Market Effects of Changes in Standard & Poor’s500 Index. The Financial Review, 22(1), 53–69 doi:10.1111/j.1540-6288.1987tb00318.Merton, R. (1987). A Simple Model of Capital Market Equilibrium with IncompleteInformation. The Journal of Finance, 42(3), 483–510 doi:10.1111/j.1540-6261.1987.tb04565.xPolonchek, J., & Krehbiel, T. (1994). Price and Volume Effects Associated with Changesin the Dow Jones Averages. The Quarterly Review of Economics and Finance, 34(4),305–316. doi:10.1016/1062-9769(94)90016-7Poterba, J., & Shoven, J. (2002). Exchange-Traded Funds: A New InvestmentOption for Taxable Investors. American Economic Review, 92(2), 422–427.doi:10.1257/000282802320191732Pruitt, S., & Wei, K. J. (1989). Institutional Ownership and Changes in the S&P 500. TheJournal of Finance, 44(2), 509–513. doi:10.2307/2328603Sahin, O. F. (2005). The Impact of Standard & Poor’s Index Inclusions on Real EstateInvestment Trusts. The Southern Business & Economic Journal, 28.S&P Dow Jones Indices LLC. (2014). Retrieved 14 February 2014, from http://djindexes.com130
131
132
133
134
The behavior of trading volume is analyzed based on the procedures used by Beneish and Gardner (1995) and Polonchek and Krehbiel (1994). Three announcement periods are examined: 1) the day of the announcement; 2) the day of the announcement and the day before the announcement; and 3) the day before the announcement, the day of the


