Transcription
NBER WORKING PAPER SERIESBIASES IN THE IPO PRICING PROCESSMichelle LowryG. William SchwertWorking Paper 8586http://www.nber.org/papers/w8586NATIONAL BUREAU OF ECONOMIC RESEARCH1050 Massachusetts AvenueCambridge, MA 02138November 2001The Bradley Policy Research Center, William E. Simon Graduate School of Business Administration,University of Rochester, provided support for this research. We are indebted to Jay Ritter for the use of hisdata. We received helpful suggestions from Harry DeAngelo, Craig Dunbar, B. Espen Eckbo, Jean Helwege,Tim Loughran, Alexander Ljungqvist, Vojislav Maksimovic, Jay Ritter, Jerold Warner, Ivo Welch, JeroldZimmerman, and seminar participants at the University of Rochester. The views expressed herein are thoseof the authors and not necessarily those of the National Bureau of Economic Research. 2001 by Michelle Lowry and G. William Schwert. All rights reserved. Short sections of text, not toexceed two paragraphs, may be quoted without explicit permission provided that full credit, including notice, is given to the source.
Biases in the IPO Pricing ProcessMichelle Lowry and G. William SchwertNBER Working Paper No. 8586November 2001JEL No. G32, G24, G14ABSTRACTBy investigating the entire IPO pricing process, beginning when the offering is filed, the papercontributes to the existing literature along four dimensions. First, price updates during the registrationperiod are predictable based on firm and offer-specific characteristics known at the time the offer is filed.Second, price updates reflect market movements prior to the initial filing date as well as during theregistration period. Third, positive and negative information learned during the registration period affectthe offer price asymmetrically. Finally, public and private information learned during the registrationperiod have different effects on the offer price. While a number of the biases that we uncover areconsistent with one or more theories regarding IPOs, many remain a puzzle.Michelle LowrySmeal College of BusinessPenn State UniversityUniversity Park, PA 16802mlowry@psu.eduG. William SchwertSimon School of BusinessUniversity of RochesterRochester, NY 14627and NBERschwert@schwert.ssb.rochester.edu
Lowry & Schwert, Biases in IPO Pricing1.IntroductionThe pricing of Initial Public Offerings (IPOs) is one of the more puzzling phenomena infinance. Prior empirical evidence shows that underwriters do not fully incorporate all availableinformation into the IPO offer price in an unbiased way. The first day returns of IPOs averageapproximately 15%, indicating that there is a systematic downward bias in the offer pricecompared with the price in the secondary trading market. Further, the size of these initial returnsvaries predictably across firms. Prior literature has found that initial returns are significantlyrelated to certain firm- and offer-specific characteristics, to the price update between theexpected offer price stated in the preliminary prospectus and the final offer price, and to marketreturns before the IPO.The process of pricing an IPO generally begins months before the offer price is set. Yetthe majority of the existing IPO pricing literature has only focused on price changes between theoffer price and the secondary market price. The objective of this paper is to examine the entireIPO pricing process, beginning at the time the issue is filed.By including more of theinformation that potentially contributes to the pricing of new issues, we hope to increase ourunderstanding of the apparent biases in IPO pricing.Several theories have been advanced to explain the predictability in initial returns, and wewish to see whether these theories can explain the dynamics of the entire IPO pricing process.We focus on two of the more popular theories of IPO underpricing. First, Beatty and Ritter(1986), Rock (1986), and Baron (1982) assert that underpricing results from informationasymmetry between the various parties involved in the IPO. Issues that are characterized bygreater uncertainty are more underpriced to compensate for the higher costs of learning about1
Lowry & Schwert, Biases in IPO Pricingthese firms’ true values. Many papers, including Beatty and Ritter (1986), Megginson and Weiss(1991), and Koh and Walter (1989), find empirical support for the importance of informationasymmetry as a determinant of underpricing.Second, Benveniste and Spindt (1989) posit thatunderpricing is related to the information underwriters obtain from informed investors during theregistration period. Underwriters compensate these investors for the information they provide byonly partially incorporating it into the offer price, thus allowing the informed investors to earnespecially high returns on the first day the IPO firm trades.Consistent with this theory,Lundqvist and Wilhelm (2001) find that institutions who reveal more valuable informationduring the registration period are rewarded with higher allocations when such information ispositive.Also, Cornelli and Goldreich (2001) and Hanley (1993) show that this privateinformation learned during the registration period is only partially incorporated into the offerprice.In examining the entire IPO pricing process, our empirical analysis builds on prior workalong four dimensions.While some of our findings are understandable based on existingtheories, others remain a puzzle.We begin our analysis of the IPO pricing process at the time the offering is filed. To filean IPO, the company must register with the Securities and Exchange Commission (SEC) apreliminary prospectus containing basic information on the company and the proposed offering.Either in this preliminary prospectus or in an amended prospectus, the company provides a rangeof prices within which it expects to price the issue. The percent difference between the midpointof this preliminary price range and the final offer price represents the price update. We find thatthe price update is significantly related to information that is publicly available when the IPO isfiled, such as the underwriter rank, the industry of the IPO firm, and the exchange on which the2
Lowry & Schwert, Biases in IPO Pricingstock will be listed. It seems that firm- and offer-specific characteristics can explain the priceupdate in much the same way that they explain the initial return. While the ability of suchvariables to explain the initial return has been generally interpreted as supporting the informationasymmetry hypothesis, it is difficult to reconcile their ability to explain the price update with thesame theory. In fact, this puzzling relation between the price update and firm- and offer-specificcharacteristics does not seem consistent with the existing theories of IPO pricing. Our findingssuggest that underwriters do not incorporate all available information when setting the range ofexpected offer prices.Second, we examine the relation between the price update and general movements inmarket prices. For a sample of IPOs, we collect the date of the first prospectus containing therange of expected offer prices. Conceptually, the price update should be related to informationthat becomes available between the release of this prospectus and the setting of the final offerprice, typically the day before the offering. Thus, we expect market returns over this period to bemost strongly related to the price update. Consistent with Loughran and Ritter (2000), we findthat companies and their underwriters do adjust the offer price in response to recent marketmovements. However, we find that market returns over fixed intervals before the IPO havehigher explanatory power than those that are linked to the time between the initial revelation ofthe expected price range and the offer date. Specifically, our results show that market returnsover the three months before the offer are reliably related to the price update. We note that thisis a substantially longer period of time than the three weeks over which Loughran and Rittermeasure market returns. Further, given that the registration period averages only two months,these findings raise further questions about how companies and their investment bankers set therange of expected offer prices that is stated in the preliminary or amended prospectus. The3
Lowry & Schwert, Biases in IPO Pricingexisting theories of IPO pricing do not seem to provide an adequate explanation for thisphenomenon.Third, we allow for the possibility that positive information learned during theregistration period is not incorporated into the pricing of an IPO in the same manner as negativeinformation. Benveniste and Spindt’s (1989) partial updating theory asserts that underwritersonly partially incorporate positive information they receive regarding firm value into the offerprice, thus providing compensation (in the form of higher initial returns) to the investors whoprovided them with this information. However, both underwriters and investors should want toavoid losses on overpriced issues, suggesting that negative information should be fullyincorporated into the offer price. Consistent with this intuition, our empirical analysis showssignificant differences in the effects of positive versus negative information on the pricing ofIPOs. Investment bankers appear to incorporate negative information more fully into the offerprice than positive information.Finally, we compare the effects of public versus private information learned during theregistration period on the pricing of an IPO. Loughran and Ritter note that under Benveniste andSpindt’s partial updating theory, private information should be only partially incorporated intothe offer price, but public information should be fully incorporated. Following Loughran andRitter, we use market returns to proxy for public information.consistent with Benveniste and Spindt’s theory.Our results are generallyWe find that public information is fullyincorporated into the offer price, but private information is only partially incorporated. Asdiscussed in more detail later, this finding contrasts with the findings of Loughran and Ritter(2000) and to some extent those of Benveniste, Wilhelm and Yu (2000).4
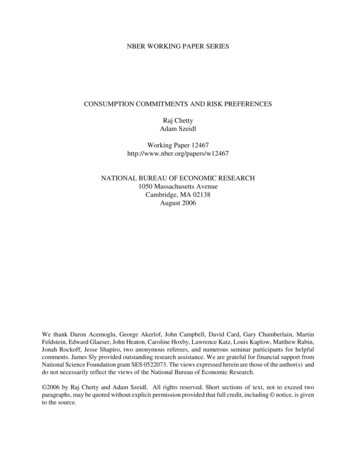
Lowry & Schwert, Biases in IPO PricingIn summary, our results on the predictability of the price update, the asymmetry ofpositive versus negative information, and the extent to which public versus private information isincorporated into the offer price provide new evidence on the complexity of the IPO pricingprocess. While our results do not ‘reject’ any of the existing theories of IPO pricing, they showthat no single existing theory comes close to explaining the numerous biases that exist.Section 2 discusses the data that we use to examine the price updates and initial returns.Sections 3 and 4 investigate the predictability of the price update and the initial return,respectively. In section 5 we conduct various robustness tests. Section 6 summarizes the resultsof the paper.2.DataTo examine the biases in the pricing of IPOs, we obtain data on all firms that went publicbetween 1985 and 1999 from the Securities Data Corporation (SDC). Unit IPOs, closed endfunds, real estate investment trusts (REITs), and American Depositary Receipts (ADRs) areexcluded. Section 2.1 defines our IPO pricing measures as well as the explanatory variables thatwe use in our empirical tests. Section 2.2 investigates the issue of sample selection, whichpotentially affects our empirical analysis.[Price Update, P]Preliminary Price RangeIs Set[Initial Return, IR]Offer Price Is Setand IPO OccursPost-IPO Price is observedin the Secondary MarketFig. 1. Time-line for the IPO Pricing Process5
Lowry & Schwert, Biases in IPO Pricing2.1. SDC Data on Individual IPOsThe pricing of an IPO can be thought of as occurring in three stages, as illustrated infigure 1. First, the firm and its underwriters agree on a range of prices within which they expectto set the offer price. This price range is listed in a prospectus that is filed with the SEC. Somecompanies include this price range in the preliminary prospectus that is filed when the offering isregistered, while other companies set the price range in an amended registration statement that isfiled between the initial registration date and the IPO date. Data on the original registration datesare available on SDC, but Loughran and Ritter (2000) emphasize that there are often amendedfilings after the original registration statement that do not appear in the SDC database. Weinvestigate the exact timing of the first available pricing information using data from the SECElectronic Data Gathering, Analysis, and Retrieval system (EDGAR) in 1996-97. Second,typically the day before the offering, the company and its underwriters set the final offer price.This is the price at which the issue is offered to the public. Finally, when the issue starts tradingwe observe the market’s assessment of the value of this firm.For each IPO, the price update ( P) equals the percentage change between the midpointof the filing range and the offer price. The initial return (IR) equals the percentage changebetween the offer price and the first closing price. To determine the first closing price of aparticular issue, the first closing price from the Center for Research in Securities Prices (CRSP)is used if price data are available within 14 days of the offer date. If CRSP data are notavailable, we try to obtain the closing price on the first day of trading from SDC. If that is notavailable, the close on the second day or otherwise the end of the first week of trading is used.We examine the predictability of both the firm-level price update and initial return, basedon a number of firm- and deal-specific characteristics.6For each firm, we identify the
Lowry & Schwert, Biases in IPO Pricingunderwriter from SDC and assign an underwriter rank (RANK) based on the Carter, Dark, andSingh (1998) measures. The ranks range from 0 to 9, with higher numbers representing higherquality underwriters. Underwriters that are not included in this classification are assigned a rankof 0. Using the SDC classification system, we also assign each firm a technology dummy(TECH), equal to 1 if the firm is in a technology industry and 0 otherwise. To capture the effectsof firm size, we collect data on total assets before the offering (TA) and number of shares filed(SHRS) from SDC, both of which are transformed using logarithms to reduce the skewness inthese data. In addition, TA is transformed into 1983-dollar values using the Consumer PriceIndex (CPI) to adjust for the effects of inflation. We form three exchange dummies, NYSE,NMS, and AMEX, where each dummy equals 1 if the IPO was listed on that market, and 0otherwise.Many researchers have noted that IPO pricing is affected by the risk of the issuing firm.This is not generally measurable at the time of the IPO, although investors and underwritersclearly form opinions about this important attribute when setting the IPO price. We follow thetradition in the literature of proxying for the ex ante risk of the IPO stock using volatility of theIPO stock return in the secondary trading market. VOL is the market-adjusted volatility of theIPO stock return, equal to the standard deviation of daily returns to the IPO stock in trading days22 through 63 after the IPO (the second and third months of secondary market trading, skippingthe first month to avoid the effects of price supports, if any) minus the standard deviation of dailyreturns to the CRSP equal-weighted market portfolio of NYSE, Amex, and Nasdaq stocks duringthe same period.11We also use a measure of after-market volatility based on trading days 1 through 63 after the IPO and the resultsare similar.7
Lowry & Schwert, Biases in IPO PricingLoughran and Ritter (2000) analyze the reaction of the price update to public informationthat becomes available during the registration period as reflected in the return to the CRSP valueweighted portfolio over the 15 days before the IPO. Because IPO stocks tend to be small, we usethe CRSP equal-weighted return to measure the public information that becomes available duringthe registration period. Also, in section 3.2 we measure market returns over several timeintervals to see how current and past market movements affect IPO prices.To investigate the possibility that positive and negative information learned during theregistration period affect the offer price differently, we define two asymmetry measures. First, P equals P when the price update is positive, and zero otherwise. Similarly, MKT equalsMKT when the market returns during the registration period are positive, and zero otherwise.Thus, in our cross-sectional regression models, the coefficients on these variables measure thedifferences between the effects of positive versus negative information, if any.We focus on data from 1985-97 in our tests because there is evidence that the IPOs in1998 and 1999 had substantially different behavior. The effects of limiting our sample period inthis manner are investigated in detail in section 5.2.2. Sample Selection BiasThe goal of this analysis is to explain the IPO pricing process. How do IPO prices getupdated between the initial prospectus and the final IPO, and how does the after-market price ofthe stock relate to the IPO offer price? The tests control for the characteristics of the IPO firmsand of the transactions. The regression models, however, require full data on the explanatoryvariables. The data sources (SDC and CRSP) do not have complete information on all of thevariables for many firms.8
Lowry & Schwert, Biases in IPO PricingTable 1 shows a comparison of means between the sample with full data available for allof the variables listed above (referred to as the regression sample) in column (1) and the meansof these variables for the observations that are omitted from the regression sample because theyhave data missing for at least one other variable (referred to as the incomplete data sample) incolumn (2). This shows the nature of the sample selection bias associated with the regressiontests in tables 2, 6, 7, and 8. Column (3) of table 1 shows t-statistics that test whether the meansare equal in the regression sample and in the incomplete data sample, based onheteroskedasticity-consistent standard errors, and column (4) shows the number of observationsin the incomplete data sample.We find that the characteristics of the regression sample firms differ significantly fromthe missing-data firms along several dimensions. For example, firms in the regression samplestate in the prospectus that they plan to issue an average of 2.2 million ( exp(14.587)) shares.In comparison, the average for firms that are not in the regression sample (because they aremissing data for at least one of the other variables) is 2.4 million ( exp(14.678)) shares. Thus,firms in the regression sample tend to file fewer shares (t-statistic -2.82). Firms in theregression sample also have higher after-market volatility (t-statistic 3.84), are less likely toissue on the NYSE (t-statistic -6.07), more likely to issue on NMS (t-statistic 5.94), and havehigher market returns in the registration period (t-statistics of 2.19 and 2.12 on MKT and MKT ),on average.Finally, the price update when it is positive, P , and the initial return aresignificantly larger for the regression sample (t-statistics of 2.91 and 2.05).Columns (5) and (6) of table 1 show the percent of IPOs that occur in each year from1985 through 1997 for each sample, and column (7) shows the heteroskedasticity-consistent tstatistics for the differences between the proportions in each sample by year. A large proportion9
Lowry & Schwert, Biases in IPO Pricing(39%) of the regression sample occurs in the years 1995-97, and a large proportion (49%) of theincomplete data sample occurs in the years 1985-91.This likely reflects changes in thethoroughness with which SDC has collected data on IPOs over time. Some of the differences incharacteristics in columns (1) and (2) are probably related to the calendar patterns seen incolumns (5) and (6). For example, the greater proportion of technology firms in the regressionsample is probably related to the fact that data from recent years are more likely to be in theregression sample, and there were a lot of technology-related IPOs from 1995-97.The most important message to get from table 1 is that the firms with missing orincomplete data are not random. Thus, at a minimum, we must be cautious in interpreting ourregression results to realize that they may not be representative of the firms with incomplete data.3.Predictability of Price UpdatesThe pricing of an IPO begins at the time the IPO is filed, and thus we begin our analysisof the pricing process at this point. This section examines whether underwriters fully incorporateavailable information into the expected offer price.3.1. Predictable Bias in the Price Update at the Filing DateThe first thing to note about the price update is that the average price update is negative(-2.800 in table 1) and a simple t-test for whether this is reliably different from 0 equals –9.17.Thus, on average the IPO price is about 2.8% below the mid-point of the initial filing range.Table 2 examines the extent to which underwriters incorporate available informationabout the company at the time they set the initial filing range. Column (1) of table 2 containsestimates of a regression model that explains the price update that occurs between the date of thefirst prospectus with pricing information and the offer date, conditional on information that is10
Lowry & Schwert, Biases in IPO Pricingpublicly known at the time the offering is filed, Pi α β1 RANKi β2 TECHi β3 TAi β4 SHRSi β5 NYSEi β6 NMSi β7 AMEXi εi,(1)where the variables have been defined above.We find that many of these predetermined variables predict the IPO price update. Forexample, IPOs underwritten by highly ranked investment bankers are likely to have larger priceupdates (t-statistic of 4.57 in column (2)). Technology firms also tend to have larger priceupdates (t-statistic of 3.56). On the other hand, holding other things constant, firms that arelarger are likely to have smaller price updates (t-statistic of –3.03 on total assets). Finally, theexchange the offering lists on is also significantly related to the price update. Specifically, firmsthat list on NYSE and NMS tend to have larger price updates (t-statistics of 3.90 and 2.34), whilefirms that list on AMEX have smaller price updates on average (t-statistic of –2.90).2The regression in column (1) pools IPO price updates across the 1985-97 period, but tothe extent that there are known cycles in the IPO market (see, for example, Ibbotson, Ritter, andSindelar (1988, 1994) and Lowry and Schwert (2001)), it is likely that the regression errors forfirms with IPOs close together in time are correlated. One simple way to check the severity ofthis problem is to use a bootstrap estimator similar to Fama and MacBeth (1973). Column (3) intable 2 shows the average of the estimates of the coefficients in (1) when they are estimated yearby-year from 1985-97. Each t-statistic in column (4) is based on the standard deviation of thetime-series of estimates.The Fama-MacBeth estimates and tests in columns (3) and (4)generally support the regression estimates in columns (1) and (2). The estimate of the NMS2Habib and Ljungqvist (2001) argue that the selection of underwriters by firms biases the coefficient estimates ofunderwriter rank in regressions that explain initial returns to IPOs. To the extent that firms also choose where to listtheir stock following the IPO, similar self-selection biases could occur. They did not analyze price updates.11
Lowry & Schwert, Biases in IPO Pricinglisting variable changes sign, suggesting that this effect is not stable across the sample, but this isthe only substantial difference between the pooled and Fama-MacBeth results.The estimates in the right panel of table 2, columns (5) through (8), add the after-marketvolatility VOL to these regressions. Although this variable is not measurable by econometriciansat the time of the IPO, it is likely that investors and investment bankers have at least an intuitiveknowledge of this volatility when evaluating IPO pricing. The coefficient on volatility is reliablynegative in both the pooled regression and in the Fama-MacBeth estimates, implying that priceupdates are smaller or more negative for riskier firms. Coefficients on other variables aresubstantially unchanged.These results imply that there is a predictable bias in the adjustment from the initial filerange to the final IPO price. The explanatory power of these regressions is low (between 2% and4%), because there is a lot of uncertainty about the IPO price at the time that the initial filingrange is set. However, there are systematic patterns in price updates that are significantly relatedto the characteristics of the issuing firm, the offering, and the underwriter.The literature on IPO pricing has often used variables such as those in table 2 to explaininitial IPO returns as a test of theories about asymmetric information. However, it is not clear tous how these theories would predict any particular pattern in price updates. It seems thatcompanies and their underwriters do not incorporate all available information when setting therange of expected offer prices. Consequently, certain types of IPOs tend to have larger priceupdates than others.To assess the economic significance of these relations, we allow each explanatoryvariable to vary by one standard deviation and calculate the consequent effect on the priceupdate. Rank, tech, and volatility have the largest effect on the size of the price update. A one12
Lowry & Schwert, Biases in IPO Pricingstandard deviation change in each of these variables is associated with approximately a 0.1standard deviation change in the price update, i.e. approximately 1.7%. While the total effect onthe price update obviously depends on the correlation between the independent variables, thissimple calculation suggests that the economic significance of these relations is relatively low. Inother words, there is a lot of variability in the price update that is unrelated to the regressionmodel.Thus, the results indicate that the price update is predictable based on information that ispublicly available at the time the offering is filed. It is important to note, however, that investorscannot buy in at the expected offer price, so the predictability of the price update does notrepresent a profit opportunity, nor is it a cost for the issuing firm. In addition, these relations arenot highly significant in economic terms.3.2. Price Updates and Market ReturnsAs noted earlier, Loughran and Ritter (2000) analyze the relation between price updatesand the 15-day return to the CRSP value-weighted portfolio, and they find that the price updateis significantly related to the market return. We examine this relation in more depth to betterunderstand how public information that becomes available prior to the IPO affects the final offerprice.To investigate the relation between price updates and contemporaneous market returns,we use several measures of market returns during the registration period, and in some casesbefore the initial registration date. The variable shown in table 1, MKT, is the CRSP equalweighted return between the initial registration date and the day before the IPO. For 554 of thefirms that went public in 1996 and 1997, we obtained the date of the first prospectus thatincluded the initial filing range of prices from EDGAR. In about 60% of the cases, the initial13
Lowry & Schwert, Biases in IPO Pricingprospectus included the file range, while for the remaining 40% of cases the first pricinginformation was released later in an amended prospectus. Across all cases, the average numberof trading days between the first price range and the IPO was 44 days, or about 75% of the entireregistration period. For these 554 firms, we measure the CRSP equal-weighted market returnbetween the date of the first prospectus with pricing information and the day before the IPO,MKTMATCH.Another approach to measuring the effect of market movements on IPO pricing is tomeasure market returns over a fraction of the entire registration period (file date to day beforeoffer). In particular, we use intervals equal to 25%, 50%, and 75% of the registration period.Because these measures do not rely on the exact date on which the price range became available,they can be calculated for our entire sample. For each interval we measure market returnsending on the day before the IPO and moving backwards the requisite number of days to coverthese proportions of the registration period, where our measure MKT covers 100% of theregistration period.The measures MKT25%, MKT50%, and MKT75% should reflectinformation about market valuations that occur in the latter parts of the registration period, justbefore the IPO price is set.Panel A of table 3 shows regressions of the price update ( Pi) on market returns over theperiod between the first pricing information and the setting of the IPO price (MKTMATCH). Italso shows regressions of the price update on market returns over fractions of the entireregistration period, MKT25%, MKT50%, MKT75%, and MKT for the sample of firms for whichwe have information from EDGAR. Interestingly, the estimates of β are similar across allmeasures of market return that are linked to the entire registration period, MKT25% to MKT.The coefficient estimates on all of these variables are approximately 0.45. While the t-statistics14
Lowry & Schwert, Biases in IPO Pricingand R2’s increase as the intervals increase, this is somewhat mechanical. Note that the dependentvariable is the same across all these regressions and the slope estimat
The Bradley Policy Research Center, William E. Simon Graduate School of Business Administration, University of Rochester, provided support for this research. We are indebted to Jay Ritter for the use of his . Smeal College of Business Simon School of Business Penn State University University of Rochester University Park, PA 16802 Rochester .