Transcription
Water-Resources Investigations Report 91-4011EFFECTS OF SEPTIC-TANKEFFLUENT ON GROUND-WATERQUALITY IN NORTHERNWILLIAMSONCOUNTY ANDSOUTHERN DAVIDSON COUNTY,TENNESSEEPrepared by theU.S. GEOLOGICAL SURVEYin cooperation with theTENNESSEE DEPARTMENT OF ENVIRONMENT AND CONSERVATION,DIVISION OF WATER POLLUTION CONTROLClick here to return to USGS Publications
EFFECTS OF SEPTIC-TANK EFFLUENTON GROUND-WATER QUALITY INNORTHERN WILLIAMSON COUNTYAND SOUTHERN DAVIDSON COUNTY,TENNESSEEBy DorotheaWithin&onHancharU.S. GEOLOGICAL SURVEYWater-Resources Investigations Report 91-4011Prepared in cooperation with theTENNESSEE DEPARTMENT OF ENVIRONMENT AND CONSERVATION,DMSION OF WATER POLLUTION CONTROLNashville, Tennessee1991
U.S. DEPARTMENT OF THE INTERIORMANUEL LUJAN, JR., SecretaryU.S. GEOLOGICAL SURVEYDallas L. Peck, Director.For additional informationwrite to:District ChiefU.S. Geological Survey810 Broadway, Suite 500Nashville, Tennessee37203Copies of this report can be purchased from:U.S. Geological SurveyBooks and Open-File Reports SectionFederal Center, Building 810Box 25425Denver, Colorado 80225
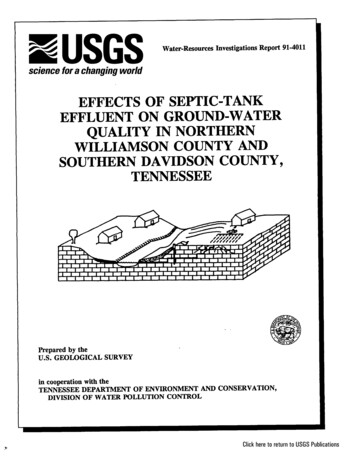
CONTENTSAbstract1Introduction1Purpose and scope 2Acknowledgments2Septic-tank systems 2Geohydrology of the study area 3Well construction6Data collection and analysis 7Effects of septic-tank effluent on ground-water qualityMajor inorganic constituents9Nutrients9Organic substances 13Optical brighteners13Bacteria14Summary and conclusions 14References cited159ILLUSTRATIONSFigure 1. Map showing location of observation wells,springs, and surface-water sampling sites inWilliamson County42. Map showing location of domestic well and spring inDavidson County53. Stratigraphic column of wells Wm:O-13 and Wm:O-158TABLESTable 1. Well construction, yield, and water-level data for observationand domestic wells in the study area72. Water-quality analyses10.111
CONVERSION FACTORS AND VERTICAL DATUMMultiplyacrefoot (ft)gallon per minute (gal/min)pound (lb)square mile (mi2)inch (in.)mile (mi)BYTo are kilometermeterliter per secondkilogramsquare kilometermillimeterkilometerT’emperature in degrees Celsius (“C) may be converted to degrees Fahrenheit (“F) asfollows:“F 1.8 * “C 32Sea level: In this report “sea level” refers to the National Geodetic Vertical Datum of 1929(NGVD of 1929)--a geodetic datum derived from a general adjustment of the first-orderlevel nets of both the United States and Canada, formerly called Sea Level Datum of 1929.iv
EFFECTS OF SEPTIC-TANK EFFLUENT ONGROUND-WATER QUALITYIN NORTHERN WILLIAMSON COUNTYAND SOUTHERN DAVIDSON COUNTY,TENNESSEEBy Dorothea Withington Hancharsampled during 1988. Water from one of thesesprings contained optical brighteners, whichindicates that septic-tank efluent is affectingground-water quality.ABSTRACTthe potentialinvestigationofAncontamination of ground water from septic tanksystems blasted in bedrock in Williamson andDavidson Counties, Tennessee, was conductedduring 1988-89. Water samples were collectedfrom domestic and observation wells, springs,and St.&ace-water sites in a residentialsubdivision in the northern part of WilliamsonCounty near Nashville. The subdivision has ahigh density of septic-tank field lines installedinto blasted bedrock Water samples also werecollected from a well located in an area ofDavidson County where field lines were installedin 5 feet of soil. Samples were analyzed formajor inorganic constituents, nutrients, totalorganic carbon, optical brighteners, andbacteria. Although results of analyses of watersamples from wells indicate no e@ectof septictank efluent on ground-water quality at thesetwo springs locatedsites, water fromdowngradient from the subdivision had slightlylarger concentrations of nitrite plus nitrate (2.2and 2.7 milligrams per liter N), and much largerconcentrations of fecal colifonn and fecalstreptococci bacteria (2,000 to 3,200 and 700 to900 colonies per 100 milliliters of sample,respectively), than other wells and springs ‘Tennessee Department.of EnvironmentINTRODUCTIONSubsurface sewage disposal systems arethe largest sources of wastewater to theground, and are the most frequently reportedcauses of ground-water contamination (Miller,1980, p. 186). The likelihood of ground-watercontamination by these systems is greatestwhere septic systems are closely spaced as insubdivided tracts in suburban areas and inareas where the bedrock is covered by little orno soil. In the ‘rocky terrain of MiddleTennessee, the field lines of as many as20 percent of the domestic septic systems areinstalled in blasted bedrock with virtually nosoil (Brent Ogles, Tennessee Department ofHealth and Environment, Division of GroundWater Protection, oral commun., 1987).Concern about the effects of these domesticseptic systems on ground-waterqualityprompted the U.S. Geological Survey, incooperation with the Tennessee Departmentof Health and Environment (TDHE)‘,- -and Conservation (TDEC) as of 1991.1
area where field lines were installed in blastedbedrock, although, for comparison, one wellwas in an area where field lines were installedin soil averaging about 5 feet in thickness.Water from the four springs also was sampledin April 1989 and analyzed for opticalbrighteners to determine if the springs and thesubsurface sewage-disposal systems arehydraulically connected.Division of Water Pollution Control, to initiatein 1988 an investigation of the occurrence ofseptic-tank effluent in ground water and theeffects of any effluent present onground-water quality. The study area, innorthern Williamson County and southernDavidson County, was selected because mostof the septic systems in this area have fieldlines installed in blasted bedrock.AcknowledgmentsPurpose and ScopeThe author thanks Mr. Larry Robinson,Environmental Specialist for WilliamsonCounty; Mr. Brent Ogles, EnvironmentalManager, TDHE, Division of Ground WaterProtection; Mr. Tom Petty, EnvironmentalSpecialist for WilsonCounty;andMr. Christopher Andel, Ms. Karen Grubbs,and Dr. Andrew Barrass of the NonpointSource Program, Tennessee Department ofHealth and Environment, Division of WaterPollution Control, for their assistance. Also,the author thanks the many homeowners whoallowed accessto their land.This report presents the results of thestudy of ground-water quality in areas ofseptic tanks in northern Williamson Countyand southern Davidson County. The purposeof the study was to:1. Determine if a hydraulic connectionexistsbetween septic-tank systemsandthe ground-water system and, if so,2. Determinethe potentialforoccurrence or existence of groundwater contamination by septic-systemeffluent.The study included the collection of watersamples from springs, observation wells, anddomestic wells in Williamson and DavidsonCounties for analysis of water-qualityObservation wells werecharacteristics.installed in an area where field lines for septicsystems were installed in blasted bedrock.These wells were completed in both theshallow and deep water-bearing zonesupgradient from ground-water-dischargepoints. Samples were collected from thesewells and springs in May 1988, November1988, and May 1989 to coincide with dry(May) and rainy (November) conditions.Water samples were analyzed for bacteria,nutrients, major inorganic constituents,specific conductance, pH, temperature, andtotal organic carbon, and, in May 1988, forconcentrations of organic constituents. Mostof the water samples were from wells in anSEPTIC-TANKSYSTEMSA typical septic-tank system consists oftwo parts, the tank itself and field linesinstalled into an absorption field. If the tankis properly constructed, only wastewater willflow through the field lines. Field linesgenerally are installed in trenches dug intosoils having a minimum thickness of 3 feet,where the bottom of the trench is underlainby at least 2 feet of soil above the water tableor creviced bedrock. Where rock crops out atthe surface, common practice in Tennesseeuntil June 1990 was to install field lines intrenches blasted in the bedrock andback-filled with gravel. In Middle Tennessee,limestone formations commonly crop out atland surface with little or no soil cover.2
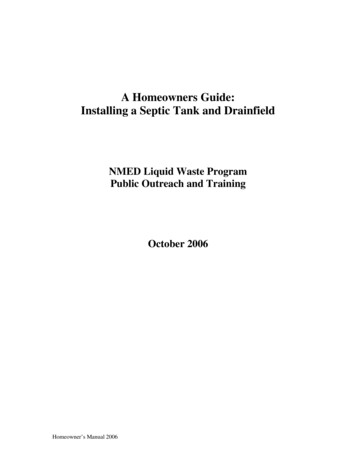
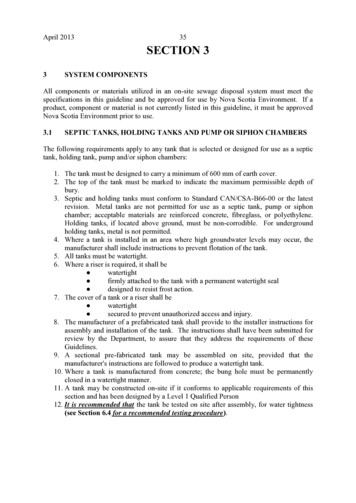
Ground water in the carbonate rocks ofMiddle Tennessee typically flows throughsolution openings that have developed alongbedding planes, fractures, and joints (Hollydayand Goddard, 1979). Blasting near-surfacebedrock to install field lines can createfractures in the limestone that hydraulicallyconnect to an existing solution opening. Ifthis occurs, the fracture can provide a conduitfrom the field lines to the ground-waterreservoir.Domestic septic-tank effluent typicallycontains elevated concentrations of chloride,sulfate, nitrite plus nitrate, ammonia, organicnitrogen, total nitrogen, total phosphate, fecalcoliform and fecal streptococci bacteria, andtotal organic carbon (TOC) (Canter andKnox, 1985). Concentrations of nitrite plusnitrate as nitrogen (N) greater than3 mg/L (milligrams per liter) generallyindicate influence of human activity (Madisonand Burnett, 1985). Elevated concentrationsof chloride, ammonia, and sulfate also havebeen interpreted to be the result ofseptic-tank effluent (Waller and others, 1987;Pitt and others, 1975). Effluent migration hasbeen monitored, both vertically and laterally,using variations in concentrations of theseconstituents (Waller and others, 1987). All ofthese constituents, however, are commonlyfound in ground water (Aley, 1985). As aresult, unless elevated concentrations arepresent, one cannot confidently determinewhether a system has been affected by sewage(Aley, 1985).Common components of septic-tankeffluent that are not naturally present inground water are fluorescent white dyes usedas optical brighteners in laundry soap andThe occurrence of opticaldetergents.brighteners in ground water downgradientfrom septic-tank field lines is an indicator ofthe presence of septic-tank effluent. Thisindicator is particularly effective in karst areas(Mull and others, 1988; Wilson and others,1988).GEOHYDROLOGYOF THE STUDYAREAThe study area includes two sites, onewith a high density of septic-system field linesinstalled in blasted bedrock and another withfield lines installed in soils averaging about5 feet in thickness. The first site is innorthern Williamson County (fig. 1) andincludes a subdivision where septic systemshave a high rate of failure both to the surfaceand to the ground (Larry Robinson,Williamson County, oral commun., 1987).Most runoff from the site drains to a central, sinkhole, which in turn is drained by a ditchblasted in bedrock (fig. 1). The site isunderlain by limestone that is capable ofyielding small quantities of water to wells inthe area.Three springs lie downgradient of theseptic systems,Wm:O-9 and Wm:O-11, whichflow year round, and Wm:O-10, which flowsonly after periods of sustained rain (fig. 1).Springs Wm:O-9 and Wm:O-11, therefore,discharge water from the water-table aquifer.Discharge of all three springs generally is lessthan about 2 gallons per minute.The second sampling site is located insouthern Davidson County (fig. 2) about7 miles northwest of the first site. This site isin an older neighborhood, where septicsystems have been in use for as long as75 years. Septic-system field lines at this siteare installed in soil which generally is 3 toThe soil is underlain by5 feet thick.limestone which is capable of yielding smallquantities of water to wells in the area.A small spring, Dv:F-2 (fig. 2) lies about700 feet to the southeast of residential areasusing septic systems. The spring flows yearround and has a discharge of less than3 gallons per minute.
86’42’36O 00 ’30”86’40TENNESSEE0I0‘STUDYAREAIaQ-. . .A6Figure1 MILEIWm:v4OBSERVATION WELL AND NUMBERWm%8DOMESTIC WELL AND NUMBERWm:OQ;17 DRY HOLE AND NUMBERWm:O- 100-vSURFACE-WATER SAMPLING SITEAND NUMBERLocationI1 KILOMETEREXPLANATIONGENERALIZED nINTERMITTENT STREAMl.--I0.50.5I’SPRING AND NUMBERof observationwells, springs,andsites in WilliamsonCounty.4surface-watersampling
86’ 45 ’ 28”86’ 46’ 54”0I013,0002,0001,000II 1’ 1 ’ I600 METERS200400FEETEXPLANATIONa-.ADv:F- 1aDv:F-2gFigure2.--GENERALIZED SUBDIVISIONAREAINTERMITTENT STREAMDOMESTIC WELL AND NUMBERSPRING AND NUMBERof domesticwellLocationin DavidsonCounty.5andspring
The Williamson County site overlieslimestone with little soil coverage. Theformations underlying the site are, indescending order, the Hermitage Formation,the Carters Limestone, the LebanonLimestone, and the Ridley Limestone, all ofOrdovician age. The Hermitage Formationcaps the hills.This formation is athin-bedded, silty limestone and acts as aconfining unit. Field lines completed withinthe Hermitage Formation are more likely tofail to the surface than to the subsurfacebecause of the high clay content of thisformation.Lower lying parts of thesubdivision are underlain by CartersLimestone, which is a blocky micriticlimestone and is a probable aquifer. Fieldlines completed within the Carters Limestoneare more likely to fail to the subsurface thanto the surface because of the potentialoccurrence of open fractures and solutionopenings.WELL CONSTRUCTIONSix observation wells were drilled at theWilliamson County site (fig. 1) using theair-rotary method. Depths of these wellsrange from 65 to 185 feet below land surface(table 1). Six-inch diameter galvanized steelcasing was set at least 20 feet into bedrock.The rest of the well was completed in rock,and left as open bore. A seal of bentonitepellets was installed in the well annulus at thebase of the casing to a thickness of at least1 foot, and the well annulus at the surface wassealed to a depth of 1 foot using cementgrout. Of the six observation wells drilled,two were dry (Wm:O-16 and Wm:O-17), threehad estimated yields of less than 1 gallon perminute (Wm:O-12, Wm:O-13, Wm:O-14), andone (Wm:O-15) had an estimated yield of15 gallons per minute.All yields weremeasured by discharging water through aflume during the development of the well.The Lebanon Limestone acts as aconfining unit, but the Ridley Limestone, alsoa blocky micritic limestone, is an aquifer. Thetwo domestic wells in the area are completedin the Ridley Limestone.A majorwater-bearing zone has been identified at thecontact between the Lebanon Limestone andthe Ridley Limestone at a depth between 130and 145 feet below land surface.Two wells at this site were completed inthe shallow water-bearing zone, and two wellswere completed in the deep water-bearingzone. The shallow water-bearing zone occursat or near the contact between the CartersLimestone and the Lebanon Limestone at adepth that ranges between 25 and 30 feetbelow land surface. Wells completed in thisshallow zone are Wm:O-12 and Wm:O-14(table 1). The deep water-bearing zoneoccurs at or near the contact between theLebanon Limestone and the RidleyLimestone, which occurs between 125 and145 feet below land surface. Well Wm:O-15was completed in this deeper zone (table l),and well Wm:O-13 was completed within theRidley Limestone (fig. 3).The Davidson County site overlies theBigby-CannonLimestone2, which hasweathered into a relatively thick soil. Thisformation is a soluble, silt-free limestone.The Bigby-Cannon Limestone overlies theHermitage Formation. The spring (Dv:F-2)occurs at the contact between these twoformations.*Unit follows usage of Tennessee Division of Geology.6
Table I.--Well construction, yield, and water level data for observation and domesticwells in the study area[0, observation well; D, domestic well; C/L CartersLimestone/Lebanon Limestone; L/R Lebanon LimestoneRidleyLimestone; *, none; **, well was dry at time of measurement;--, not measured; c, less than]Casing.Water level,May 8, 1989, infeet below landsurfaceWellnumberTypeofwelldepth, infeet :F-1D--L/Ra2oo----Well depth,in feet belowland surfacelYield,in gallonsper minuteaApproximate depth.Well Wm:O-16 terminated in theLebanon Limestone, and well Wm:O-17terminated in the Ridley Limestone. Neitherwell intercepted a water-bearing zone, and asof May 1989, both were dry.Site 2 is on the drainage ditch blasted into thebedrock to drain the sinkhole. Site 4 is on thesmall creek downstream from spring Wm:O-9.Site 7 is on a stream that drains the studyarea to the south. Site 6 is on a stream thatdrains the hills to the south and is unrelatedto the surface-water flow from the study area.Samples collected during this period wereanalyzed for fecal coliform and fecalstreptococci bacteria, temperature, specificconductance, alkalinity, pH, major inorganicconstituents, nutrients, methylene blue activesubstances(MBAS), and total organic carbon.Samples also were scanned using a gaschromatograph with a flame ionizationdetector (GC/FID) to determine if methylenechloride-extractable organic substances werepresent.DATACOLLECTIONAND ANALYSISWater samples were collected at theWilliamson County site in May 1988 from thethree springs (Wm:O-9, Wm:O-10, Wm:O-11),two domestic wells (Wm:O-7, Wm:O-S), andfour surface-water sites (sites 2, 4, 6, and 7).7
0IY0t33ViLinSCINV-I MO13813&i8NI ‘Hld3a
A sample also was collected from domesticwell Dv:F-1 at the Davidson County site.Samples were analyzed for the sameconstituents as in November 1988 with theaddition of bacterial analyses. Results of theanalysesfor the three samplings are presentedin table 2.Ground-water samples were collectedusing two different methods -- pumping andbailing. Domestic wells were pumped and thesamples were collected at faucets. Thesamples were collected after the specificconductance had stabilized to ensure arepresentative sample. The observation wellswere purged of at least three casing volumesof water, using a submersible pump.Observation well Wm:O-15 was sampled bypumping. The remaining observation wells,because of their low yields, were sampledusing a stainless-steel bailer. The bailer wasrinsed between samples with deionized water.EFFECTS OFSEPTIC-TANKEFFLUENT ONGROUND-WATERQUALITYGrab-samples were collected at thesprings. Because of low yields, it was notpossible to collect depth integrated samples.Wells and springs were sampled on threeoccasions to determine if septic-tank effluenthas affected ground-water quality. The sitessampled varied from one sampling event tothe next, depending on the results of previousanalyses.Samples were collected a second time inNovember 1988. Based on the results of thefirst sampling period, sampling sites werelimited to observation wells Wm:O-12,Wm:O-13, and Wm:O-14, and springs,Temperature,Wm:O-9 and Wm:O-11.specific conductance, and pH were measuredin the field and water samples were collectedand shipped to the laboratory for analysis ofmajor inorganic constituents, nutrients, andtotal organic carbon. Scans for organicsubstances were not performed on this suiteof samples because such substanceswere notdetected in any of the samples collected inMay 1988.Major InorganicConstituentsSamples collected during the study did notexhibit concentrations of any water-qualityconstituents that decisively indicated effects ofseptic-tank effluent. Concentrations of ionssuch as sulfate, calcium, chloride, and sodium,which are commonly used as indicators ofsewage contamination, were typical ofuncontaminated ground water (table 2).In April 1989, all four springs (three inWilliamson County and one in DavidsonCounty) were sampled and analyzed foroptical brighteners. These analyses wereperformed to determine if any hydraulicconnection exists between the springs andseptic-tank field lines.NutrientsThe principal nutrients, nitrogen andphosphorus, are potential indicators ofground-water, septic-tank contamination byeffluents (Miller, 1980; p. 190 and table 23).Most of the sampling in the study was focusedto determine concentrations of the principalspeciesof nitrogen (organic, ammonia, nitrite,and nitrate) and phosphorus (organic andA final suite of samples was collected inMay 1989. During this sampling effort,observation wells Wm:O-12, Wm:O-13,Wm:O-14, and Wm:O-15, and spring Wm:O-9were sampled at the Williamson County site.9
Qs!.8c8-.”.”2. *. w. Ei.” ”8.”l2RS. . .‘21‘ Q. .”Qg. .wZQ. .%E. .wzIncosti’s\“xw.’8%. .wR.0IIIIIIII:z”t?E.005;s. . z.WVYY008s.w“090“0010z.”D
8Q.Q11
I.Q8:Ei2:m3Z90”NO.v\ul12.
inadequate purging of drilling fluid from theadjacent aquifer prior to the November 1988sampling.orthophosphate).The results of the s of these nutrients in several ofthe samples (table 2). Elevated nitrite plusnitrate (1.5 mg/L as N), ammonia (1.3 mg/Las N), and ammonia plus organic nitrogenconcentrationswere(1.8 mg/Las N)measured in water from spring nts were not noticeably elevated insamples from the domestic wells, the othersprings, and the surface-water sites sampled inMay 1988.Organic SubstancesNo synthetic organic compounds weredetected in any of the samples collected.Scans for methylene chloride-extractableorganic substances were conducted on allsamples collected at the Williamson Countysite in May 1988. The scans were conductedusing a ‘gas chromatograph (GC) equippedwith a flame-ionization detector (FID). TheFID is a non-specific detector that respondsto a broad range of organic substances thatpass through the GC.A positive resultappears as an anomalous,compoundunidentifiable peak. Peaks were not presentin any of the scans of samples from theWilliamson County site.Some of the samples collected inNovember 1988, however, did indicate apossible effect of nutrients from septic-tankeffluent upon ground-water quality. Samplesfrom springs Wm:O-9 and Wm:O-11, andfrom well Wm:O-12 had slightly elevatedconcentrations of nitrite plus nitrate (2.7, 2.2,and 1.4 mg/L, as nitrogen, respectively) thatmay have been due to field-line effluent.Analyses of May 1989, however, indicated nodiscernable effect from septic-tank effluent.Although in May 1989, spring Wm:O-9 didhave a nitrite plus nitrate concentration of1.4 mg/L as nitrogen, the data are inconclusivethe slightlyelevatedas to whetherconcentration of nitrite plus nitrate was due toseptic-tank effluent.Analysis for total organic carbon (TOC)is a determination of the total concentrationof organic carbon in a water sample. Analysisfor TOC does not separate natural fromsynthetic organic carbon occurring in groundwater. Concentrations of TOC in septic-tankeffluent can be as high as 69 to 200 mg/L(Waller and others, 1987; Canter and Knox,1986). TOC concentrations measured at sitesin Williamson and Davidson Counties rangedfrom 0.5 to 5.7 mg/L.The highestconcentration was measured in water fromspring Wm:O-9 in May 1988; however,because this concentration is within the rangeof TOC concentrations for some naturalwaters, TOC data cannot be used to confirmthe presence of septic-tank effluent.The November 1988 analyses of waterfrom well Wm:O-13 revealed somewhatelevated concentrations of ammonia plusorganic nitrogen (2.8 mg/L), total phosphorus(1.4 mg/L, as P), and sulfate (150 mg/L, asSO,). These were the highest concentrationsof these constituents measured in any of thesamples from any of the sites. Analyses ofsamples collected from this well in May 1989indicated much lower concentrations of theseconstituents.Because of the depth of thiswell and its low yield, purging is difficult;therefore, the sample collected from this wellin November 1988 possibly did not representVariations in analysesambient conditions.between samples collected in November 1988and May 1989 may be due in part toOptical BrightenersTo demonstrate whether or not ahydraulic connection exists between field linesand the springs in the study area, a qualitativedye test for optical brighteners was conducted.Sampling devices consisting of surgical white13
cotton swabs attached to wire secured to aconcrete base were placed in the discharge ofthe springs. These swabswere later tested forfluorescence under ultraviolet light (acharacteristic of optical brighteners) usingmethods described by Mull and others (1988).Water from the four surface-water siteshad fecal streptococci counts ranging from 670to 3,900 colonies per 100 milliliters (mL) ofsample. Fecal coliform counts in the samplesfrom these sites ranged from 22 to880 colonies per 100 mL of sample.Four optical-brightener sampling deviceswere placed in the three springs (Wm:O-9,Wm:O-10, and Wm:O-11) at the WilliamsonCounty site, and in the spring at the DavidsonCounty site (Dv:F-2) in April 1989. Thesedevices were retrieved after 3 days. Of thefour devices, only the one from springWm:O-9 fluoresced under ultraviolet light,indicating the presence of optical brightenersin the discharge. Another device was placedin spring Wm:O-9, and left for 14 days. Thesecond swab also fluoresced, confirming thepresence of optical brighteners which arecommonly found in septic-tank effluent.Based on the results of this test, a hydraulicconnection between field lines and springWm:O-9 was shown to exist. Hydraulicconnection between field lines and the othersprings could not be demonstrated.Water from the three springs (Wm:O-9,WM:O-10, and WM:O-11) had 700 to 1,800colonies of fecal streptococci, and 14 to3,200 colonies of fecal coliform per 100 mL ofsample. The sample from spring Wm:O-10contained 14 colonies of fecal coliform and1,800 colonies of fecal streptococci per100 mL of sample.Samples from springs had much higherbacterial counts than those from wells. Waterfrom spring Wm:O-9 contained 3,200 coloniesof fecal coliform per 100 mL of sample inMay 1988 and 2,700 colonies per 100 mL inMay 1989. Water from spring Wm:O-11contained 2,000 colonies per 100 mL ofsample in May 1988. Spring Wm:O-11 islocated in a cow pasture and is used by cowsas a source of drinking water; consequently,its water quality may be influenced not onlyby septic-tank effluent but also by animalexcreta.BacteriaBoth fecal coliform and fecal streptococcibacteria are present in the gastrointestinaltract of humans and other warm-bloodedanimals. The presence of these bacteria innatural water indicates degradation by humanor animal waste and may be related to septictank waste.None of the samples from the threedomestic wells contained fecal coliform orfecal streptococci bacteria.Bacterialconcentrations in water from the fourobservation wells ranged from less than 1 to65 colonies of fecal coliform per 100 mL andfrom less than 1 to 380 colonies of fecalstreptococci per 100 mL. The sample fromSamples collected in May 1988 fromobservation well Wm:O-15 did not containdomestic wells Wm:O-7 and Wm:O-8, foursurface-water sites, and three springs wereanalyzed for fecal streptococci and fecalcoliform. Samples collected in May 1989fromthe four observation wells, spring Wm:O-9,and domestic well Dv:F-1 also were analyzedfor these bacteria. Sample collection andanalyseswere in accordance with the methodsof Britton and Greeson (1987). Results areincluded in table 2.either fecal coliform or fecal streptococcusbacteria.SUMMARY ANDCONCLUSIONSThe results of analysesfor major chemicalconstituents and nutrients in water from14
domestic wells, observation wells, and springsdo not conclusively show the presence orabsence of septic-tank effluent in groundwater in northern Williamson County andsouthern Davidson County. Concentrations ofconstituents commonly thought to be aproduct of effluent from field lines did notgreatly exceed concentrations common innatural ground water in the area. Slightlyelevated concentrations of nitrite plus nitrateand total ammonia in spring Wm:O-9 couldbe the result of septic-tank effluent.REFERENCESCITEDAIey, T.J., 1985, Optical brightener sampling; a reconnaissancetoolfor detecting sewagein karst groundwater: American Instituteof Hydrology, v. 1, no. 1, p. 45-48.B&ton, L.J., and Greeson, P.E., eds., 1987, Methods for collectionand analysisof aquatic biological and microbiological samples:U.S. Geological Survey Techniques of Water-ResourcesInvestigations, Book 5, Chapter A4, p. 5367.Canter, L.W., and Knox, R.C., 1985, Septic tank system effects onground water quality: Chelsea, Mich., Lewis Publications, Inc.,336 p.Geldreich, E.E, and Kenner, H.L., 1969, Concepts of fecalstreptococci in stream pollution: Journal of the WaterPollution Control Federation 41; part 2, A336-352.Hollyday, E.F., and Goddard, P.L., 1980, Ground-water availability incarbonate rocks of the Dandridge area, Jefferson County,Tennessee: U.S. Geological Sutvey Water ResourcesInvestigations Report 79-1263, 50 p.Madison, R.J., and Burnett, J.O., 1985, Overview of the occurrenceof nitrate in ground water of the Unites States, jt NationalWater Summaty: U.S. Geological Survey Water-Supply Paper2275,467 p,Miller, D.W., 1980, Waste-disposal effects on ground water: BerkIey,Calif., Premier Press, 512 p.Mull, D.S., Lieberman, T.D., Smoot, J.L., and Woosley, L.H., 1988,Application of dye-tracing techniques for determiningsolute-transport characteristics of ground water in karstterranes: U.S. Environmental Protection Agency, Region 4,Manual EPA 904/6-88-001, 103 p.Pitt, W.A.J., Jr., Mattraw, H.C., Jr., and Klein, H., 1975, Groundwater quality in selected areas serviced by septic tanks, DadeCounty, Florida: U.S. Geological Survey Open-File Report75-607, 82 p.Wailer, B.G., Howie, Barbara, and Causaras, C.R., 1987, Effluentmigration from septic tank systemsin two different lithologies,Broward County, Florida: U.S. Geological Survey WaterResources Investigations Report 87-4075, 22 p.Wilson, T.M., Reinhard, J.D., Gordon, J.A., and Ogden, AE., 1988,A study of septic tank systems in Sullivan County, Tennessee:TennesseeValley Authority Report TV 65598a, 89 p.Organic substanceswere not detected, butthe absence of such substances in groundwater does not d
septic tanks in northern Williamson County and southern Davidson County. The purpose of the study was to: 1. Determine if a hydraulic connection exists between septic-tank systems and the ground-water system and, if so, 2. Determine the potential for occurrence or existence of ground- water contamination by septic-system effluent.