Transcription
Berea City School DistrictEquity Data 2021
What is an equity audit?The goal of an equity audit is to identify institutional practices thatproduce discriminatory trends in data that a ect students. Schools anddistricts conduct audits to analyze data in three key areas: programmaticequity, teaching quality equity, and achievement equity (Skrla, McKenzie& Scheurich, 2009).ffBerea City Schools partnered with Educational Service Centerof Northeast Ohio as a member of the Network of districts
What does an equity audit do(or not do)?An equity auditdoes not:An equity audit: fifi Identi es past and current trendsacross a variety of subgroups Reveals past and currentoutcomes across a variety ofsubgroupsIdentify causes or reasonsbehind the data Assign responsibility or blame foridenti ed areas of concernMakes “apples to apples”comparisons possible Identify solutions“Sets the table” for meaningfulconversation about next steps
Population TrendsStudent GroupsIdenti cationDisciplineAttendancefiAchievement
Population Trends2010-2020
5000600070008000
040005000600070008000
80006400# 42014-152015-162016-172017-182018-192019-20
80006400# 42014-152015-162016-172017-182018-192019-20
# Enrollment% Economic 0-117%Decrease212019-20 2010-118.5%Decrease2019-20
Students living in poverty2010
Students living in poverty2020
Racial and Ethnic Diversity
WhiteAsianBlackLatinoGroups - 20106%20105%5%3%81%Multi
WhiteAsianBlackLatinoGroups - 202074%7%20208%6%5%Multi
WhiteAsian7%2%BlackGroups - 2020 1%Latino3.5%74%7%20208%6%5%Multi 1%
Equity Data
If 10% of students areidenti ed as giftedDiverse Student PopulationfiMirroring Demographics
If 10% of students areidenti ed as giftedDiverse Student PopulationfiMirroring Demographics
If 10% of students areidenti ed as giftedDiverse Student PopulationfiMirroring Demographics
fiIf 10% of students areidenti ed as gifted
If 10% of students areidenti ed as giftedfiWhat if all of those studentswere male?
fiIf 10% of students are identi ed asgifted
If 10% of students are identi ed asgiftedfiWhat might it say about your district if theyare all female?
If 10% of students are identi ed asgiftedfiWhat if they were all enrolled in the samebuilding?
Student Groups/Identification
Gifted
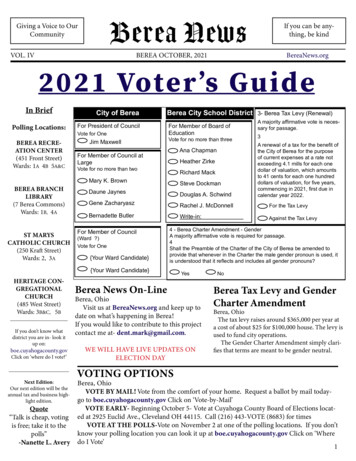
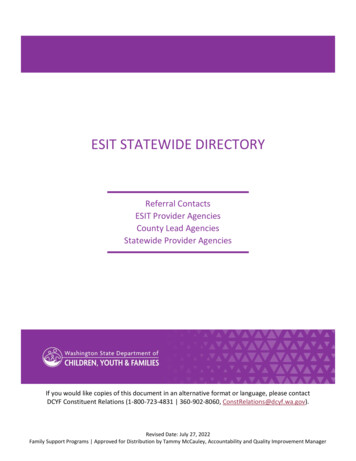
State Avg. 15%Nat Avg. 13%Percent Enrollment 19-20Percent Gifted1009083.38075706050Percent ofStudentsIdenti edas Gifted17%403020105.85.80fiAsian5.77.51.34.9African American Hispanic/Latino6.44.5MultiracialWhite
17%District % of StudentsIdenti ed as Gifted% Poplulation% Gifted10083.47568.4503225170fiEconomically DisadvantagedNot EconomicallyDisadvantaged
Students with Disabilities
Percent EnrollmentPercent Students w/Disabilities100908075706050403017% .59.5Multiracial6.4Asian7.6White70.6
17%District % of StudentsIdenti ed as SPEDIdenti ed SPED (5yr. avg.)Popluation (5yr. avg.)1007568.4615038.931.4250fifiNot EconomicallyDisadvantagedEconomically Disadvantaged
AP Enrollment
AP Enrollment (2 year average 2018-2020)100% of AP Students% of Population8057.3760514942.6340200MaleFemale
AP Enrollment80.6980% Population% of AP .776.64.230AsianBlackHispanicMulti RacailWhite
Discipline
Discipline (5 year 8.7200% OSS% of ISS
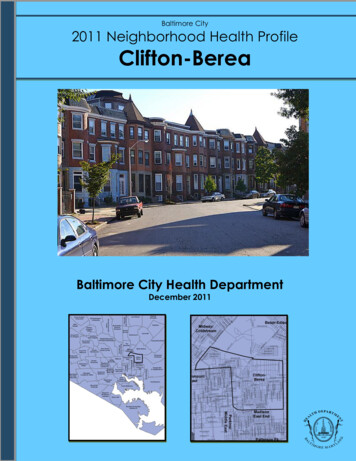
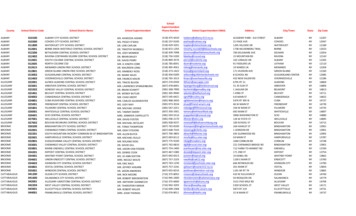
Suspension - Out of School Days (5 Year Average)80% Population% OSS727568.164564840322416811.34.72.25.77.58 8.911.16.40AsianBlackHispanicMulti RacailWhite
Suspension - In School Days (5 Year Average)80% Population% 0.6AsianBlackHispanicMulti RacailWhite
Suspensions - Days x Economically Disadvantaged (5 YearAverage 2015-2020)8072% Population% OSS% ISS68.46459.156484040.838.131.532241680NoYes61.8
Suspensions - Days x Students w/Disabilities (5 Year Average2015-2020)10087.575% Population% OSS% ISS83.470.870.862.55037.529.12516.612.50NoYes29.1
Attendance
Unexcused Absensces X Race (5 yr. avg., 2015-2020)% Unexcused Absences% of n7.825.7210.697.58African American Hispanic/Latino9.786.49MultiracialWhite
Attendance Rate x Race 18/1919/20
Achievement
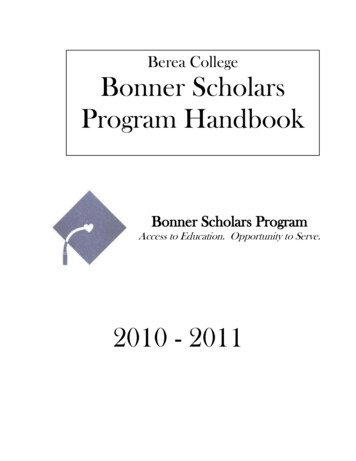
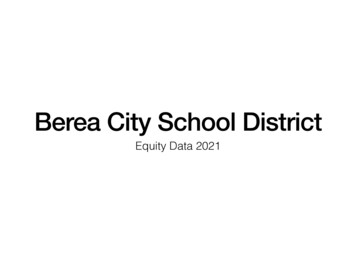
% of Students Graduating w/an Honors Diploma vs. Graduation (5year average)50% Graduating with 15105.9501.4All aleEc-DisSW-Dis
Integrated Comprehensive Services For EquityDr. Elise Frattura and Dr. Colleen Capper
Schools and districts conduct audits to analyze data in three key areas: programmatic equity, teaching quality equity, and achievement equity (Skrla, McKenzie & Scheurich, 2009). Berea City Schools partnered with Educational Service Center of Northeast Ohio as a member of the Network of districts.