Transcription
U.S. Department of JusticeOffice of Justice ProgramsNational Institute of JusticeImproved Analysis ofDNA ShortTandemRepeatsWith Time-of-FlightMass Spectrometrys c i e n c e a n d t e c h n o l o g y r e s e a rc h r e p o r t
U.S. Department of JusticeOffice of Justice Programs810 Seventh Street N.W.Washington, DC 20531John AshcroftAttorney GeneralOffice of Justice ProgramsWorld Wide Web Sitehttp://www.ojp.usdoj.govNational Institute of JusticeWorld Wide Web Sitehttp://www.ojp.usdoj.gov/nij
IMPROVED ANALYSIS OF DNA SHORT TANDEM REPEATSWITH TIME-OF-FLIGHT MASS SPECTROMETRYJohn M. Butler and Christopher H. BeckerScience and Technology Research ReportOctober 2001NCJ 188292
Sarah V. HartDirector, National Institute of JusticeLois TullyProject MonitorJohn M. Butler, Ph.D., is currently a research chemist at the National Institute of Standards and Technology and principleinvestigator on an NIJ-funded project to further develop multiplex PCR and time-of-flight mass spectrometry for future forensicDNA typing assays. He was the first to demonstrate that short tandem repeat typing could be performed with capillaryelectrophoresis.Christopher H. Becker, Ph.D., is currently senior director of proteomics technology at Thermo Finnigan in San Jose,California. During the span of this project, he was president and chief operations officer of GeneTrace Systems, Inc.This project was supported under grant number 97–LB–VX–0003 from the National Institute of Justice, Office of JusticePrograms, U.S. Department of Justice. Points of view in this document are those of the authors and do not necessarilyrepresent the official position or policies of the U.S. Department of Justice.This document is not intended to create, does not create, and may not be relied upon to create any rights, substantive orprocedural, enforceable at law by any party in any matter, civil or criminal.For further information, contact John M. Butler, National Institute of Standards and Technology, 100 Bureau Drive,Gaithersburg, MD 20899; phone 301–975–4049; e-mail john.butler@nist.gov.The National Institute of Justice is a component of the Office of Justice Programs, which also includes the Bureau ofJustice Assistance, the Bureau of Justice Statistics, the Office of Juvenile Justice and Delinquency Prevention, and theOffice for Victims of Crime.
ACKNOWLEDGMENTSThe project described in thisreport could not have happenedwithout the hard work and support of a number of people at GeneTraceSystems, Inc. First and foremost, Jia Lidid some of the early primer designand STR work to demonstrate thatSTRs could be effectively analyzed bymass spectrometry. Jia taught us a lotabout PCR and was always encouraging of our work. Likewise, Tom Shalerwas important in the early phases ofthis research with his expert advice inmass spectrometry and data processing.The first GeneTrace STR mass spectrawere carefully collected by Tom, andthus he and Jia deserve credit for helping obtain the funding for this study.Dan Pollart synthesized numerouscleavable primers for this project, especially in the first year of our work.David Joo and Wendy Lam also prepared PCR and SNP primers for thelater part of this work. A number ofpeople assisted in robotic sample preparation and sample cleanup, includingMike Abbott, Jon Marlowe, DavidWexler, and Rebecca Turincio. JoannaHunter, Vera Delgado, and Can Nhanran many of the STR samples on theautomated mass spectrometers. Theirhard work made it possible to focus onexperimental design and data analysisrather than routine sample handling.It was a great blessing to have talentedand supportive coworkers throughoutthe course of this project. KathyStephens, Jia Li, Tom Shaler, YupingTan, Christine Loehrlein, JoannaHunter, Hua Lin, Gordy Haupt, andNathan Hunt provided useful discussions on a number of issues and helpeddevelop assay parameters and tackleautomation issues, among other things.Nathan Hunt was especially importantto the success of this project becausehe developed the STR genotyping algorithm and CallSSR software as well asthe multiplex SNP primer design software. Kevin Coopman developed theSNP genotyping algorithm and callingsoftware and was always eager to analyze our multiplex SNP samples. JoeMonforte and Roger Walker served asour supervisors for the first year andsecond year of this project, respectively,which allowed us the opportunity todevote sufficient time to doing the workdescribed in this project. Last but notleast, Debbie Krantz served as an ableadministrator of these two NIJ grantsand took care of the financial aspects.We also were supported with samplesand sequence information from a number of scientific collaborators. Steve Leeand John Tonkyn from the CaliforniaDepartment of Justice DNA Laboratoryprovided genomic DNA samples andSTR allelic ladders. Debang Liu fromNorthwestern University providedthe D3S1358 DNA sequence used forimproved primer design purposes.Peter Oefner and Peter Underhill fromthe Department of Genetics at StanfordUniversity provided male populationsamples and Y-chromosome SNPsequences. The encouragement andsupport of Lisa Forman and RichardRau from the Office of Justice Programsat the National Institute of Justice propelled this work from an idea to aworking product. In addition, DennisReeder from the National Institute ofStandards and Technology was alwaysa constant source of encouragementat scientific meetings.iii
CONTENTSAcknowledgments .iiiExecutive Summary .1Introduction .1Purpose of the Report .1Short Tandem Repeats.2Single Nucleotide Polymorphisms .5Conclusions and Implications .6Project Description .9STR Grant .9SNP Grant .10Scope and Methodology .21Assay Development and Primer Testing.22Sample Cleanup and Mass Spectrometry.29Sample Genotyping .31Comparison Tests With ABI 310 Genetic Analyzer .33Results and Discussion of STR Analysis by Mass Spectrometry .35Marker Selection and Feasibility Studies With STR Loci .35Multiplex STR Work .40Comparison Tests Between ABI 310 and Mass Spectrometry Results.40PCR Issues.41Analytical Capabilities of This Mass Spectrometry Method .51Results and Discussion of Multiplex SNPs .63Mitochondrial DNA Work .64Y-Chromosome Work .66References .73Published Papers and Presentations .75v
List of exhibits included with this report:Exhibit 1. Schematic of GeneTrace automated time-of-flight mass spectrometer.2Exhibit 2. PCR product sizes with newly designed primers for commonly usedSTR loci compared with commercially available primers usedin multiplex sets for fluorescence-based assays .3Exhibit 3. Fluorescent multiplex STR result with AmpF1STR COfilerTMkit and ABI 310 Genetic Analyzer .4Exhibit 4. Schematic of expected allele masses for a CSF1PO-TPOX-THO1(CTT) multiplex involving overlapping allele size ranges.4Exhibit 5. Mass spectrum of an STR triplex involving TPOX, THO1,and CSF1PO .5Exhibit 6. Mass spectrum of SNP 10-plex assay for screening polymorphic sitesin the mtDNA control region .6Exhibit 7. Overlay of CE electropherograms demonstrating male-specificamplification with the 17-plex set of PCR primers.7Exhibit 8. Mass spectrum of an STR multiplex sample withnonoverlapping alleles .9Exhibit 9. Mass spectrum of STR multiplex mixture of TH01 and TPOXallelic ladders .10Exhibit 10. Mass spectrum of a multiplexed TH01 and TPOX sample showinginterleaved amplicons that are only 85 Da apart .10Exhibit 11. STR data collection times for CDOJ samples .11Exhibit 12. CDOJ CSF1PO results compared with ABI 310 and massspectrometry methods .12Exhibit 13. CDOJ TPOX results compared with ABI 310 and massspectrometry methods .13Exhibit 14. CDOJ TH01 STR results compared with ABI 310 and massspectrometry methods .14Exhibit 15. CDOJ amelogenin results compared with ABI 310 and massspectrometry methods .15Exhibit 16. CDOJ D3S1358 STR results compared with ABI 310 and massspectrometry methods .16Exhibit 17. CDOJ D16S539 STR results compared with ABI 310 and massspectrometry methods .17Exhibit 18. CDOJ D7S820 STR results compared with ABI 310 and massspectrometry methods .18Exhibit 19. CDOJ FGA STR results compared with ABI 310 and massspectrometry methods .19vi
Exhibit 20. Schematic of the STR assay using the GeneTrace cleavableprimer technology .21Exhibit 21. Schematic of the SNP assay using the GeneTrace cleavableprimer technology .22Exhibit 22. D3S1358 sequence with PCR primer locations .23Exhibit 23. Expected mass-to-charge ratios of various ions in themtDNA 10-plex assay .24Exhibit 24. Primer sequences designed for STR markers tested bymass spectrometry .24Exhibit 25. CEPH family pedigrees for samples examined .25Exhibit 26. Mitochondrial DNA primers used for 10-plex SNP reaction .26Exhibit 27. Multiplex PCR primers used for Y SNP markers .27Exhibit 28. CE electropherograms of “dropout” experiments conductedon a 9-plex PCR primer set used in developing Y-chromosomeSNP markers .28Exhibit 29. Photo of the automated GeneTrace mass spectrometry ion opticsover a sample plate containing 384 different DNA samples .30Exhibit 30. Mass ladder file for STR loci analyzed in this study .31Exhibit 31. Mass spectra of CDOJ samples amplified with CSF1PO primers .32Exhibit 32. Sample sets run on ABI 310 Genetic Analyzer withAmpF1STR ProfilerPlus or AmpF1STR COfiler fluorescent STR kits .33Exhibit 33. Tetranucleotide markers identified through literature and publicdatabase searches as possible candidates for early STRmarker development .35Exhibit 34. STR markers examined at GeneTrace during the courseof this project as sorted by their chromosomal position.36Exhibit 35. Mass spectra for CSF1PO, TPOX, TH01, and amelogeninusing K562 DNA .37Exhibit 36. Mass spectra of STR allelic ladders from CSF1PO,TPOX, TH01, and VWA.38Exhibit 37. Mass spectra of a D8S1179 sample illustrating the benefitof a dideoxynucleotide termination approach .39Exhibit 38. Multiplexing strategies for STR genotyping using FTA paper .41Exhibit 39. CDOJ D8S1179 STR results with the mass spectrometry method .42Exhibit 40. CDOJ DYS391 STR results with the mass spectrometry method .43Exhibit 41. Plot of measured masses versus sample number fromfour different STR loci .44vii
Exhibit 42. Effects of sequence variation on PCR amplification in oraround STR repeat regions .45Exhibit 43. Mass spectra of CDOJ samples amplified with D7S820 primers .46Exhibit 44. Electropherograms of ABI 310 results for new STRmicrovariants seen in the Stanford male population samples .47Exhibit 45. ProfilerPlus results from Stanford male population samples .48Exhibit 46. Plot of allele mass offsets (allele 1 versus allele 2) forheterozygous samples from four different loci .49Exhibit 47. Plot of X allele mass offset versus Y allele mass offset for88 amelogenin samples .49Exhibit 48. Mass spectra comparing an STR sample amplified with TaqGoldpolymerase and Tsp polymerase.50Exhibit 49. Mass spectrum demonstrating detection of stutter products from aparticularly stutter-prone dinucleotide repeat locus .50Exhibit 50. Primer sequence determination with exonuclease digestionand mass difference measurements .51Exhibit 51. Mass spectrum of AmpF1STR Green I primer mix .51Exhibit 52. TH01 STR primer positions for commercially available primershighlighted on the GenBank sequence .52Exhibit 53. TPOX STR primer positions for commercially available primershighlighted on the GenBank sequence .53Exhibit 54. CSF1PO STR primer positions for commercially available primershighlighted on the GenBank sequence .54Exhibit 55. Mass spectrum of a TH01 allelic ladder reamplified fromAmpF1STR Green I allelic ladders .55Exhibit 56. Mass spectra of D5S818 allelic ladders from two manufacturers .55Exhibit 57. Mass spectra of TPOX PCR products from various amountsof K562 DNA template material.56Exhibit 58. Mass spectra of CDOJ samples amplified with TPOX primers .57Exhibit 59. Mass spectra of CDOJ samples amplified with TH01 primers .58Exhibit 60. Comparison of allele masses collected 6 months apart.59Exhibit 61. Fifteen replicate analyses of a TPOX allelic ladder to measure massprecision and accuracy.60Exhibit 62. Upper strand (TCAT repeat) and lower strand (AATG repeat)mass differences for the TH01 allelic ladder.60Exhibit 63. Comparison of ABI 310 and mass spectrometry allele calls for90 CEPH/diversity samples .61viii
Exhibit 64. Histogram of mass difference measurements for 200 samples(50 for each ddN) .63Exhibit 65. Schematic representation of the mtDNA control region10-plex SNP assay .64Exhibit 66. SNP ions impacting multiplex design .64Exhibit 67. Multiplex PCR information for 17-plex PCR reaction .66Exhibit 68. CE electropherograms showing a multiplex PCR samplecompared with individual PCR reactions .67Exhibit 69. Primers for testing Y-chromosome SNP markers in singleplexes .68Exhibit 70. Y SNP multiplex primer information .68Exhibit 71. Human autosomal SNP markers designed for testing NIHdiversity panel .69Exhibit 72. Characteristics of STR and SNP markers .70Exhibit 73. STR genotypes for standard DNA templates K562, AM209,and UP006 obtained using AmpF1STR ProfilerPlus andAmpF1STR COfiler fluorescent STR kits .70Exhibit 74. An ABI 310 CE electropherogram showing a heterozygoussample with a 15.2 microvariant at STR locus D3S1358 .71ix
EXECUTIVE SUMMARYIntroductionThe advent of DNA typing andits use for human identity testing has revolutionized lawenforcement investigations in recentyears by allowing forensic laboratoriesto match suspects with minusculeamounts of biological evidence from acrime scene. Equally important is theuse of DNA to exclude suspects whowere not involved in a crime or toidentify human remains in an accident.The past decade has seen numerousadvances in the DNA testing procedures, most notably among them thedevelopment of PCR (polymerasechain reaction)-based DNA typingmethods. Technologies for measuringDNA variations, both length andsequence polymorphisms, have alsoadvanced rapidly in the past decade.The time needed to determine a sample’s DNA profile has dropped from6–8 weeks to 1–2 days, and withmore recent advancements, the timeneeded to process samples maydecrease to as little as a few hours,maybe even a few minutes.Simultaneous with the evolutionof DNA markers and technologiesembraced by the forensic communityhas been the acceptance and use ofDNA typing information. The courtroom battles over statistical issuesthat were common in the late 1980sand early 1990s have subsided as DNAevidence has become more widelyaccepted.In the past 5 years, DNA databaseshave emerged as powerful tools forcriminal investigations, much like thefingerprint databases that have beenused routinely for decades.The United Kingdom launched anationwide DNA database in 1995that now contains more than 1 millionDNA profiles of convicted felons—profiles that have been used to aidmore than 75,000 criminal investigations. National DNA databases arespringing up in countries all over theworld as their value to law enforcement is being recognized.hours, and with improved accuracycompared with conventional electrophoresis methods.In the United States, the FBI hasdeveloped the Combined DNA IndexSystem (CODIS) with the anticipationthat several million DNA profiles willbe entered into this database in thenext decade. All 50 States now havelaws requiring DNA typing of convicted offenders, typically for violentcrimes such as rape or homicide.Overall, the mass spectrometry methoddescribed in this study is two ordersof magnitude faster in sample processing time than conventional techniques.While the law enforcement community is gearing up to gather millions ofDNA samples from convicted felons,the DNA typing technology needsimprovement. Large backlogs of samples exist today due to the high cost ofperforming the DNA testing and limited capabilities in forensic laboratories.As of the summer of 1999, severalStates, including California, Virginia,and Florida, had backlogs of morethan 50,000 samples. A need exists formore rapid and cost-effective methodsfor high-throughput DNA analysis toprocess samples currently being gathered for large criminal DNA databasesaround the world.At the start of this project in June1997, commercially available slab gelor capillary electrophoresis instrumentscould handle only a few dozen samplesper day. While larger numbers of samples can be processed by increasingthe number of laboratory personneland instruments, the developmentof high-throughput DNA processingtechnologies promises to be more costeffective in the long run, especially forthe generation of large DNA databases. GeneTrace Systems, Inc., a smallbiotechnology company located inAlameda, California, has developedhigh-throughput DNA analysis capabilities using time-of-flight mass spectrometry coupled with parallel samplepreparation on a robotic workstation.The GeneTrace technology allows several thousand samples to be processeddaily. DNA samples can be analyzedin seconds, rather than minutes orPurpose of the ReportThis NIJ project was initiated to adaptthe GeneTrace technology to humanidentity DNA markers commonly usedby forensic DNA laboratories, specifically short tandem repeat (STR) markers. An extension of the original grantwas submitted in December 1997 tofund the development of single nucleotide polymorphism (SNP) markersfrom mitochondrial DNA and the Ychromosome.Based on the results obtained in thisstudy, the authors believe mass spectrometry can be a useful and effectivemeans for high-throughput DNAanalysis, and that it has the capabilities to meet the needs of the forensicDNA community for offender DNAdatabases.However, due to limited resourcesand a perceived difficulty to enterthe forensic DNA market, GeneTracemade a business decision to not pursue this market. While the STR milestones on the original grant weremet, only the initial milestones wereachieved on the SNP portion of theNIJ grant because of the prematuretermination on the part of GeneTrace.GeneTrace Systems, Inc., developedan integrated high-throughput DNAanalysis system involving the use ofproprietary chemistry, robotic samplemanipulation, and time-of-flight massspectrometry. The purpose of this NIJproject was to apply the GeneTracetechnology to improve the analysis ofSTR markers commonly used in forensic DNA laboratories.1
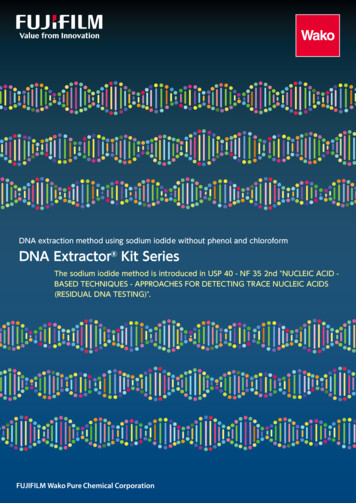
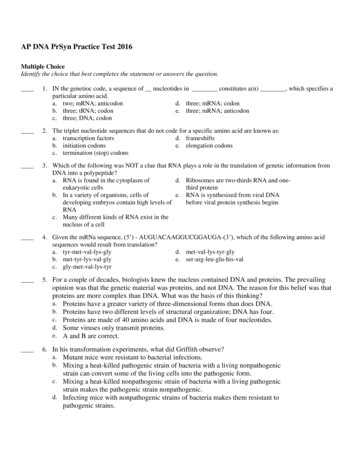
EXECUTIVE SUMMARYMass spectrometry is a versatile analytical technique that involves the detection of ions and the measurement oftheir mass-to-charge ratio. Becausethese ions are separated in a vacuumenvironment, analysis times can beextremely rapid, often within microseconds. Many advances have beenmade in the past decade for the analy-sis of biomolecules such as DNA, proteins, and carbohydrates since theintroduction of a new ionization technique known as matrix-assisted laserdesorption-ionization (MALDI) andthe discovery of new matrixes thateffectively ionize DNA without extensive fragmentation. When coupledwith time-of-flight mass spectrometry,Exhibit 1. Schematic of GeneTrace automated time-of-flight massspectrometer. DNA molecules are liberated from a solid-phase matrixenvironment with a laser pulse. The DNA reaction products are separated bysize (mass) in a matter of microseconds, as opposed to hours using conventionalmethods. For each run, hundreds of samples are prepared in parallel using arobotic workstation and spotted on a sample plate that is introduced to thevacuum environment of the mass spectrometer. The sample plate moves underthe fixed laser beam to allow sequential sample analysis.DetectorDNA Reaction Products(separated by mass whiledrifting to the detector)Drift RegionElectric-Field FreePulsed Laser BeamHigh-DensitySample ArrayX-Y sampleselection(moves array)2Ion ExtractorAcceleration Regionthis method for measuring biomolecules is commonly referred to asMALDI-TOF-MS. A schematic ofMALDI-TOF-MS is presented inexhibit 1.Short Tandem RepeatsShort tandem repeat (STR) DNA markers, also referred to as microsatellites orsimple sequence repeats (SSRs), consistof tandemly repeated DNA sequenceswith a core repeat of 2–6 base pairs (bp).STR markers are readily amplified during PCR by using primers that bind inconserved regions of the genome flanking the repeat region. Forensic laboratories prefer tetranucleotide loci (i.e.,4 bp in the repeat) due to the loweramount of “stutter” produced duringPCR. (Stutter products are additionalpeaks that can complicate the interpretation of DNA mixtures by appearingin front of regular allele peaks.) Thenumber of repeats can vary from 3 or 4repeats to more than 50 repeats withextremely polymorphic markers. Thenumber of repeats, and hence the sizeof the PCR product, may vary amongsamples in a population making STRmarkers useful in identity testing orgenetic mapping studies.Shortly after this project was initiated,the FBI designated 13 core STR locifor the nationwide CODIS database.These STR loci are TH01, TPOX,CSF1PO, VWA, FGA, D3S1358,D5S818, D7S820, D13S317, D16S539,D8S1179, D18S51, and D21S11. Thesex-typing marker, amelogenin, is alsoincluded in STR multiplexes that coverthe 13 core STR loci. Each samplemust have these 14 markers tested tobe entered into CODIS.To illustrate the kinds of numbersinvolved to analyze the current nationalsample backlog of 500,000 samples,more than 7 million genotypes mustbe generated. Using currently available technologies, an estimated 25million ( 50/sample) and more than5 years for well-trained and well-funded
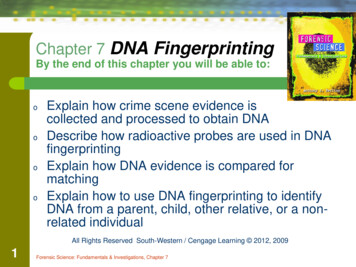
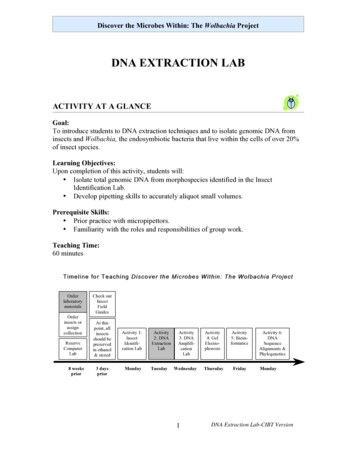
EXECUTIVE SUMMARYlaboratories would be required todetermine those 7 million genotypes.With the high cost and effort required,most of these backlogged samples arebeing stored in anticipation of futureanalysis and inclusion in CODIS, pending the development of new, fastertechnology or the implementation ofmore instruments using the currentelectrophoresis technologies.Exhibit 2. PCR product sizes with newly designed primers for commonlyused STR loci compared with commercially available primers used inmultiplex sets for fluorescence-based assays. The red numbers indicate PCRproduct size ranges that exceed the recommended 140 bp mass spectrometrydetection range.GeneTrace Sizes(newly designed primersin this study)Commerically AvailableSizes*AppliedPromegaBiosystemsSTR LocusKnownAllelesAmelogeninX, Y106, 112 bpCD44–1581–136 bpCSF1PO6–1587–123 bpF13A13–17112– 168 bpN.A.279–335 bpF13B6–12110–134 bpN.A.169–193 bpFES/FPS7–1576–108 bpN.A.222–254 bpFGA15–30118– 180 bp206–266 bpN.A.D3S13589–2076–120 bp101–145 bpN.A.D5S8187–1589–121 bp134–166 bp119–151 bpD7S8206–1466–98 bp257–289 bp215–247 bpD8S11798–1892–130 bp127–167 bpD13S3177–1598–130 bp201–233 bp165–197 bpD16S5395,8–1581–121 bp233–273 bp264–304 bpD18S519–27120–192 bp272–344 bpN.A.D21S1124–38150–190 bp186–242 bpN.A.DYS198–1676–108 bpN.A.DYS3919–1299–111 bpN.A.HPRTB6–1784–128 bpN.A.259–303 bpLPL7–14105–133 bpN.A.105–133 bpTH013–13.355–98 bp160–203 bp171–214 bpTPOX6–1469–101 bp217–249 bp224–256 bpVWA11–22126–170 bp156–200 bp127–171 bpGATA132B0410–1499–115 bpN.A.D22S44510–16110–130 bpN.A.D16S26224–871–87 bpN.A.106, 112 bp212, 218 bpN.A.280–316 bp291–327 bpN.A.Other STRs* Sizes are listed without adenylation (add 1 base for A form).N.A. Not Available.Time-of-flight mass spectrometry hasthe potential to bring DNA sampleprocessing to a new level in terms ofhigh-throughput analysis. However,there are several challenges to usingMALDI-TOF-MS for the analysis ofPCR products, such as STR markers.Mass spectrometry resolution andsensitivity are diminished when eitherthe DNA size or the salt content ofthe sample is too large. By redesigningthe PCR primers to bind close to therepeat region, the STR allele sizesare reduced to benefit the resolutionand sensitivity of the PCR products.Therefore, much of this projectinvolved designing and testing newPCR primers that produced smalleramplicon sizes for STR markers offorensic interest. This research focusedon STR loci that have been developedby commercial manufacturers and studied extensively by forensic scientists.These include all of the GenePrintTMtetranucleotide STR systems fromPromega Corporation (Madison, WI)as well as the 13 CODIS STR loci thatare covered by the Profiler PlusTM andCOfilerTM kits from Applied Biosystems(ABI) (Foster City, CA) (exhibit 2).Where possible, primers were designedto produce amplicons less than 100 bpin size, although it has been possibleto resolve neighboring STR alleles aslarge as 140 bp. For example, TPOXalleles 6–14 ranged from 69–101 bp insize with GeneTrace-designed primers;wh
Exhibit 15. CDOJ amelogenin results compared with ABI 310 and mass spectrometry methods .15 Exhibit 16. CDOJ D3S1358 STR results compared with ABI 310 and mass spectrometry methods .16 Exhibit 17. CDOJ D16S539 STR results compared with ABI 310 and mass