Transcription
Magic Quadrant for Business IntelligencePlatforms6 February 2012 ID:G00225500Analyst(s): John Hagerty, Rita L. Sallam, James RichardsonVIEW SUMMARYIn 2011, business users continued to exert significant influence over BI decisions, often choosing datadiscovery products in addition to/as alternatives to traditional BI tools. An avalanche of new usecases, content types and interaction models expands the scope for tomorrow's BI platforms.Market Definition/DescriptionThis document was revised on 10 February 2012. For more information, see the Correctionspage on gartner.com.Business intelligence (BI) platforms enable all types of users — from IT staff to consultants to businessusers — to build applications that help organizations learn about and understand their business. Gartnerdefines a BI platform as a software platform that delivers the 14 capabilities listed below. Thesecapabilities are organized into three categories of functionality: integration, information delivery andanalysis. Information delivery is the core focus of most BI projects today, but we are seeing anincreased interest in deployments of analysis to discover new insights, and in integration to implementthose insights.Return to TopIntegrationBI infrastructure — All tools in the platform use the same security, metadata, administration,portal integration, object model and query engine, and should share the same look and feel.Metadata management — Not only should all tools leverage the same metadata, but theoffering should provide a robust way to search, capture, store, reuse and publish metadataobjects such as dimensions, hierarchies, measures, performance metrics and report layoutobjects.Development tools — The BI platform should provide a set of programmatic development toolsand a visual development environment, coupled with a software developer's kit for creating BIapplications, integrating them into a business process, and/or embedding them in anotherapplication. The BI platform should also enable developers to build BI applications without codingby using wizard-like components for a graphical assembly process. The development environmentshould also support Web services in performing common tasks such as scheduling, delivering,administering and managing. In addition, the BI application can assign and track events or tasksallotted to specific users, based on predefined business rules. Often, this capability can bedelivered by integrating with a separate portal or workflow tool.Collaboration — This capability enables BI users to share and discuss information, BI contentand results, and/or manage hierarchies and metrics via discussion threads, chat and annotations,either embedded in the BI platform or through integration with collaboration, social software andanalytical master data management (MDM).Return to TopInformation DeliveryReporting — Reporting provides the ability to create formatted and interactive reports, with orwithout parameters, with highly scalable distribution and scheduling capabilities. In addition, BIplatform vendors should handle a wide array of reporting styles (for example, financial,operational and performance dashboards), and should enable users to access and fully interactwith BI content delivered consistently across delivery platforms including the Web, mobile devicesand common portal environments.Dashboards — This subset of reporting includes the ability to publish formal, Web-based ormobile reports with intuitive interactive displays of information, including dials, gauges, sliders,check boxes and traffic lights. These displays indicate the state of the performance metriccompared with a goal or target value. Increasingly, dashboards are used to disseminate real-timedata from operational applications or in conjunction with a complex event processing engine.Ad hoc query — This capability enables users to ask their own questions of the data, withoutrelying on IT to create a report. In particular, the tools must have a robust semantic layer to allowusers to navigate available data sources. These tools should include a disconnected analysiscapability that enables users to access BI content and analyze data remotely without beingconnected to a server-based BI application. In addition, these tools should offer query governanceand auditing capabilities to ensure that queries perform well.EVALUATION CRITERIA DEFINITIONSAbility to ExecuteProduct/Service: Core goods and services offered bythe vendor that compete in/serve the defined market.This includes current product/service capabilities,quality, feature sets and skills, whether offerednatively or through OEM agreements/partnerships asdefined in the market definition and detailed in thesubcriteria.Overall Viability (Business Unit, Financial,Strategy, Organization): Viability includes anassessment of the overall organization's financialhealth, the financial and practical success of thebusiness unit, and the likelihood that the individualbusiness unit will continue investing in the product, willcontinue offering the product and will advance thestate of the art within the organization's portfolio ofproducts.Sales Execution/Pricing: The vendor's capabilities inall pre-sales activities and the structure that supportsthem. This includes deal management, pricing andnegotiation, pre-sales support and the overalleffectiveness of the sales channel.Market Responsiveness and Track Record: Abilityto respond, change direction, be flexible and achievecompetitive success as opportunities develop,competitors act, customer needs evolve and marketdynamics change. This criterion also considers thevendor's history of responsiveness.Marketing Execution: The clarity, quality, creativityand efficacy of programs designed to deliver theorganization's message to influence the market,promote the brand and business, increase awarenessof the products, and establish a positive identificationwith the product/brand and organization in the mindsof buyers. This "mind share" can be driven by acombination of publicity, promotional initiatives,thought leadership, word-of-mouth and sales activities.Customer Experience: Relationships, products andservices/programs that enable clients to be successfulwith the products evaluated. Specifically, this includesthe ways customers receive technical support oraccount support. This can also include ancillary tools,customer support programs (and the quality thereof),availability of user groups, service-level agreementsand so on.Operations: The ability of the organization to meet itsgoals and commitments. Factors include the quality ofthe organizational structure, including skills,experiences, programs, systems and other vehiclesthat enable the organization to operate effectively andefficiently on an ongoing basis.Completeness of VisionMarket Understanding: Ability of the vendor tounderstand buyers' wants and needs and to translatethose into products and services. Vendors that showthe highest degree of vision listen to and understandbuyers' wants and needs, and can shape or enhancethose with their added vision.Marketing Strategy: A clear, differentiated set ofmessages consistently communicated throughout theorganization and externalized through the website,advertising, customer programs and positioningstatements.Sales Strategy: The strategy for selling products thatuses the appropriate network of direct and indirect
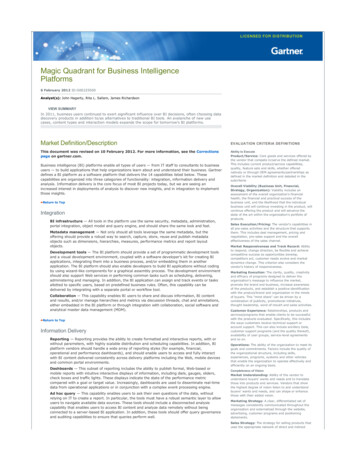
Microsoft Office integration — In some use cases, BI platforms are used as a middle tier tomanage, secure and execute BI tasks, but Microsoft Office (particularly Excel) acts as the BIclient. In these cases, it is vital that the BI vendor provides integration with Microsoft Officeapplications, including support for document and presentation formats, formulas, data "refreshes"and pivot tables. Advanced integration includes cell locking and write-back.Search-based BI — This applies a search index to both structured and unstructured data sourcesand maps them into a classification structure of dimensions and measures (often, but notnecessarily leveraging the BI semantic layer) that users can easily navigate and explore using asearch (Google-like) interface. This capability extends beyond keyword searching of BI platformcontent and metadata.Mobile BI — This capability enables organizations to deliver report and dashboard content tomobile devices (such as smartphones and tablets) in a publishing and/or interactive (bidirectional)mode, and takes advantage of the interaction mode of the device (tapping, swiping and so on)and other capabilities not commonly available on desktops and laptops, such as locationawareness.Return to TopAnalysisOnline analytical processing (OLAP) — This enables end users to analyze data with extremelyfast query and calculation performance, enabling a style of analysis known as "slicing and dicing."Users are (often) able to easily navigate multidimensional drill paths. And they (sometimes) havethe ability to write-back values to a proprietary database for planning and "what if" modelingpurposes. This capability could span a variety of data architectures (such as relational ormultidimensional) and storage architectures (such as disk-based or in-memory).Interactive visualization — This gives users the ability to display numerous aspects of the datamore efficiently by using interactive pictures and charts, instead of rows and columns. Over time,advanced visualization will go beyond just slicing and dicing data to include more process-drivenBI projects, allowing all stakeholders to better understand the workflow through a visualrepresentation.Predictive modeling and data mining — This capability enables organizations to classifycategorical variables and to estimate continuous variables using advanced mathematicaltechniques. BI developers are able to integrate models easily into BI reports, dashboards andanalysis, and business processes.Scorecards — These take the metrics displayed in a dashboard a step further by applying themto a strategy map that aligns key performance indicators (KPIs) with a strategic objective.Scorecard metrics should be linked to related reports and information in order to do furtheranalysis. A scorecard implies the use of a performance management methodology such as SixSigma or a balanced scorecard framework.Return to TopMagic QuadrantFigure 1. Magic Quadrant for Business Intelligence PlatformsSource: Gartner (February 2012)Return to TopVendor Strengths and CautionsARCPLANStrengthssales, marketing, service and communication affiliatesthat extend the scope and depth of market reach,skills, expertise, technologies, services and thecustomer base.Offering (Product) Strategy: The vendor's approachto product development and delivery that emphasizesdifferentiation, functionality, methodology and featuresets as they map to current and future requirements.Business Model: The soundness and logic of thevendor's underlying business proposition.Vertical/Industry Strategy: The vendor's strategyto direct resources, skills and offerings to meet thespecific needs of individual market segments, includingvertical markets.Innovation: Direct, related, complementary andsynergistic layouts of resources, expertise or capital forinvestment, consolidation, defensive or pre-emptivepurposes.Geographic Strategy: The vendor's strategy to directresources, skills and offerings to meet the specificneeds of geographies outside the "home" or nativegeography, either directly or through partners,channels and subsidiaries as appropriate for thatgeography and market.
arcplan's customer base is firmly established in Western and Central Europe, with nearly 90% ofcustomer references based in those sectors. Sixty-five percent are based in Western Europe,compared with an average of 27% for the rest of the survey respondents. 2012 Gartner, Inc. and/or its affiliates. All rightsreserved. Gartner is a registered trademark of Gartner,Inc. or its affiliates. This publication may not beThe top reasons why customers select arcplan are data access and integration (top quartile),reproduced or distributed in any form without Gartner’sfunctionality, and ease of use for end users. Additionally, references indicate that report designprior written permission. The information contained incomplexity is a major contributing factor in selecting this vendor, along with the availability ofthis publication has been obtained from sources believedskills provided by an extensive partner network. Customers rate arcplan's end-user ease of use in to be reliable. Gartner disclaims all warranties as to thethe top quartile, compared with other vendors in this report, and indicate reporting, dashboard,accuracy, completeness or adequacy of such informationand shall have no liability for errors, omissions orand scorecard functionality as being above average. They also use OLAP options moreinadequacies in such information. This publicationaggressively than the average for other vendors in the survey.consists of the opinions of Gartner’s researchThe average tenure of arcplan's customers is 7.2 years, the longest of any vendor in this Magicorganization and should not be construed as statementsQuadrant. This indicates long-term customer satisfaction. However, 10% of customers report aof fact. The opinions expressed herein are subject tochange without notice. Although Gartner research maydefinite plan to replace the software in three years, which tempers this long-term satisfactioninclude a discussion of related legal issues, Gartner doesrating. While the rating is lower than last year's survey response, it is above the average for allnot provide legal advice or services and its researchvendors this year.should not be construed or used as such. Gartner is aarcplan's unified platform incorporates guided and self-service analytics, along with budgeting,public company, and its shareholders may include firmsplanning and forecasting capabilities and integrated search and collaboration functionality. Theand funds that have financial interests in entities coveredin Gartner research. Gartner’s Board of Directors maybreadth of this vendor's platform differentiates it from other pure-play BI vendors in this Magicinclude senior managers of these firms or funds. GartnerQuadrant that lack an integrated planning capability.research is produced independently by its researchorganization without input or influence from these firms,Cautionsfunds or their managers. For further information on theindependence and integrity of Gartner research, seearcplan is considered the BI standard in less than 35% of its reference accounts, near the bottom“Guiding Principles on Independence and Objectivity” onof all vendors in this survey (but nearly double last year's response). A substantial part ofarcplan's business is linked to SAP — 50% of references indicate that it is their ERP standard —and sales and marketing efforts from SAP for BusinessObjects products and the High-PerformanceAnalytic Appliance (HANA) platform must be considered a competitive threat to arcplan's nearand mid-term sales prospects. Interestingly, HANA may also act as an accelerator to arcplan'sgrowth as another source of data for arcplan to analyze.Overall, reference customers scored arcplan's product capability below the average for all vendorsin this survey; Microsoft integration was noted as a particular weakness. Performance concerns,specifically the inability to handle required data volumes, as well as overall system performance,were noted as problem areas with the software. Given relatively small data volumes (less than500 gigabytes [GB] of data on average, in the bottom quartile of survey respondents), this istroubling. It is important to note that arcplan sits on top of existing data sources (for example,SAP NetWeaver Business Warehouse [BW]) that may have performance constraints of their own,making it less clear where performance concerns lie.Scores for product quality, customer experience and platform integration were also below theaverage for all respondents, contributing to less positive execution scores in this year's MagicQuadrant results. arcplan should put a specific plan in place to address concerns over productsand customer experience. It would be unfortunate to lose long-term customer loyalty withoutaddressing the specific issues noted by customers in this survey.Return to TopACTUATEStrengthsIn 2011, Actuate turned an important corner. It has seen multiple consecutive quarters of doubledigit license revenue growth, with a stronger emphasis on Business Intelligence and ReportingTools (BIRT)-based license revenue (marketed as the ActuateOne product line), as well asimproved customer satisfaction ratings in this year's Magic Quadrant survey, largely because amajority of ActuateOne's customers took part. After many years, it appears that the company'sopen-source strategy is finally paying some dividends. While there are differences in responsesfrom clients on older vs. newer product lines, they are less pronounced than last year. This hasresulted in a higher Ability to Execute rating in the Magic Quadrant.The top reasons why companies choose Actuate products are functionality, ease of use fordevelopers, enterprise application integration, and ease of use for end users. The products areoften used to develop information-based applications for internal and external constituents. Infact, support for large numbers of concurrent users was a leading buying motivation for Actuatecustomers — rated No. 1 among all vendors in this survey. While references report a relativelymodest 510 user average, Gartner knows of several implementations where tens of thousands ofconsumers access Actuate-generated content.When complex reporting and development requirements are paramount, Actuate products stackup well against competitors. Reference accounts rated it as the No. 2 vendor overall for thisrequirement.The company has shown more progress in the transition of its product portfolio and customer baseto BIRT-based products. Actuate reports that BIRT license revenue is growing significantly as apercentage of total license revenue, and the BIRT onDemand cloud offering is gaining newcustomers, with 7% of references saying they use it today.X2BIRT (the rebranded Xenos acquisition) allows customers to access and query nontraditional/unstructured data sources including archives, statements and print streams. Whenneeded, this is a critical component.CautionsCustomer references note two problem areas that prevent further deployment of the products:cost and quality of support. Cost has been a perennial concern for Actuate's customers, and itremains one this year, albeit less so than in prior years. Cost is also the No. 1 reason that broaderdeployments are blocked. Quality of support is noted specifically for BIRT products, resulting in alower than average support rating for the firm as a whole. This can be troubling for existingcustomers that are considering a migration from e.Report-based products.
Overall product quality ratings are also lower than the average for all vendors this year, as arecustomer experience and sales execution scores. Fortunately, they are better than last year.Actuate's investment in these areas in 2011 is showing payback; the company must continue toshow improvement in these areas next year to maintain positive momentum in terms of itsexecution.Actuate's customers report using a narrower range of functionality than for other vendors — oneof the lowest in this year's vendor analysis. In addition, only 45% report that they use theproducts as their BI standard, below the average for all vendors, but, again, higher than last year.Based on inquiry and survey results, the company has made progress in changing its reputationas a company that's difficult to work with. Organizations considering Actuate's products shouldcheck references closely to verify the product fit for use case(s) under evaluation. The company'stransition continues; but it's a long haul that will require management attention and superbexecution.Return to TopALTERYXStrengthsA new entrant to the 2012 BI platforms Magic Quadrant, Alteryx (formerly SRC) is based in Irvine,California, and was founded in 1997 with a strong foundation of data integration and advancedanalytic capabilities. Today, it specializes in delivering a business analytic platform to developgeographic-based applications with significant external content input to enrich business decisionmaking. A strong network of partners often develop their own applications using the Alteryxplatform for sale to specific regional and/or industry segments. The product is licensed bysubscription.Customer references indicate that Alteryx's products are used for highly complex analytics onlarge data sources (approximately 5 terabytes [TB] on average). The company received thehighest complexity of use scores (meaning the variety of analytic use cases) of any vendorevaluated in this year's Magic Quadrant. Ad hoc analysis — from simple to complex — is ademonstrated strength and is rated highest by references across all vendors. Predictive analyticsis also highly rated, with many customers using Alteryx products for decision support in sales andmarketing scenarios, including prospect targeting or store placement based on populationdemographics — again, largely based on geographic intelligence.The company's integration heritage is evident, as references indicate that over 60% of data usedin analyses comes from external sources. In addition, the company scores in the highest quartilefor use of unstructured data and use of content analytics. Integration is also one of the primaryreasons that clients choose Alteryx.Reference customers also gave the company above average support and product scores.Additionally, they indicated that the product is selected for its support of large data sources and itsperformance against those large datasets.The company received significant funding in 2011 to expand its sales and marketing efforts and tobroaden its product/company vision to include more analytic scenarios beyond geographicintelligence.CautionsAlteryx is deployed very narrowly within its reference clients, operating on average within singledepartments/functional areas, and with fewer than 50 users per implementation. For surveyrespondents, the most common factor blocking expansion was competition with a BI corporatestandard. Given its relatively narrow geographic use cases, Alteryx is a classic niche vendor. Whilethe company does plan to expand to more sophisticated predictive analytics workbenchcapabilities in 2012 and beyond, today it is a highly specialized product.Given those analytic strengths, customers do have concrete product concerns. They are not happywith the products' data visualization capabilities — rated the lowest of any vendor included in thisyear's Magic Quadrant. Clients note concerns about ease of use for developers and users that arepreventing expansion. With ease of use and data visualization driving many BI evaluations,Alteryx needs to address these criticisms quickly or risk falling behind the market. Directconversations with partners reinforced these survey findings. Better visualization is on the productroad map for 2012.The average tenure of reference customers was 3.5 years — slightly below the average tenure ofall respondents in the Magic Quadrant survey — yet over 10% plan to replace the vendor in thenext three years (or are considering doing so), which is above the average for all respondents.The short tenure and high replacement factors indicate that the products could be used moretactically than those of other vendors in this survey. As a counterpoint, Alteryx customerscontinue to renew their subscriptions at exceptionally high rates.All Alteryx references who responded to the BI Platforms Magic Quadrant reference survey wereNorth American. The company has limited presence outside this market.Return to TopBOARD INTERNATIONALStrengthsBoard International offers a well integrated BI platform that combines planning, reporting andanalysis capabilities in a single integrated product.Historically, Board has focused on developing and deploying custom analytic applications (on thesame foundation as its corporate performance management [CPM] applications). This unifiedapproach remains its key value proposition, and is evident in its usage — at 29%, a higherproportion of Board users are monitoring their performance via a formal scorecard than those ofany other vendor surveyed for this Magic Quadrant.its website,
Board's "toolkit" approach to BI application development handles database creation and updates,data presentation and analysis, and process modeling in a single graphical environment withoutprogramming. This is a differentiator for the company: more Board customers selected it due to aperceived lower implementation cost and effort than for any other on-premises BI vendor (onlypure cloud vendors ranked higher).Board has worked hard in recent releases to deliver an interactive, visually aesthetic experiencefor users (via its extensive use of Windows Presentation Foundation and Silverlight), andcustomers now rate ease of use for end users as the top reason for selecting Board. In fact, whenconsidering overall ease of use (for end users and developers), only data discovery vendors ratedhigher — no mean feat given Board's more traditional OLAP-led approach. Board is innovating atthe back end too, adding new hybrid in-memory technology to its offering in 2011 (see "Need forSpeed Powers In-Memory Business Intelligence").Board's ability to meet both BI and CPM (particularly planning) needs in a single product makes ita strategic choice for the firms using it — it is considered a BI standard by 83% of its surveyedcustomers, the highest of any vendor featured on this Magic Quadrant. Along with this is astrongly positive perception in its customer base regarding Board's future as their BI supplier.CautionsBoard offers a functionally complete and capable BI product. However, survey feedback fromBoard's customers about its BI platform functionality fell below the average in most areas thisyear. Its customers rated it above or close to average in four functional capabilities: reporting,dashboards, development tools and BI infrastructure.Board's customers also report below average product quality (with the lowest rating of any vendoron the Magic Quadrant this year). This, taken in combination with customer support rated in thelowest quartile, amounts to a diminished customer experience for Board users. It should be notedthat innovation, and the kind of growth experienced by Board in 2011, can be disruptive to anexisting customer base. According to the vendor it is likely that its customers are experiencingissues with the quality of its latest versions, due to the functional innovation they contain. If this iscorrect, the issues with customer experience should be short-term.Board's core markets are in Europe, with emergent adoption elsewhere. Board is looking to growits global presence — it now has operations in 12 countries worldwide, adding three new ones in2011 in China, Japan and Mexico. However, its direct presence tends to be limited outside Europe— it has less than 10 full-time equivalents in the U.S., for example.Firms considering Board should talk to references that can vouch for its use at scale. It's evidentthat Board's customers are smaller firms on average, and its deployments are among the smallestof the vendors covered in this Magic Quadrant. The Board customers surveyed had 139 users onaverage, compared to the survey average of 1,176 users. Board is getting traction in some largerfirms (notable recent wins include Puma, Triumph, Giorgio Armani and Nike US), so this surveyfinding may reflect historical buying patterns rather than technical limitation.Board's technology remains Windows-only, which limits its potential to expand into somesegments of the enterprise market.Return to TopIBMStrengthsIBM maintains its leading position on the Completeness of Vision axis for this year's MagicQuadrant. The company takes a holistic approach to what it calls Business Analytics andOptimization (BAO), combining comprehensive software, hardware and services in a coordinatedmarket offering. IBM's business analytics software portfolio includes a unified BI, analytics andperformance management platform, and is complemented by IBM information managementsoftware and appliances (Netezza, for example). Services are made up of a consulting line ofnearly 9,000 people, which is a growing part of IBM Global Business Services (GBS). IBM can offerboth a tools-based and/or a solution-driven offering, along with significant vertical expertise, tocustomers and prospects.In 4Q10, IBM introduced its latest business analytics platform, IBM Cognos 10. Throughout 2011,additional capabilities have been released and customer adoption has begun in earnest. Cognos 10references who responded to this year's Magic Quadrant survey painted a very interestingsnapshot — on average nearly 4,000 users, over 12 TB of data, broad functional use, and veryhigh platform integration scores, all at or near the top of all ratings for all vendors in this report.Overall, Cognos 10 references were significantly more satisfied than Cognos 8 customers, whowere the majority of IBM's survey respondents. While some indicated that upgrading from Cognos8 to Cognos 10 had some complexity, the majority rated it as straightforward or verystraightforward. This bodes well for IBM's future ability to execute, providing the firm deliverssuperior service and support and problem-free software.The average tenure of IBM respondents was seven years, second highest of all vendors in thissurvey. Gartner often hears this long-standing customer commitment in inquiry, and thisrepresents a strong customer loyalty factor. This year, less than 7% of references noted that theyare planning to discontinue use of th
Metadata management —Not only should all tools leverage the same metadata, but the offering should provide a robust way to search, capture, store, reuse and publish metadata . client. In these cases, it is vital that the BI vendor provides integration with Microsoft Office . Magic Quadrant for Business Intelligence Platforms Source .