Transcription
Collaborative Knowledge Visualization Case Study SeriesCase Nr. 2, 2008GARTNER’S MAGIC QUADRANT and HYPE CYCLESabrina Bresciani, Martin J. EpplerAbstractThe analyst and consultancy company Gartner has developed several diagrams that havebecome widely used graphic forms and standard tools for evaluation and decision makingsupport in organizations. This case study presents their most famous diagrams, the MagicQuadrant and the Hype Cycle. The magic quadrant is a matrix that synthesizes informationabout vendors and service providers, while the Hype Cycle summarizes the life cycle statusof different technologies in a domain. The case study highlights the benefits and risks ofsuch visualizations, the typical uses and similar forms created by users and competitors.Future possible developments of the diagrams conclude the case study.This case study has been written in 2008 by Sabrina Bresciani under the supervision ofProf. Martin J. Eppler. It is intended as a basis for class discussion and highlights theinnovative use of visualization for business purposes. 2008 Sabrina Bresciani and Martin Eppler. All rights reserved.1
1. IntroductionThis case study focuses on two famous and widely used graphics, produced by the analysis and advisorycompany Gartner. The Magic Quadrant is a matrix of information about vendors and service providers: aMagic Quadrant diagram for a specific industry can be purchased from Gartner, and it is typically used incompanies to assess potential suppliers, understand the competition or their own positioning.The Hype Cycle is a graphic representation of the maturity, adoption and business application of specificinformation and communication technologies. Companies buy and use the Hype Cycle graphs to supporttheir decision making regarding IT investments.Both diagrams have been invented by Gartner and have reached a wide use in corporations. This case studydescribes each one of the diagrams, their typical use, and also the diffusion that these graphic forms hadbeyond the company itself, as a testimony of their success. We will also present a formal analysis of thediagrams through the collaborative dimensions of visualization framework. In the next section we present anoverview of Gartner.2. The corporate context of Gartner“Research is the kernel of Gartner.” Bob Knapp, CMO GartnerGartner Inc. (Gartner) is the largest research and advisory firm of the information technology industryworldwide. Established in 1979 it currently serves 10,000 organizations in 75 countries. It has 4’000employees, of which 1’200 are analysts and consultants. The average amount spent by each client is around18’000 US . Gartner’s headquarters are in Stamford, Connecticut and it is a listed company (NYSE:IT) since1986, with revenues (2007) of US 1.2 Billion. In April 2005 it acquired the META group [1].Gartner focuses on delivering objective, in-depth analysis and actionable advice to enable clients to makemore informed business and technology decisions. Gartner seeks to support CIOs to improve their companiesand IT managers to optimize IT infrastructure. Garner Executive Program is the world’s largest CIOcommunity with 1’400 CIOs in 30 countries, who receive customized advice and participate in peerexchange opportunities through the membership to the Program. Garner also organizes 74 annual events,being the largest IT conference provider in the world. Major magazines and newspapers such as The WallStreet Journal, The Economist and The Financial Times quote Gartner an average of 70 times every week.Gartner faces a number of competitors, different ones for its different activities. However, often companiessubscribe to more than one research company to get a more balanced view, and Gartner, being the biggestanalyst in the IT-sector, is usually selected. As far as research is concerned its main competitor is Forrester.For quantitative market research, its major competitors are the International Data Corporation (IDC) and theYankee Group. For the consulting domain the competitors include Accenture, Ernst & Young, BostonConsulting Group, McKinsey & Company and others. The measurement branch of Gartner does not havemajor competitors, apart from Compass.Gartner also publishes books with Harvard Business School Press and John Wiley & Sons on IT andbusiness topics. Since the beginning of 2006 Gartner is also publishing (on its website) a number ofPodcasts, called “Gartner Voice. Podcasts for Business and IT Professionals”. It also has numerousCorporate Blogs ranging from the topic of Windows Vista, Future Predictions, Media, Government,Innovation to the Ombudsman Office, where clients can discuss problems and post their comments.2
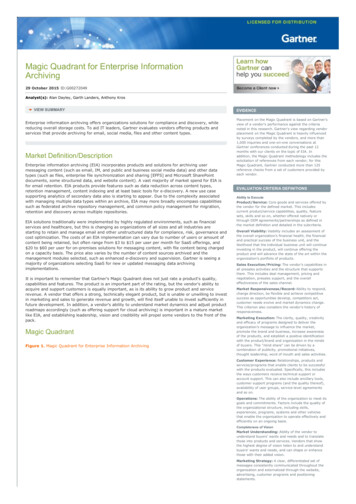
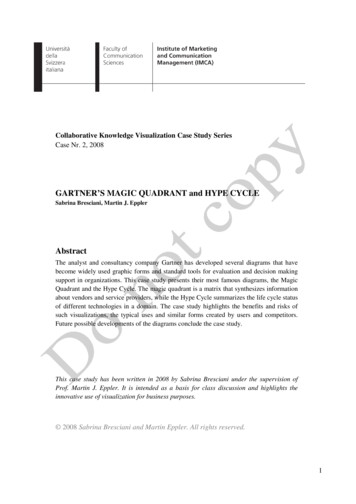
3. Gartner Magic Quadrant3.1 DescriptionThe Magic Quadrant is a tool to understand vendors or service providers positioning and expectations [1]:the figure below (Fig. 1) shows a typical example. The two-dimensional graphical framework places vendorsof a specific industry sector into a strategic matrix. Gartner analysts use multiple objective and subjectivecriteria to evaluate individual vendors, presented on two axes: Ability to Execute and Completeness of Vision.These parameters, expressed graphically, create four quadrants: Leaders, Challengers, Visionaries and NichePlayers. The result of the analysis shows the ability of the vendor to provide services in relation tocompetitors, and what to expect for the future. A magic quadrant can be seen as a visual strategic planningassumption. Strategic assumptions designate qualified predictions about an industry’s future development.Quoting Soejarto and Hostmann [2]:The Magic Quadrant is a graphical representation of a marketplace at and for a specific time period.It depicts Gartner's analysis of how certain vendors measure against criteria for that marketplace.Figure 1. The Magic QuadrantThe Magic Quadrant is intended as a research tool and not as a guide to action. Gartner points out that theyare not advising clients to focus only on the Leaders category or reject the Niche Players, because in certainsituations the latter’s products can be a more appropriate tactical choice [3]. The magic quadrant is asnapshot of a current situation.The parameters that define the diagram axes are evaluated by a series of elements, as shown in Table 1. Inparticular, Ability to Execute represents the vendor’s ability to execute its vision, i.e. the vendors’ financialstability, the depth and breadth of services offered, the ability to satisfy clients needs, the installed productbase in the market, service and support reputation. The Completeness of Vision represents a vendor’s strategicvision, measuring its knowledge of the market, of key market trends and of customers, the allocation ofresources and skill building, the investment in R&D, the quality of methodologies, alliances and partnerships.3
Product/ServiceOverall Viability(Business Unit,Financial, Strategy,Organization)Sales Execution/PricingMarket Responsivenessand Track RecordMarketing ExecutionCustomer ExperienceOperationsMarket UnderstandingMarketing StrategySales StrategyOffering (Product)StrategyBusiness ModelVertical/IndustryStrategyInnovationGeographic StrategyAbility to ExecuteCore goods and services offered by the vendor that compete in/serve the defined market.This includes current product/service capabilities, quality, feature sets, skills, etc., whetheroffered natively or through OEM agreements/partnerships as defined in the marketdefinition and detailed in the sub-criteriaViability includes an assessment of the overall organization's financial health, the financialand practical success of the business unit, and the likelihood of the individual business unitto continue investing in the product, to continue offering the product and to advance thestate of the art within the organization's portfolio of productsThe vendor's capabilities in all pre-sales activities and the structure that supports them.This includes deal management, pricing and negotiation, pre-sales support and the overalleffectiveness of the sales channelAbility to respond, change direction, be flexible and achieve competitive success asopportunities develop, competitors act, customer needs evolve and market dynamicschange. This criterion also considers the vendor's history of responsivenessThe clarity, quality, creativity and efficacy of programs designed to deliver theorganization's message in order to influence the market, promote the brand and business,increase awareness of the products, and establish a positive identification with theproduct/brand and organization in the minds of buyers. This "mind share" can be driven bya combination of publicity, promotional, thought leadership, word-of mouth and salesactivitiesRelationships, products and services/programs that enable clients to be successful with theproducts evaluated. Specifically, this includes the ways customers receive technicalsupport or account support. This can also include ancillary tools, customer supportprograms (and the quality thereof), availability of user groups, service-level agreements.The ability of the organization to meet its goals and commitments. Factors include thequality of the organizational structure including skills, experiences, programs, systems andother vehicles that enable the organization to operate effectively and efficiently on anongoing basisCompleteness of VisionAbility of the vendor to understand buyers' wants and needs and to translate those intoproducts and services. Vendors that show the highest degree of vision listen andunderstand buyers' wants and needs, and can shape or enhance those with their addedvisionA clear, differentiated set of messages consistently communicated throughout theorganization and externalized through the Web site, advertising, customer programs andpositioning statementsThe strategy for selling product that uses the appropriate network of direct and indirectsales, marketing, service and communication affiliates that extend the scope and depth ofmarket reach, skills, expertise, technologies, services and the customer baseThe vendor's approach to product development and delivery that emphasizesdifferentiation, functionality, methodology and feature set as they map to current andfuture requirementsThe soundness and logic of the vendor's underlying business propositionThe vendor's strategy to direct resources, skills and offerings to meet the specific needs ofindividual market segments, including verticalsDirect, related, complementary and synergistic layouts of resources, expertise or capitalfor investment, consolidation, defensive or pre-emptive purposesThe vendor's strategy to direct resources, skills and offerings to meet the specific needs ofgeographies outside the "home" or native geography, either directly or through partners,channels and subsidiaries as appropriate for that geography and marketTable 1. Magic Quadrant evaluation criteria [1]4
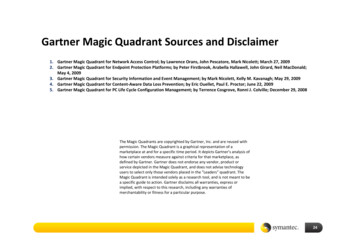
Analyzed companies that perform well in ability to execute and have high completeness of vision arelabelled Leaders (top-right quadrant): these vendors not only meet the current demands of the market, butalso demonstrate vision to sustain their position. They normally have a high visibility on the market andsatisfied customers, but they could be unsuccessful in meeting highly specialized needs of specific segments.Challengers are vendors that have high ability to execute but lower completeness of vision (top-leftquadrant). They normally have the necessary scale and financial resources, but lack innovation and aprospective understanding of the market.Companies in the bottom-right quadrant are labelled Visionaries: they do not have strong ability toexecute but have a complete vision of the market. They often introduce innovation of products or techniques,but they may lack financial strength.The last quadrant, bottom-left, is labelled Niche players and includes vendors that have a limited ability toexecute and do not have a broad vision. Typically these vendors are new entrants or are focused only on ageographic region or industry fragment.DevelopmentFollowing the acquisition of META group in April 2005, Gartner announced the enhancement of the MagicQuadrant research methodologies and processes. A team of analysts reviewed Gartner and META Groupanalysis tools and developed new tools and templates, reflecting the best practices from each company. Oneof the introduced innovations in the new version of the Magic Quadrant, is that it allows to click interactivelyon the vendor pins to get more information.To sustain the success of its frameworks, Gartner created a specific brand for the Magic Quadrant and itsother well-know products, as showed in figure 2.Figure 2. Magic Quadrants logo [1]Target group and degree of diffusionThe typical users of Gartner Magic Quadrant are managers, IT managers and CIOs in corporations,government agencies, technology companies as well as the investment community. The diagram is used tounderstand where a company is positioned with respect to its competition, to see the trends for the future, tosupport or validate investment plans, and finally to take strategic decisions. It is mainly purchased bymedium or large corporations. Possibly no other company has introduced such a persuasive and successfulvisualization: the Magic Quadrant is widely used, but also copied and applied to various other fields. It istypically used in companies when facing a major decision, as Gartner research is considered as a reliablesource on which to base decisions for future investments and the Magic Quadrant offers a quick and easy tounderstand framework for discussion.ExamplesBelow are various examples of Magic Quadrants in order to explain how the format is used and how itworks. Figure 3 represents a Magic Quadrant developed in 2006 for Unified Communications (Fig. 3).Gartner defines unified communications as products that enhance individual, workgroup, and organizationalproductivity by enabling and facilitating the control, management, integration and use of multiple enterprisecommunication methods. The Ability to Execute is defined as having good products’ quality and efficacy thatenhance individual and enterprise communication. The Completeness of Vision is the ability to articulate5
logical statements about current and future market direction, innovation, customer needs and competitiveforces.Looking at the diagram, in the Leaders quadrant, we find the most well-known ITC companies such asMicrosoft and Cisco Systems: these companies offer comprehensive and integrated products that address arange of market needs. In addition, they have clear evolution plans for their products. In the Challengersquadrant we find products that are not fully mature, but have the potential to improve. It is interesting tonotice that IBM is positioned in this quadrant. In the Niche Players quadrant we find companies like NECand Ericsson: these vendors offer individual, stand-alone components, but do not have a consolidatedproduct yet. Finally, in the Visionary quadrant we find players that have a clear understanding of the market,but have limited ability to execute across the entire set of communication requirements.In this diagram we find a very even distribution of companies, but this is not always the case, as it can beobserved in the example of CRM External Service Providers (Fig. 4).Figure 3. Unified Communications Magic QuadrantFigure 4. CRM External Service Providers MagicQuadrantCustomers’ point of viewOne typical use of the Gartner Magic Quadrant is in groups of 6-8 people: the Magic Quadrant is projectedor presented inside Power Point presentations. There is no interaction with the diagram, just observation anda conversation around it.The motivation for using the Magic Quadrant is to legitimate decisions, for example to justify thesubstitution of a software package, to support decisions and to validate an argument. In the opinion of someinterviewed Magic Quadrant users, it has the advantage to be “useful and compact”, but with the drawback toseem more objective than it actually is; it seems “statistically proven”, there is no argumentation around itbecause it is considered as the truth. In the words of one IT manager: “It’s easy to judge because it’s soimmediate, but it can lead to rather dangerous conclusions.”3.2 Imitations and similar formsThe extensive diffusion of Gartner’s Magic Quadrant can be illustrated by the large number of imitations andsimilar forms that have been developed over the last years. Forrester’s Wave (Fig. 5) is probably the most6
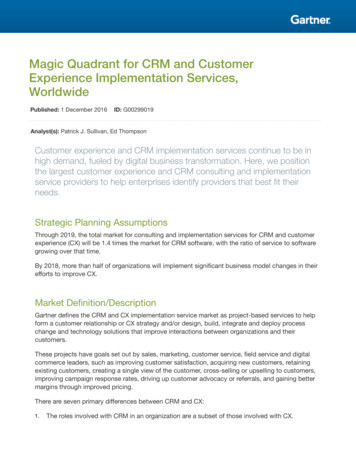
similar visualization, as the two axes of the diagram track nearly the same data: Current Offeringcorresponds to the Magic Quadrant’s Ability to Execute, and Strategy corresponds to Completeness of Vision.It is interesting to notice, however, that the Forrester diagram has a third dimension, represented by the sizeof the circle representing the companies, corresponding to their market presence. The biggest differencebetween the two diagrams is that Gartner divides the diagram into quadrants, whereas Forrester’s Waveshave a different grouping schema (Fig. 6). The companies on the top right and on the bottom left section ofthe diagram are grouped together on both diagrams, while the remaining ones are aggregated differently. Thetop right quadrant is also named leader in both visualizations.Figure 5. Forrester’s Wave [5]Figure 6. Comparison of Gartner Magic Quadrant and Forrester’s WaveGartner Magic Quadrant is such a popular diagram that people around the globe have generated a number ofunofficial imitations and similar forms and share them mainly through the Web, in particular in Blogs.7
Some authors have created their own Magic Quadrant versions, such as Toby Ward, who also changed theaxes of the matrix slightly and published a variation of the diagram in his blog [6]. Some users have evenproposed improved versions of the original Magic Quadrant. Vincent McBurney (a consultant) superimposedthe Magic Quadrant for two subsequent years, and thus tracked the evolution of the firms. He also added thecolor dimension, using the convention of green for companies who have improved their positioning, and redfor those who have dropped. In the example below, the darker circles show a firm’s 2005 position, while thelight dots refer to the 2006 position (Fig. 7).Figure 7. Magic Quadrant improvement [7]Other users are more critical toward the widespread interpretation of the diagram: Andreas Bitterer, coauthor of an article published by Gartner, explains in his blog how the Magic Quadrant is often (mis-)interpreted, through an ad-hoc example that he created about the car market (Fig. 8).Figure 8. Magic Quadrant imitation [8]“Does this quadrant answer the question which car to buy? If every potential car buyer would basethe decision solely on positions on a graphic, we'd all be driving the same car. The fact that we arenot, shows that there are vendors for different requirements, budgets, use cases, etc. The sameapplies for every software market ( ).” [8]8
3.3 Evaluation: benefits and risksEvaluating the Magic Quadrant format with the use of the collaborative dimensions [10] leads to thefollowing profile (Fig. 9):Figure 9. Collaborative Dimensions Framework of the Magic QuadrantThe Magic Quadrant diagram is characterized by a rather high clarity and a not very strong visual impact:this translates into a highly functional visualization, without any distracting decoration. It presents extremelyhigh perceived finishedness, meaning that the users perceive this diagram as highly polished and definitive.In fact, from our interviews with users of the diagram, it emerged that it is rarely questioned. This perceptionis supported by the fact that the Magic Quadrant cannot be modified and therefore does not give theaffordance to the users to modify or question it. This could be risky because Gartner’s analysis is oftenconsidered by professionals as the unquestionable truth, while it is actually only a very structured, somewhatsubjective evaluation. Gartner’s Magic Quadrant, even in its digital (Flash) form, does not allow for anymodifications, not even writing notes on it, or to highlight certain parts (low directed focus and low discoursemanagement). Therefore the Magic Quadrant offers low support for group discussion and collaboration.The diagram has several advantages, for instance it is easy to understand at first sight, it presents acondensed form of information without overloading the reader, it provides a good basis for comparison(between the various firms analyzed) and it allows to have both the big picture of the industry situation, andto focus on the situation of a particular area (as for example, niche players).By contrast, the main disadvantage of the Magic Quadrant is its very high perceived finishedness that makesit appear extremely reliable. Secondly, it does not provide an adequate support for group discussion aroundthe diagram.9
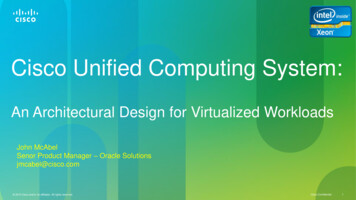
4. Hype cycle4.1 DescriptionHype Cycles offer a snapshot of the relative maturity of technologies, IT methodologies and managementdisciplines. They highlight overhyped areas against those that are high impact, estimate how longtechnologies and trends will take to reach maturity, and help organizations decide when to adopt [11].Gartner's Hype Cycle (Fig. 10), introduced in 1995, characterizes the typical progression of an emergingtechnology, from over-enthusiasm through a period of disillusionment to an eventual understanding of thetechnology's relevance and role in a market or domain. It has a simple and clear message: companies shouldnot invest in a technology just because it is being hyped, nor should they ignore a technology just because itis not living up to early over-expectations.Figure 10. A Gartner Hype CycleGartner explains [11] that its analysts position technologies on the Hype Cycle based on a consensusassessment of hype and maturity. During the first part of the Hype Cycle, when there are many uncertaintiesregarding a technology, its position on the hype cycle is guided more by its hype levels than its perceivedmaturity. At the later stages, as more information about maturity, performance and adoption becomesavailable, hype plays a lesser role in determining the technology's position on the Hype Cycle.Technologies do not move at a uniform speed through the Hype Cycle. To represent the varying speeds, alltechnologies on the Hype Cycle are assigned to a category representing how long they will take to reach thePlateau of Productivity from their current position on the Hype Cycle — that is, how far they are from thestart of mainstream adoption (triangle icon, colored or empty circles).Hype Cycles enable technology planners to compare their understanding of technologies' evolution againstGartner's analysis of the technologies' maturity in order to decide when to invest in a technology. If acompany launches its efforts too soon, it will suffer unnecessarily through the painful and expensive lessonsassociated with deploying an immature technology. If it delays action for too long, it runs the even-greaterrisk of being left behind by competitors that have succeeded in making the technology work to theiradvantage.The Hype Cycle thus states: enterprises should not invest in a technology just because it is being hyped, norshould they ignore a technology just because it is not living up to early over-expectations. Rather, theyshould be selectively aggressive and move early with technologies that are potentially beneficial to theirbusiness. For technologies that are of lower impact, organizations can let others learn the hard lessons,10
putting off their own adoption until the technology is more mature [11]. Below is a description of the fivephases of the cycle in more detail.The five phases of a Hype CycleGartner writes [11] that each Hype Cycle is characterized by the following five phases:1. "Technology Trigger": the first phase of a Hype Cycle is the "technology trigger" or breakthrough, productlaunch or other event that generates significant press coverage and interest.2. "Peak of Inflated Expectations": in the next phase, a frenzy of publicity typically generates overenthusiasm and unrealistic expectations. There may be some successful applications of a technology, butthere are typically more failures.3. "Trough of Disillusionment": technologies enter the "trough of disillusionment" because they fail to meetexpectations and quickly become unfashionable. Consequently, the press usually abandons the topic and thetechnology.4. "Slope of Enlightenment": although the press may have stopped covering the technology, some businessescontinue through the "slope of enlightenment" and experiment to understand the benefits and practicalapplication of the technology.5. "Plateau of Productivity": a technology reaches the "plateau of productivity" as the benefits of it becomewidely demonstrated and accepted. The technology becomes increasingly stable and evolves in second andthird generations. The final height of the plateau varies according to whether the technology is broadlyapplicable or benefits only a niche market.The Hype Cycle ends at the Plateau of Productivity, where mainstream adoption of the technology surges.Gartner research [12] differentiates between three different speeds of the technologies development along thecycle. For visualization purposes, these different speeds have been normalized so they will all fit in one HypeCycle graphic, and they are represented by different colors and graphic symbols on the cycle.“Fast-Track” technologies will mature within two to four years. These technologies are often adoptedwithout much fanfare, catching many companies unprepared for their sudden maturity and applicability.Examples include instant messaging, SMS, USB.“Normal” technologies with relatively few inhibitors usually traverse the cycle in five to eight years.“Long-Fuse” technologies may take one or two decades to traverse the Hype Cycle. Examples include email, the Internet, and nanotechnology. Indicators: A “science fiction” style fascination with potentialapplications of the technology, far ahead of its capabilities. Examples include artificial intelligence,nanocomputing and speech recognition. They rely on a new infrastructure (known as an ecosystem) that willtake time to evolve.DevelopmentSince 1995, Gartner has used Hype Cycles to characterize the over-enthusiasm or "hype" and subsequentdisappointment that typically happens with the introduction of new technologies.Jackie Fenn, inventor of the Hype Cycle stated in an interview: “The hype cycle was started as a singleGartner research note I published in 1995, making the observation that technologies tend to follow this cycleof over-enthusiasm and disillusionment, prior to a deeper understanding of where they really apply. I addedsome examples of technologies on to the chart to illustrate the point. The following year, I started gettingrequests from clients to "update" the hype cycle with the current year's emerging technologies, which I did,and it became an annual event. In parallel, other analysts within Gartner started using it to drill down intospecific sub-domains, for example a mobile and wireless hype cycle, or a security hype cycle. It was alsoapplied to track the progress of a single technology or trend through the hype cycle over time. More recently,we have started to address hype cycles in a more consistent way and are currently putting together our11
second "Hype Cycle special report" which creates about 40 hype cycles from across Gartner's IT andbusiness coverage.”Jackie Fenn and Alex Linden now lead a team of over 100 analysts: they select and analyze more than 500technologies from technical, business application and industry vertical perspectives to produce a series ofHype Cycles.Like for the Magic Quadrants, Gartner has developed a specific product brand (Fig. 11) for the Hype Cycles.Figure 11. The Hype Cycles logo [1]Behind the Hype CycleGartner asserts [11] that, in looking at the rationale for the Hype Cycle, it becomes clear that the cycle is notso much about technology as it is about human attitudes toward innovation. The same Hype Cycle applies tonew business models and management approaches, and to consumer phenomena such as rising movie ormusic stars. Investors are intensely aware of the hype effect as a new company gains popularity andvisibility.As with other subjective metrics such as stock prices, part of the public's perception of the value of atechnology comes from pure speculation or promise (that is, the benefit that people feel the technology mightsomeday deliver), and part comes from the real engineering or business maturity as perceived in the form ofreal experiences. Both factors evolve over time (Fig. 12).Figure 12. Components of the Hype Cycle [11]Excitement is a psychological factor that occurs in a rush, rises to a peak and eventually dies down, whilereal maturity (for example of a product) builds slowly via development and use. Normally, there is a handofffrom potential to maturity, as real experience takes the place of speculation as the primary determinant of thepublic mind-set. Combining the two curves yields the Hype Cycle, with the hype preceding real capability,resulting in the phases of expectation, disillusionment and maturation (The observation that hype precedesmaturity has been noted by Howard Fosdick and others) [11].Target group and degree of diffusionHype Cycles are typically used in managerial meetings, to support decisions on IT investments. The diagramis projected (Fig.13) and the discussion revolves around it, similarly to the Magic Quadrant.A Hype Cycle report is about 30-40 pages and costs around US 1’995 for non-subscribers. It is widely usedin large corporations to support strategic decision making around technological investments. It is mainly12
used by IT teams
The Magic Quadrant is a graphical representation of a marketplace at and for a specific time period. It depicts Gartner's analysis of how certain vendors measure against criteria for that marketplace. Figure 1. The Magic Quadrant The Magic Quadrant is intended as a research tool and not as a guide to action. Gartner points out that they