Transcription
GEOPHYSICAL RESEARCH LETTERS, VOL. 40, doi:10.1002/GRL.50108, 2013Irrigation in California’s Central Valley strengthens the southwesternU.S. water cycleMin-Hui Lo1,2 and James S. Famiglietti1,3Received 25 October 2012; revised 17 December 2012; accepted 20 December 2012.either by changes in local ET or by changes in lateral watervapor transport. Consequently, irrigation usually has a firstorder effect on local surface energy and water budget partitioning [Cook et al., 2011], because increased soil wetnessleads to increased ET [Pielke, 2001; Adegoke et al., 2003;Bonfils and Lobell, 2007; Kueppers et al., 2007; Lobellet al., 2009; Sacks et al., 2009; Ozdogan et al., 2010]. Irrigation also has a second-order effect on the atmospheric circulation, which is more uncertain and has potential impactsover a larger area [Yeh et al., 1984; DeAngelis et al., 2010;Puma and Cook, 2010].[4] Regional climate models have been used to explore theimpacts of irrigation in the Central Valley on local and regionalclimates [Kueppers et al., 2008; Sorooshian et al., 2011].However, imposed lateral boundary conditions in regionalclimate models may limit simulated irrigation impacts byeliminating teleconnection effects through the atmosphere,making the second-order effects difficult or impossible toidentify. Given the one-way nature of interactions simulatedin regional models, as well as uncertainty in the imposedboundary forcing, global climate model simulations are animportant step forward in understanding the full role of irrigation in climate system feedback, especially for characterizingthe remote effects from a large, individual irrigated region.[5] The Central Valley is one of the largest irrigatedregions in the world, with 52,000 km2 of irrigated area [Famiglietti et al., 2011]. Irrigation in the Central Valley reliesboth on managed, surface water deliveries and on groundwater withdrawal from the underlying, regional aquifer system[Faunt, 2009; Siebert et al., 2010]. How the excess in ETfrom irrigation affects the local and regional climate is thusof great interest and will help establish the human fingerprintof water management practices. In this study, we explore theimportance of Central Valley irrigation in regional precipitation changes, including its role in enhancing land-atmosphere interactions in the southwestern United States.[1] Characterizing climatological and hydrological responsesto agricultural irrigation continues to be an important challengeto understanding the full impact of water management on theEarth’s environment and hydrological cycle. In this study, weuse a global climate model, combined with realistic estimatesof regional agricultural water use, to simulate the local andremote impacts of irrigation in California’s Central Valley.We demonstrate a clear mechanism that the resultingincrease in evapotranspiration and water vapor exportsignificantly impacts the atmospheric circulation in thesouthwestern United States, including strengthening theregional hydrological cycle. We also identify that irrigationin the Central Valley initiates a previously unknown,anthropogenic loop in the regional hydrological cycle, inwhich summer precipitation is increased by 15%, causing acorresponding increase in Colorado River streamflow of 30%. Ultimately, some of this additional streamflow isreturned to California via managed diversions through theColorado River aqueduct and the All-American Canal.Citation: Lo, M.-H., and J. S. Famiglietti (2013), Irrigation inCalifornia’s Central Valley strengthens the southwestern U.S. watercycle, Geophys. Res. Lett., 40, doi:10.1002/grl.501081. Introduction[2] California’s Central Valley is the most productiveagricultural region in the United States and one of the mostproductive in the world. It accounts for one sixth of thecountry’s irrigated land [Faunt, 2009]. Because it is subjectto intensive irrigation, the Central Valley is part of a uniqueand heavily managed hydrological system. A recent U.S.Geological Survey report on the water budget of the CentralValley showed that annual evapotranspiration (ET)exceeds annual precipitation by 60% [Faunt, 2009].This excess in ET, derived largely from irrigation, can havesubstantial effects on the local climate [Lobell et al., 2009;Sorooshian et al., 2011], including net land surface cooling[Kueppers et al., 2008].[3] Previous studies [Kanamitsu and Mo, 2003; Mo, 2008]have demonstrated that soil moisture can affect precipitation2. Model and Data Sets[6] We use the NCAR Community Atmosphere Model(CAM) version 3.5 [Gent et al., 2009] combined with the Community Land Model (CLM) version 3.5 [Oleson et al., 2008].Two online experiments conducted with CAM version 3.5are presented here: an Irrigation run and a Control run. In theIrrigation run, two extra anthropogenic fluxes, surface waterdeliveries and groundwater withdrawal, are represented inthe CLM version 3.5 and only within the Central Valley.Specifically, the Irrigation run isolates only the impacts ofirrigation without considering land-cover and land-usechanges. As a result, the impacts of irrigation in the CentralValley on climate can be identified by differences (anomalies)between the two experiments.All Supporting Information may be found in the online version of thisarticle.1UC Center for Hydrologic Modeling, University of California, Irvine,California, USA.2Department of Atmospheric Sciences, National Taiwan University,Taipei, Taiwan.3Department of Earth System Science, University of California, Irvine,California, USA.Corresponding author: J. S. Famiglietti, University of California, Irvine,CA 92697, USA. (jfamigli@uci.edu) 2012. American Geophysical Union. All Rights Reserved.0094-8276/13/10.1002/grl.501081
LO AND FAMIGLIETTI: CENTRAL VALLEY IRRIGATION STRENGTHENS U. S. MONSOON[7] Simulations are performed at T85 resolution ( 1.4 1.4 ) with 26 vertical hybrid coordinate levels. Initial conditions of water table depth and soil moisture profile are estimated by the fitting approach of Lo and Famiglietti[2010]. The simulation produces global monthly outputsover a 90-year period and is forced by climatological sea surface temperatures and sea ice concentrations [Hurrell et al.,2008]. To remove the effects of uncertain initial and boundaryconditions, the first 45 simulated years are treated as spin-up,and the latter 45 years are used for the analysis.[8] We used the irrigation water demand from agricultureand climate data sets [Wisser et al., 2008], in which theannual mean total irrigation water requirement in the CentralValley is 350 mm and is supplied entirely by surface waterdeliveries and groundwater withdrawal. The groundwatercontribution to total irrigation water in the Central Valleyis 40% [Siebert et al., 2010] based on the area equippedfor irrigation use; hence, in this study, we assume surfacewater delivery of 210 mm yr-1 and groundwater withdrawalof 140 mm yr-1 in the model (see details in the Supplementary Information).precipitation anomalies observed in the southwestern UnitedStates. This study, therefore, will focus on the southwesternUnited States (the purple rectangular box in Figure 1b),where the precipitation changes are significant at the 90%level and have anomaly ratios [(Irrigation run - Controlrun) / Control run] ranging from 10% to 20%. This regioncovers most of the Colorado River Basin, a critically important river basin for water resources management in thesouthwestern United States and California, and also includesthe southwestern U.S. monsoon area.[13] The increase of water vapor in the lower troposphereresults in positive atmospheric moist static energy (MSE)anomalies (Figure 1e), which is defined asMSE ¼ Cp T þ Lv q þ gz;(1)-1-1where Cp is the specific heat at constant pressure (J kg K ),T is temperature (K), Lv is the latent heat of vaporization at0 C (J kg-1), q is the specific humidity (kg kg-1), g is thegravitational acceleration (m s-2), and z is height (m).Figure 1f (the vertical profile of changes in MSE averagedinside the rectangular box) shows that higher MSE in thelower troposphere reduces moist static stability, whichincreases convective instability [Eltahir, 1998] in the Irrigation run. This instability leads to an initial increase in precipitation in the southwestern United States shown in Figure 1d.[14] The vertically integrated atmospheric moisturebudget equation is also used to explore precipitation anomalies in Figure 1d:3. Results[9] In simulations with irrigation, averaged total ET overthe Central Valley increases significantly (149 mm or100%) during the summer as indicated in Figure 1a, whichshows the climatology of ET for the Control and Irrigationruns. Most of the increase in ET occurs between May andOctober, the months during which a total of 350 mm ofirrigation water was applied. In the absence of irrigation, ETin the Central Valley is typically soil-water limited duringthe summer, that is, there is abundant solar radiation, but thelack of available soil-water significantly limits ET rates. However, when irrigation water is applied, ET can increase substantially as the land surface transitions to an energy-limitedstate, as shown by the Irrigation run in Figure 1a.[10] Because of the prevailing atmospheric circulation inthe lower troposphere during the summer, water vapor inthe Central Valley is partially transported to the southwestern United States (Figures 1b and 1c). Tracer experimentsimulations (see Figure S1 and Animation S1 in the Supporting Information) confirm this and indicate that the tracermixing ratio has increased significantly throughout thesouthwestern United States. Furthermore, Figure 1b showswater vapor flux anomalies (Irrigation run - Control run),which demonstrate that water vapor from excess ET is transported to the southwestern United States.[11] Figure 1c shows the changes in the spatial distributionof low-level (the first three atmospheric layers in the sigmavertical coordinate, which varies from 975 to 850 mb) watervapor due to irrigation for the 45-year average for June, July,and August. Only statistically significant differences areshown. Low-level water vapor increases the most overCalifornia, where the irrigation occurs. Although atmospheric water vapor increases due to enhanced ET duringthe summer, the Central Valley lies beneath the descendingbranch of the large-scale circulation, which inhibits theoccurrence of precipitation there, as shown in Figure 1d.[12] However, the remote effects of irrigation on precipitation can be clearly seen from Figure 1d. Figure 1c andFigure S1 suggest that the increased water vapor from irrigation-enhanced ET plays a role in triggering the positive @q¼ ET P hr ðvqÞi;@t(2)where q is water vapor, ET is evapotranspiration, P is precipitation, v is horizontal velocity, and hi denotesZ pt a mass inte1gration throughout the troposphere (i.e., gðÞdp, wherepsg is gravity (m s-2), p1 is the pressure at the top of troposphere (hpa), and ps is surface pressure (hpa). Therefore,precipitation anomalies (P0 ) shown in Figure 1d are decomposed into evapotranspiration anomalies (ET0 ), water vapor0convergenceD E0 ( h r (vq)i ), and water vapor changes withtime ( @q@t) as shown in Figure 2. The spatial distributionand magnitude of ET0 are similar to those of P0 in most ofthe southwestern United States (Figures 2a and 2b). Watervapor convergence contributes to positive precipitationanomalies in the east of the study domain (Figure 2d). Thecombined effects of local ET enhancement and water vaporconvergence are associated with maximum positive watervapor and precipitation anomalies seen in the eastern areain Figure 1d.[15] The similarity between the patterns of ET0 and P0indicates the importance of land-atmosphere interactionsin the southwestern United States. Previous studies[Kurc and Small, 2007; Vivoni et al., 2009] also show thatthis region is regarded as a zone where the land and atmosphere are tightly coupled; therefore, we hypothesize thatpositive soil moisture feedback may yield higher localprecipitation. We confirm this by conducting another simulation in which land-atmosphere interaction over the southwestern United States is inhibited (No Land-Atmosphere Interaction run). This No Land-Atmosphere Interaction run hasthe same model configuration as the Irrigation run, except that2
LO AND FAMIGLIETTI: CENTRAL VALLEY IRRIGATION STRENGTHENS U. S. MONSOON(a) ET Climatology for Irrigation and Control runs120mm/mon100IrrigationControl8060402001 2 3 4 5 6 7 8 9 10 11 12Time, monFigure 1. (a) Climatology (45-year average) of ET (mm mo-1) averaged over the Central Valley for the Control and Irrigation runs. Irrigation-induced changes in the spatial distribution of (b) low-level water vapor flux (kg m-1 s-1), (c) low-levelwater vapor (g kg-1), (d) precipitation (mm mo-1), and (e) MSE (J kg-1). Only differences greater than the 90% significancelevel are shown for water vapor, precipitation, and MSE. (f) Vertical profile of change in MSE over the rectangular box in(b). All figures show the average during the summer.in the Central Valley. In fact, Figure 3 also shows that the precipitation anomalies shift to the east where the land and atmosphere interactions are still active, indicating that having activeland and atmosphere interactions is the key to maintaining thepositive precipitation anomalies.[16] Moreover, the tracer concentration in Figure S1 (Supporting Information) shows different spatial patterns thanthose of water vapor anomalies in Figure 1c, especially forthe local maximum water vapor concentration over easternsoil moisture content inside the boxed region of Figure 1b wasprescribed at climatological values (from the Control run) toisolate it from the effects of the precipitation anomalies.Figure 3 shows the difference in precipitation between thisNo Land-Atmosphere Interaction run and the Irrigation runand demonstrates that precipitation decreases after positiveland-atmosphere interaction is inhibited. Therefore, positivesoil moisture feedback plays an important role in drivingprecipitation over this region when irrigation water is applied3
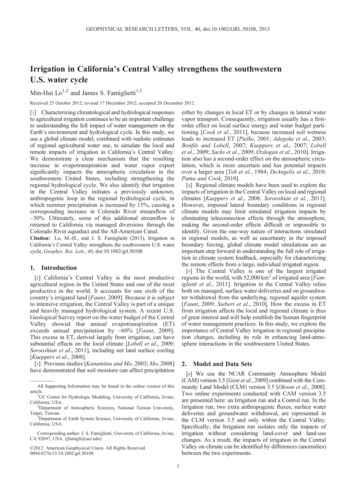
LO AND FAMIGLIETTI: CENTRAL VALLEY IRRIGATION STRENGTHENS U. S. MONSOOND E00Figure 2. Spatial distributions of the four terms in Eq. (2) during the summer (a) P0 , (b) ET0 , (c) @q@t , and (d) h r (vq)i .-10All the terms are in units of mm mo . Only differences greater than the 90% significance level (based on P ) are shown.Figure 3. Changes in the spatial distribution of precipitation (mm mo-1) during the summer due to land-atmosphereinteractions. Results are the summer differences between the No Land-Atmosphere Interaction and the Irrigation runs forthe 45-year simulations analyzed. Note that the No Land-Atmosphere Interaction experiment includes irrigation and thatonly differences greater than the 90% significance level are shown.then the soil moisture and ET over the southwestern UnitedStates, or more generally for accelerating the water cycle inthis region. Figure 1b shows that the enhanced water cycledynamics in the southwestern U.S. region result in an increaseof the water vapor flux into this region from the south and theeast as well as from the west. This is broadly consistent withColorado and eastern New Mexico. This is because thetracer experiment only shows the water vapor transport fromthe irrigation-induced ET without contributions from soilmoisture feedback and lateral water vapor transport. Hence,the additional water vapor transported from Central Valleyirrigation acts as a trigger for enhancing precipitation, and4
LO AND FAMIGLIETTI: CENTRAL VALLEY IRRIGATION STRENGTHENS U. S. MONSOON[19] Acknowledgments. Funding was provided by the UC Center forHydrologic Modeling, through the University of California Office of the President Multicampus Research Programs and Initiatives, and the National ScienceCouncil grants 101-2111-M-002-001 and 100-2119-M-001-029-MY5. Wethank J.T. Reager, Jacob Edman, Ray Anderson, Neeta Bijoor, and Chia Choufor important discussion. We also thank Dominik Wisser and Stefan Siebert forproviding us the global irrigation data sets.other studies, which have shown that enhanced ET in thesouthwestern United States can introduce more lateral moisture flux into the region [e.g., Kanamitsu and Mo, 2003;Xu et al., 2004; Anderson et al., 2006]. This primarily occursbecause changes in ET can modify surface temperature andpressure systems, resulting in an increase of low-level watervapor transport/fluxes.References4. DiscussionAnderson, B. T., H. Kanamaru, and J. O. Roads (2006): Variations in the summertime atmospheric hydrologic cycle associated with seasonal precipitation anomalies over the southwestern United States, J. Hydrometeor., 7,788–807.Adegoke, J., R. Pielke Sr., J. Eastman, R. Mahmood, and K. Hubbard(2003), Impact of irrigation on midsummer surface fluxes and temperature under dry synoptic conditions: A regional atmospheric model studyof the U.S. High Plains, Mon. Weather Rev., 131, 556–564,doi:10.1175/520-0493(2003)131 0556:IOIOMS 2.0.CO;2.Barnett, T., and D. W. Pierce (2009), Sustainable water deliveries from theColorado River in a changing climate, Proc. Natl. Acad. Sci. U. S. A., 106(18), 7334–7338.Bonfils, C., and D. Lobell (2007), Empirical evidence for a recent slowdownin irrigation-induced cooling, Proc. Natl. Acad. Sci. U. S. A.,104,13,582–13,587, doi:10.1073/pnas.0700144104.Cayan D. R., and et al. (2010), Future dryness in the southwest US and thehydrology of the early 21st century drought, Proc. Natl. Acad. Sci., 107,21271–21276.Cook, B. I., M. J. Puma, and N. Y. Krakauer (2011), Irrigation inducedsurface cooling in the context of modern and increased greenhouse gasforcing. Clim. Dynam., 37, 1587–1600, doi:10.1007/s00382-010-0932-x.DeAngelis, A., et al. (2010), Evidence of enhanced precipitation due to irrigation over the Great Plains of the United States, J. Geophys. Res.,10.1029/2010JD013892.Eltahir, E. A. B. (1998), A soil moisture rainfall feedback mechanism 1.Theory and observations, Water Resour. Res., 34, 765–776.Famiglietti, J. S., M. Lo, S. L. Ho, J. Bethune, K. J. Anderson, T. H. Syed,S. C. Swenson, C. R. de Linage, and M. Rodell (2011), Satellites measurerecent rates of groundwater depletion in California’s Central Valley, Geophys. Res. Lett., 38, L03403, doi:10.1029/2010GL046442.Faunt, C. C. (ed.) (2009), Groundwater availability of the Central ValleyAquifer, California; US 303 Geological Survey Prof. Paper 1766, 173 p.Gent, P. R., S. G. Yeager, R. B. Neale, S. Levis, and D. A. Bailey (2009),Improvements in a half degree atmosphere/land version of the CCSM,Clim. Dyn., 34, 6, 819–833.Hurrell, J. W., et al. (2008), A new sea surface temperature and sea iceboundary dataset for the community atmosphere model, J. Clim., 21(19), 5145–5153.Kanamitsu, M., and K. Mo (2003), Dynamical Effect of Land SurfaceProcesses on Summer precipitation over the Southwestern United States.J. Climate, 16, 496–509. DOI: 10.1175/1520-0442(2003)016 0496:DEOLSP 2.0.CO;2Kueppers, L. M., M. A. Snyder, and L. C. Sloan (2007), Irrigation coolingeffect: Regional climate forcing by land-use change, Geophys. Res. Lett.,34, L03703, doi:10.1029/2006GL028679.Kueppers, L., et al. (2008), Seasonal temperature response to land-use changein the western United States, Global Planet. Change, 60, , S. A., and E. E. Small (2007), Soil moisture variations and ecosystemscale fluxes of water and carbon in semiarid grassland and shrubland. WaterResour. Res., 43, W06416, doi:10.1029/2006WR005011.Lo, M. -H., and J. S. Famiglietti (2010), The Effect of Water Table Dynamicson Land Surface Hydrologic Memory, J. Geophys. Res., 115, D22118,doi:10.1029/2010JD014191.Lobell, D., G. Bala, A. Mirin, T. Philips, R. Maxwell, and D. Rotman(2009), Regional differences in the influence of irrigation on climate,J. Clim., 22, 2248–2255, doi:10.1175/2008JCLI2703.1.Mo, K. C. (2008), Influence of sea surface temperature on soil moisture andprecipitation interactions over the southwest, J. Geophys. Res., 113,D12116, doi:10.1029/2007JD009221.Oleson, K. W., et al. (2008), Improvements to the Community Land Modeland their impact on the hydrological cycle, J. Geophys. Res., 113,G01021, doi:10.1029/2007JG000563.Ozdogan, M., M. Rodell, H. K. Beaudoing, and D. Toll (2010), Simulatingthe effects of irrigation over the U.S. in a land surface model based onsatellite derived agricultural data, J. Hydrometeor., 11(1), 171–184,doi: 10.1175/2009JHM1116.1, 2010.Pielke, R. A. (2001), Influence of the spatial distribution of vegetation andsoils on the prediction of cumulus convective rainfall, Rev. Geophys.,39, 151–177.[17] Whereas the first-order effect of Central Valley irrigation results in a net land surface cooling and increases atmospheric water vapor locally in California, the second-ordereffect of Central Valley irrigation results in higher precipitation rates over the southwestern United States, includingenhancing summer monsoon rainfall and strengthening theregional water cycle. We demonstrate in a model a clear mechanism that the water vapor transport resulting from irrigationinitiates atmospheric instabilities over the southwesternUnited States, where soil moisture feedback and lateral watervapor convergence also play an important role in increasingprecipitation in the region. In addition to increasing precipitation, the additional rainfall results in increased runoff inthe southwestern U.S. region. Summer runoff in thisregion increases by 2.6 km3 (56%) and 0.4 km3 (28%) overthe Colorado River Basin. The Colorado River aqueduct andAll-American Canal transport 5 km3 of water from the Colorado River to Southern California annually (data from U.S.Bureau of Reclamation). When the return flows of streamflowin the southwestern U.S. region are considered, it is apparentthat irrigation in the Central Valley initiates a regional, anthropogenic loop of the hydrological cycle, as shown in Figure S3in the Supporting Information. Although the Central Valleydoes not use water from the Colorado River for irrigation, partof the irrigated water applied in the Central Valley ultimatelyflows back to Southern California because of teleconnectioneffects (increased remote precipitation and runoff) and the regional water management system (Colorado River Basin allocations to Southern California). Table S1 in the Supporting Information quantifies the anomalies and the correspondingestimated uncertainties in summer flux rates for the mainbranches of the anthropogenic loop.[18] This study highlights the importance of humandriven impacts on the hydrological cycle and regionalclimate and for water resources management in Californiaand the southwestern United States. Ultimately, our resultsshow that Central Valley irrigation has led to a strengthening of the southwestern U.S. hydrological cycle and formsan anthropogenic loop within the hydrological cycle of thesouthwestern United States and California. Given thatthe future of Central Valley irrigation is uncertain due tounsustainable rates of groundwater depletion [Famigliettiet al., 2011] and that water deliveries from Colorado Riverwill also become unsustainable toward the end of thiscentury [Barnett and Pierce, 2009; Cayan et al., 2010]due to declining snowpack in the western United States,a better understanding of how irrigation impacts local-toremote climate and water availability is essential forinformed resource management. Therefore, this study underscores the importance of including water managementpractices in current climate models, including observed irrigation rates, to more realistically simulate regional watercycle dynamics.5
LO AND FAMIGLIETTI: CENTRAL VALLEY IRRIGATION STRENGTHENS U. S. MONSOONPuma, M., and B. Cook (2010), Effects of irrigation on global climate duringthe 20th century, J. Geophys. Res. 115, 1–15. doi:10.1029/2010JD014122Sacks, W. J., B. I. Cook, N. Buenning, S. Levis, and J. H. Helkowski(2009), Effects of global irrigation on the near-surface climate, Clim.Dyn., 33, 159–175, doi:10.1007/s00382-008-0445-z.Siebert, S., J. Burke, J. M. Faures, K. Frenken, J. Hoogeveen, P. Döll, F. T.Portmann (2010), Groundwater use for irrigation—a global inventory,Hydrol. Earth Syst. Sci., 14, 1863–1880.Sorooshian, S., J. Li, K. -L. Hsu, and X. Gao (2011), How significant is theimpact of irrigation on the local hydroclimate in California’s CentralValley? Comparison of model results with ground and remote-sensingdata, J. Geophys. Res., 116, D06102, doi:10.1029/2010JD014775.Vivoni, E. R., K. Tai, and D. J. Gochis (2009), Effects of InitialSoil Moisture on Rainfall Generation and Subsequent HydrologicResponse during the North American Monsoon, J. Hydrometeorol.,10(3), 644–664.Wisser, D., S. Frolking, E. M. Douglas, B. M. Fekete, C. J. Vörösmarty, and A. H. Schumann (2008), Global irrigation water demand:Variability and uncertainties arising from agricultural andclimate data sets, Geophys. Res. Lett., 35, L24408, doi:10.1029/2008GL035296.Xu, J. J., W. J. Shuttleworth, X. Gao, S. Sorooshian, and E. E. Small,(2004), Soil moisture-precipitation feedback on the North Americanmonsoon system in the MM5 OSU model. Quart. J. Roy. Meteor. Soc.,130, 2873–2890.Yeh, T. C., R. T. Wetherald, and S. Manabe (1984), Effect of soil moistureon the short term climate and hydrology change: A numerical experiment,Mon. Weather Rev., 112, 474–490.6
annual mean total irrigation water requirement in the Central Valley is 350mm and is supplied entirely by surface water deliveries and groundwater withdrawal. The groundwater contribution to total irrigation water in the Central Valley is 40% [Siebert et al., 2010] based on the area equipped for irrigation use; hence, in this study, we assume .