Transcription
Locust Simulation Tutorial: RF SignalGeneration from Trapped Charged ParticlesP. L. SlocumNNPSSWright Laboratory and YCRCYale University28 June 20181
Outline Motivation: Project 8 experiment.Why do we need a new simulation? Compare Locust with existingparticle physics simulation packages.Purpose of the simulation–Generate the same data that we should see from the realexperiment.–This allows us to test the feasibility and systematics of the realexperiment.Logistics and examples.–Generating and processing a signal.–Running the simulation on HPC.This pdf sits online athttps://github.com/project8/locust .pdf2
Neutrinos in radioactive decay Neutrino first postulatedin 1930 by WolfgangPauli to preserve energyconservation inradioactive decays.Integral part of Fermi'stheory of beta decay in1933, precursor totheory of the weakinteraction.Neutrinos first detectedin 1956 by Reines andCowan.3Wolfgang Pauli
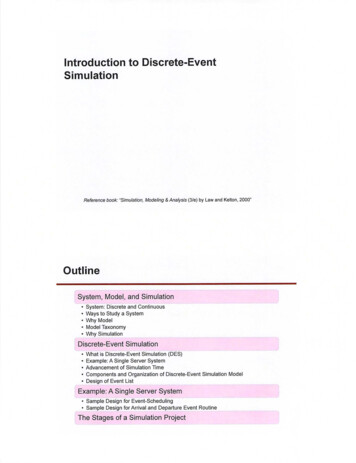
Constraints on effective massesConstraints onmasses fromcosmology and fromdirect measurementscan be compared.4F. Capozzi et al., Nucl. Phys. B, 00 (2016)
T2 beta decay5e.g., L. I. Bodine, Ph.D. Thesis, University of Washington (2015)
Direct measurements of effectiveneutrino mass Electron capture from 163Ho– Holmes, Echo, NuMecsT2 beta decay–Mainz/Troitsk–KATRIN: Karlsruhe Tritium Neutrino Experiment–Project 86
Decay of 163Ho by electron capture Proposed in 1982 byDeRejula and Luisignoli.163Ho decays to 163Dy byEC. De-excitation emissionis measured by xraycalorimetry.Holmes, ECHo, NuMECSexperiments.Measurement of distortionof EC xray spectrum at endpoint due to m .Resolution is presentlydefined by xray calorimetryand atomic calculations.7
KATRINDiameter of spectrometer is 10 m.Required vacuum is 10-11 mbar.Projected sensitivity is m 0.2 eV.8
Project 8: Cyclotron Radiation EmissionSpectroscopy (CRES)*Pioneered by the Project 8 collaboration in 2015. Measureenergy of single electrons indirectly by detecting boostedcyclotron frequency:ve BEmitted power depends on pitch angle but cyclotron frequency does not.9*B. Monreal and J. Formaggio, Phys. Rev. D80 051301 (2009)
trap coiltrap coilCyclotron Radiation Emission Spectroscopy (CRES)Trap electrons emitted from a radioactive source gas in a 1 Tmagnetic field and collect the cyclotron emission.Voltages induced in the antennas are filtered and digitized.Time of measurement determines frequency resolution.10B. Monreal and J. Formaggio, Phys. Rev. D80 051301 (2009)
Heterodyne detectionf1f2 f1 f2f1-f2intermediatefrequencyVoltages are sampled in timeafter mixing down from 26GHz to tens of MHz.Frequency spectrum iscalculated by FFT.18 keV electrons in 1 T givesSNR of 10 in waveguide.Frequency resolution 1/ .“Never measureanything butfrequency.”Dr. Arthur Schawlow11
Project 8 Phase 1 prototype schematic12D. M. Asner et al., PRL 114, 162501 (2015)
How can we simulate theRF signal generation?13
Status of existing particle physicssimulation software packages Geant4: Particle tracking and kinematics Comsol and HFSS: EM field solutions Kassiopeia: Flexible, modular in-situ field solutions withsimultaneous particle trajectory calculations (Furse et al.,NJoP 2017).Locust: New simulation interface with Kassiopeia to modelRF signal generation from particle trajectories, developedfor Project 8.14
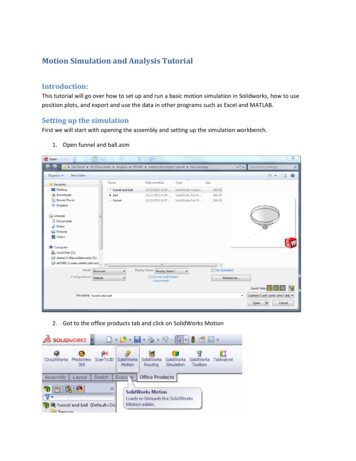
Trajectory calculations in EM field solutions withKassiopeia simulationSimultaneous fieldsolutions andtrajectory calculations.Magnetic bottle created bypinch coils in a constantmagnetic backgroundfield.Trajectories of five 18 keVelectrons, four trapped ina magnetic bottle. Fieldlines not shown. Rangeof initial (x0,y0,z0).15
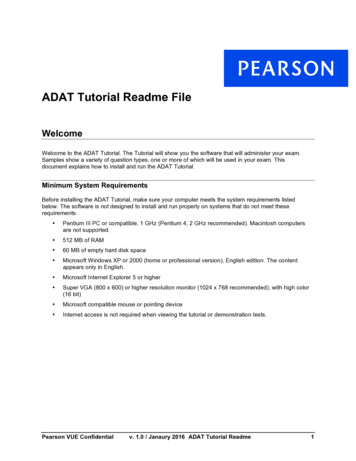
Locust simulation software block diagramConfiguration parametersare read from the json file.Generators populateand modify theLMCSignal object.LMCSimulationControllerLMCGenerator 1LMCRunLengthCalculatorLMCGenerator 2Final LMCSignal object isa time series of voltagesto be written to file.LMCSignal (final)LMCEggWriterLMCGenerator 3diskLMCSignal (initial)LMCGenerator N16
How do the Kassiopeia and Locustsimulations interact? They are compiled into one executable.Only one of them runs at a time, while the other lockscontrol of a std::mutex object.Kassiopeia runs for e.g. 0.5 ns at a time, then unlocks themutex. Locust takes control of the mutex, calculates onevoltage, and then hands control of the mutex back toKassiopeia.17
Locust simulation exampleRF block diagram Use the energy losses reported by Kassiopeia to guideinput.Generate antenna voltages at RF sampling frequency.Mix down to baseband with algorithmic receiver.LOIF RF – LOIF RF LO excluded.( image allowed at -IF )KassiopeiaRFLMCKassSignalGeneratorSampleat2 frequency by10AddGaussiannoiseLMCDecimateSignal LMCGaussianNoiseGeneratorGeneratordisk18
Why do we need the RF receiverblock diagram in the simulation? Lab experiment has an RF receiver. The main purpose is to lower thesignal frequency from e.g. GHz to MHz for efficient sampling and datamanagement.Signal generated with Locust should have the same format as theempirical data. This provides a comparison for lab data analysis.Signal post-processing needs a signal as input. Signal propertiesconstrain information that can be derived from signal processing.–e.g. Information that might be in the signal: voltage amplitude, voltage phase.–Information that might not be in the signal: large bit depth for higher accuracy,phase continuity, missing energy.–Signal properties (or missing properties) can help tell us whether theexperiment will work (or not).19
List of examples in this tutorial Visual Tool Kit (VTK) output. Single electron in a waveguide with one antenna. Driving the simulation with a tunable test signal. Larger number of single electrons in a waveguide, runin parallel on hpc. Single electron in an array of multiple antennas. Checking the magnetic field map.20
Steps to get started ssh -Y netID@grace.hpc.yale.edu module load Tools/nnpss setup dirs.sh cd project8/manageTutorial cp /home/hep/baker/ps48/project8/manageTutorial/* . cp /home/hep/baker/ps48/locust mc/Config/NNPSSTutorial/* /locust mc/Config/NNPSSTutorial/21
Example 0: Look at VTK output of atrajectory calculation with Kassiopeia1) ssh to Grace cluster: ssh -Y netID@grace1.hpc.yale.edu .2) Log in to compute node: srun --x11 --pty -c 4 -p interactive bash3) LocustSim config /locust n4) Output should appear as on next slide if: Kassiopeia has been compiled with VTK. The vtk window has been instantiated in the xml file. OpenGL version on your laptop is compatible with that on the cluster. Otherwise this example is more suitable to run on a standalonelaptop.22
Example 0: Look at VTK output of atrajectory calculation with Kassiopeia, cont.23
Logistics and examples of simulatedRF signal generation24
Questions before and after Locust Questions to ask before running Locust:–How much of the physics should appear in the generated signal?–Is there other physics that will not appear in the generatedsignal?–How will we tell the difference?Questions to ask after running Locust:–Did we measure the physics that we needed?–If not, how should we change the detection hardware? Describethe hardware change algorithmically in Locust, and generate anew signal.25
Some more detailed questionsbefore/after running Locust Did we detect the signal?–Is the local oscillator tuned to put the signal in our baseband windowspanning from -fNyquist to fNyquist?–An easy way to check this is to interrupt the simulation and print the RFfrequency to the terminal. IF RF – LO.–Otherwise check the processed data to look for the signal.Was the digitizer range set correctly?f1– Locust prints 100 digital voltages at completion.–Look for values of 0 and 255. These indicate saturation.–Too many 127 and 128s mean too much range.–Adjust the digitizer range in the json file “digitizer” parameters.f2f1 f2f1-f2What is the digitizer bit depth?–It is hard-wired to 8 bits at the moment.26
What are we actually going to do? Generate a time series of complex voltages (LMCSignal object).Each voltage sample will have a real part (I) and an imaginarypart (Q).First we calculate the voltage I sampled at time t with phase (t), and then we derive Q from it by lagging the voltage phase90o.In the offline data stream we will have the voltage magnitudeand phase information. atan(Q/I).Qmag I27
Locust example 1: Magnetically trapped electronradiates in a waveguide with one antenna What is the signal?– How will we detect it?– Power radiated by the electron.Generate voltages on an antenna by, e.g., P V 2/R.What is the voltage amplitude V?–Consider the power in the waveguide mode(s) that propagate to the antenna.–V sqrt(50 P), if it is changing with time we have AM.What is the voltage phase ?–Require to advance continuously as (t) f'(dt); it changes as FM.–f' is the frequency observed right at the antenna, including Doppler shift.What physics is not in the signal?–Waveguide modes that do not propagate.–Frequency of radiation observed anywhere but at the antenna.–We might reconstruct the missing physics with post-simulation analysis.28
Locust example 1: Magnetically trapped electronradiates in a waveguide with one antenna, cont. How do we implement this in software?– Inside the Locust generator LMCKassSignalGenerator we havepopulated the LMCSignal object with a time series of complex voltages. VI(t) V0(t)cos( (t)); VQ(t) V0(t)sin( (t)) V0(t) and (t) are calculated as on previous slide. Sampling rate is chosen according to bandwidth needs.How do we run this on Yale HPC?–cd /project8/manageTutorial–emacs SimulateSeed &, note 4 cpus, output file.–./SimulateSeed–Wait 30 minutes. Check that the file locust jobSeed55 is growing.29
Locust example 1: Magnetically trapped electronradiates in a waveguide with one antenna, cont. Check to see whether the slurm job has finished, and that there is anegg file in /data/SimulationTutorial.–squeue -u netID–ls -l /data/Simulation/Tutorial/*.egg Log on to a compute node: srun --x11 --pty -c 4 -p interactive bash cd –root -l–.L lotSlopes()output30
Locust example 2: Drive the receiverwith a complex sine wave Log on to a compute node: srun --x11 --pty -c 4 -p interactive bashOpen the sine wave config file: emacs /locust mc/Config/NNPSSTutorial/LocustSineWave.json &. Check which generatorsare listed, see that “lo-frequency” 20.15 GHz.Open the sine wave generator: emacs/home/hep/baker/ps48/locust mc/Source/Generators/LMCTestSignalGenerator.cc ,scroll to DoGenerateTime(). Find test frequency 20.1e9 Hz. LocustSim config /locust mc/Config/NNPSSTutorial/LocustSineWave.json Katydid -c /locust mc/Config/NNPSSTutorial/katydid basic.json cd /project8/manageTutorial–root -l–.L PlotExample.c–PlotTestSignal()Peak PSD is 0.1e-18 W/HzFrequency is 50 MHz.DC 100 MHz.(We have mixed the RFfrequency to -50 MHz.)output31
Locust example 2: Check the frequency andnormalization of the complex sine wave–Open the generator: emacs/home/hep/baker/ps48/locust mc/Source/Generators/LMCTestSignalGenerator.cc &–Scroll to DoGenerateTime() function and look at this line: aSignal LongSignalTimeComplex()[ch*aSignal- TimeSize()*aSignal- DecimationFactor() index][0] sqrt(50.)*5.e-8*cos(voltage phase-LO phase);–We are modifying the (multichannel, complex, oversampled, in-phase) LMCSignalobject by adding a voltage to it. The antenna impedance is 50 , the voltage amplitudeis 5.e-8 volts, and the frequency after downmixing will be (test frequencyfLO frequency).–Power in the sine wave should be V 2/R (5.e-8)(5.e-8)/50. 2.5e-15/50. W. Checkingthe PSD histogram we see PSD 0.1e-18 W/Hz with a bin width of 200.e6/8192, for atotal power of 2.44e-15 W. The 50 has been applied in Katydid post-processing.–Signal frequency is 50 MHz, which in this post-processing configuration, is 50 MHzbelow DC. The frequency span shown corresponds to -100 MHz through 100 MHz.LOsine sk32
Locust example 2: Try tuning the LO (complexsine wave, continued) emacs /locust mc/Config/NNPSSTutorial/LocustSineWave.json–Look at the config parameters in the “test-signal” generator. Decreasethe “lo-frequency” by 60 MHz from 25.15e9 to 25.09e9 Hz.–Save the file.LocustSimconfig /locust mc/Config/NNPSSTutorial/LocustSineWave.json Katydid -c /locust mc/Config/NNPSSTutorial/katydid basic.json cd /project8/manageTutorial–root -l–.L PlotExample.c–PlotTestSignal()Detected frequencyhas increased by60 MHz.33
Locust example 2: Now tune the signal all theway out of the window (sine wave, continued) emacs /locust mc/Config/NNPSSTutorial/LocustSineWave.json– Look at the config parameters in the “test-signal” generator. Decreasethe “lo-frequency” by another 100 MHz from 20.09e9 to 19.99e9 Hz.LocustSimconfig /locust mc/Config/NNPSSTutorial/LocustSineWave.json Katydid -c /locust mc/Config/NNPSS/katydid basic.json cd /project8/manageTutorial–root -l–.L PlotExample.c–PlotTestSignal()These filters have suppressed thesignal power because its frequencyhas been tuned out of thebaseband window.LOsample LPFdecimatedisk34
About the filtering (1)LOWhythis?And PFdisk35
About the filtering (2)Using a test signal with a low (1/2 ) andhigh frequency (8/2 ) componentV(t) cos(t) cos(8t) we can see whathappens to the high-f signal for fs 1 Hz.fs 1 Hzf 0.16 HzFrequency aliasing: Thispeak corresponds to thesignal with f 1.27 Hz butsits at 0.3 Hz becausefs 1 Hz is too slow.
About the filtering (3)Sampling faster: Now thesignal with f (8/2 ) 1.27 Hz ismeasured correctly and canbe suppressed with a LPF inthe frequency domain at 0.5Hz.suppressed
Return to Example 1 to processsignal and plot results
Locust example 3: Generating more statistics cd /project8/manageTutorial/ emacs SimulateSeed & Look at the range of seeds to be submitted as slurm jobs. Pick 56through 62. Exit and submit the job: ./SimulateSeedIt has to run for 3 hours, but we can process some pre-existing data:sbatch ProcessEggFilesBatch, then–root -l–.L PlotSpectrum.c–PlotKrypton()Each point represents oneprocessed track infrequency-time space.39
Locust example 4: Magnetically trapped electronradiates in free space with 30 channelsPatch array radius5.16 cm.Spacing 0.0108 m.One amplifier per longitudinalstrip for phased summing intime domain.40
Locust example 4: Multiple receiver channels Check the Locust config file:–emacs /locust ��Find the “simulation” config parameters, where “n-channels” is set to 30.–Check which generators will be called: “patch-signal”, “lpf-fft”, “decimatesignal”, “digitizer”.Check the slurm bash script:–emacs tice we request 12 cpus, which is more than for the single channelsimulation.–Note ntask 1 still, even with multiple threads and channels.41
Locust example 4: Magnetically trapped electronradiates in free space with 30 antennas Run the simulation:–cd ��squeue -u netID– 3 hours later it will finish.Process pre-existing data–./ProcessMultichannelEggFiles–root -l–.L ChannelSumming.c–beamform()Reconstructed electron positionfrom phase-sensitive sum42Simulation development by P. Slocum, N. Buzinsky, N. Oblath, T. Wendler
Locust example 5: Check the magnetic field map Kassiopeia contains a trajectory gen bfieldlines for a chargedparticle moving along a selected field line.This is implemented in Project8Tutorial FieldMap Template.xml,called by Locust FieldMap.json–cd /project8/manageTutorial–srun --x11 --pty -c 4 -p interactive bash–LocustSim config /locust mc/Config/NNPSSTutorial/LocustFieldMap.jsonPlot the field map:–root -l–.L PlotFieldMap.c–fieldmap()43
Tutorial and scripts in repositories on Github Simulation–– https://github.com/project8/locust mc.gitConfiguration files are in the same directory referenced in thistutorial: /locust mc/Config/NNPSSTutorial/ .Interpretation ��Files in repository directory /scripts/NNPSSTutorial/ are thesame as those used in this tutorial, in the directory /project8/manageTutorial/ .44
Summary RF signal generation can be simulated with the Locustsimulation.–A time series of induced voltages can be calculated onesample at a time.–AM and FM modulation can be applied to the voltages.Processing the generated signal tells us what information wehave detected about an experiment.–It's important to know which information we have not detected.–It's important to know whether (or not) we can reconstruct anymissing information from the signal analysis.45
2 Outline Motivation: Project 8 experiment. Why do we need a new simulation? Compare Locust with existing particle physics simulation packages. Purpose of the simulation - Generate the same data that we should see from the real experiment. - This allows us to test the feasibility and systematics of the real experiment. Logistics and examples.