Transcription
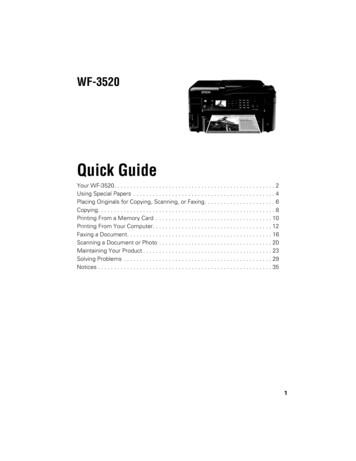
Int. J. Biol. Sci. 2022, Vol. 18IvyspringInternational Publisher4560International Journal of Biological SciencesResearch Paper2022; 18(11): 4560-4577. doi: 10.7150/ijbs.69933TCF7L2 promotes anoikis resistance and metastasis ofgastric cancer by transcriptionally activating PLAURTao Zhang1,2,3*, Bofang Wang2,3*, Fei Su1*, Baohong Gu2,3*, Lin Xiang2,3, Lei Gao2,3, Peng Zheng2,3, Xue-mei Li2,3,Hao Chen2,3,4 1.2.3.4.Department of oncology, The First Hospital of Lanzhou University, Lanzhou, Gansu, China.The second clinical medical college of Lanzhou university, Lanzhou , Gansu, China.Key laboratory of digestive system tumors, Lanzhou University Second Hospital, Lanzhou, Gansu, China.Cancer center, Lanzhou University Second Hospital, Lanzhou, Gansu, China.*These authors contributed equally to this work. Corresponding author: Cancer center, Lanzhou University Second Hospital, No. 82, Cuiyingmen, Chengguan District, Lanzhou, Gansu Province, 730030, China. E-mail:ery chenh@lzu.edu.cn (H. Chen). The author(s). This is an open access article distributed under the terms of the Creative Commons Attribution License (https://creativecommons.org/licenses/by/4.0/).See http://ivyspring.com/terms for full terms and conditions.Received: 2021.12.10; Accepted: 2022.06.14; Published: 2022.07.11AbstractGastric cancer (GC) is the most common gastrointestinal malignant tumor, and distant metastasis is a criticalfactor in the prognosis of patients with GC. Understanding the mechanism of GC metastasis will help improvepatient prognosis. Studies have confirmed that urokinase-type plasminogen activator receptor (PLAUR)promotes GC metastasis; however, its relationship with anoikis resistance and associated mechanisms remainsunclear. In this study, we demonstrated that PLAUR promotes the anoikis resistance and metastasis of GC cellsand identified transcription Factor 7 Like 2 (TCF7L2) as an important transcriptional regulator of PLAUR. Wealso revealed that TCF7L2 is highly expressed in GC and promotes the anoikis resistance and metastasis of GCcells. Moreover, we found that TCF7L2 transcription activates PLAUR. Finally, we confirmed that TCF7L2 is anindependent risk factor for poor prognosis of patients with GC. Our results show that TCF7L2 and PLAUR arecandidate targets for developing therapeutic strategies for GC metastasis.Key words: gastric cancer; urokinase-type plasminogen activator receptor; transcription Factor 7 Like 2; transcription; anoikisIntroductionGastric cancer (GC) is the most commonmalignant tumor of the digestive system and the fifthmost commonly diagnosed cancer worldwide [1].Compared to European and American countries, themorbidity and mortality of GC are higher in China [2].Despite the significantly improved prognosis ofpatients with GC with the development of noveldrugs and advancement in therapeutic strategies, thelong-term survival of patients with advanced GCremains dire. Distant metastasis is the primaryinfluencing factor in the prognosis of patients withGC [3]. Hence, it is necessary to understand themechanism of GC metastasis and to identifymetastasis-related molecular markers and therapeutictargets.“Anoikis” is cell death that occurs when cellslose interaction with surrounding stromal cells [6].Anoikis resistance is a hallmark event in the migrationof cancer cells, as they must be able to survive afterdetachment from their supporting cells [4, 5]. Incancer cells, anoikis resistance is regulated bymultiple genes and signaling pathways [7, 8]. Anoikisresistance plays a significant role in GC metastasis(Figure 1). For example, the nuclear MYH9-inducedCTNNB1 enhances the anoikis resistance of GC cells,ultimately promoting peritoneal metastasis of GC [9].L1CAM is upregulated in GC and is closely associatedwith the anoikis resistance of tumor cells [10]. Briefly,cancer cells must overcome anoikis for successfulmetastasis.As cancer malignancy progresses, the urokinasetype plasminogen activator receptor (uPAR orPLAUR) plays a key role, as it is not expressed innormal tissues but is strongly expressed in tumortissues. The expression of PLAUR is linked to theinvasion and migration of tumor cells [11-13]. Intumor tissues, PLAUR can activate extracellularmatrix proteolytic enzymes outside the cells byhttps://www.ijbs.com
Int. J. Biol. Sci. 2022, Vol. 18binding to urokinase-type plasminogen activator(uPA or PLAU), its ligand. This binding causespathological changes in the extracellular matrix,ultimately creating favorable conditions for malignantbehaviors such as the invasion and migration oftumor cells [14, 15]. Numerous studies havedemonstrated that PLAUR is upregulated in GC andis closely associated with cancer cell invasion andmigration [16-18]. However, its effect on the anoikisresistance of GC cells and its mechanisms remainunclear.Transcription Factor 7 Like 2 (TCF7L2) is amember of the high-mobility group (HMG) family, adownstream effector of the Wnt/β-catenin signalingpathway, and a pivotal regulator of development andcell growth [19-22]. TCF7L2 has a crucial role invarious biological processes and functions ofnumerous organs and tissues, including liver,pancreatic islets, and adipose tissues [23, 24]. Studieshave suggested the close correlation of TCF7L2 withvarious somatic metabolic disorders. TCF7L2 leads totype 2 diabetes, primarily by affecting the metabolismand homeostasis of glucose [20, 25, 26]. Recent studieshave also confirmed its strong linkage to cancer. Forexample, the TCF7L2 gene polymorphism is closelyassociated with the onset of familial breast, colorectal,prostatic, and esophageal cancers [27-31]. However,the correlation of TCF7L2 with GC as well as its effecton the anoikis resistance of GC cells has rarely beenreported.This study explored the association of PLAURwith the anoikis resistance of GC cells. TCF7L2 wasidentified as a transcriptional regulator of PLAUR.We confirmed that TCF7L2 activated the classiccaspase-3/7 pathway in a PLAUR-dependentmanner, thereby enhancing the anoikis resistance andmigration of GC cells.Materials and MethodsClinical samplesPaired GC tissues and adjacent non-cancertissues were acquired from the Lanzhou UniversitySecond Hospital. Cohort 1: PLAUR mRNA expressionwas detected in 15 pairs of fresh GC tissues andadjacent tissues, and the correlation between PLAURand TCF7L2 protein expression was analyzed viaimmunofluorescence (IF) in these 15 GC tissues.Cohort 2: 121 pairs of GC tissues and adjacentnon-cancer tissues were formalin-fixed and paraffinembedded and then used to detect the expression ofTCF7L2 protein in GC and adjacent tissues byimmunohistochemistry (IHC). Cohort 3: 10 pairs offresh GC tissues and adjacent non-cancer tissues werecryopreserved and used for quantitative analysis of4561TCF7L2 protein expression in GC and adjacent tissuesby western blot. All enrolled patients signed informedconsent, and procedures were approved by the EthicsCommittee of Lanzhou University Second Hospital.Cell cultureGC cell lines MKN45, MGC-803, AGS, andHGC-27; gastric mucosal normal epithelial cell GES-1;and human embryonic kidney 293T (HEK293T) cellswere purchased from Shanghai Fuheng Biotechnology (Shanghai, China). All cell lines were cultivatedin Roswell Park Memorial Institute (RPMI) 1640medium (Gibco, Waltham, MA, USA) supplementedwith 10% fetal bovine serum (FBS; Gibco) and 1%penicillin streptomycin (Beyotime, Shanghai, China)in a 37 C incubator with 5% CO2 under humidifyingconditions.Cell transfectionSmall hairpin RNA (shRNA) targeting PLAURand TCF7L2, and negative control shRNA (sh-Ctrl)were synthesized by Compass Biotech (Quanzhou,China). The coding sequence of PLAUR or TCF7L2was amplified and cloned into pCDH-CMVMCS-EF1-copGFP plasmid (Compass Biotech) andpackaged as lentivirus. Lentivirus was transfectedinto candidate GC cell lines. Positive cells werescreened with puromycin (2 μg /mL) for 2 weeks, andthe effect of knockdown and overexpressionefficiency was measured via quantitative reversetranscription polymerase chain reaction (qRT-PCR)and western blot. The target sequences of PLAUR andTCF7L2 shRNAs are provided in Table S1.Construction of anoikis modelFor the construction of the anoikis model, 1 106cells were suspended in ultra-low adsorption 6-wellplates (Corning, NY, USA) and cultured for 24 h.Suspended cells were harvested and processed forsubsequent experiments.qRT-PCRTrizol reagent (Invitrogen, Grand Island, NY,USA) was used to extract total RNA from GC cellsand tissue samples, according to the manufacturer’sprotocols. Total RNA was used for reversetranscription using PrimeScriptTM RT Reagent Kit(Takara, Shiga, Japan). Quantification was performedwith SYBR Green PCR Master Mix (Takara) usingApplied Biosystems ABI 7500 (Applied Biosystems,Waltham, MA, USA). GAPDH was used as an internalreference gene. The 2-ΔΔCt method was utilized toquantify fold changes. All experiments were repeatedin triplicate. Primer sequences are provided in TableS2.https://www.ijbs.com
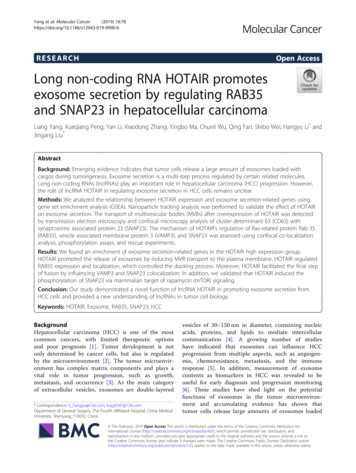
Int. J. Biol. Sci. 2022, Vol. 184562Figure 1. Relationship between anoikis resistance and metastasis of cancer cells.Western blotRadio immunoprecipitation assay (RIPA,Beyotime, Shanghai, China) supplemented withprotease inhibitors (Beyotime) was used to extracttotal protein from GC cells and tissue samples. Totalprotein was run on 8-12% SDS/PAGE gels andtransferred onto polyvinylidene difluoride tly, membranes were blocked with 5%skim milk and incubated overnight at 4 C with theprimary antibodies. The next day, PVDF membraneswere incubated for 2 h at room temperature withappropriate secondary antibodies, and ECL substratewas applied. Images were visualized using aTianneng automatic chemiluminescence imageprocessing system (TANO, Shanghai, China). Primaryantibodies are presented in Table S3.Cell proliferation assayThe cell counting kit 8 (CCK-8, Yelasen,Shanghai, China) was used to quantify theproliferation ability of GC cells, according to themanufacturer’s instructions. Cells in the sh-Ctrl groupand shRNA group were seeded in 96-well plates(Corning) at 1 104 cells/well. After 24 h, 48 h, and 72h, 10 μL of CCK8 solution was mixed with the cellsand incubated for 2 h at 37 C to assess proliferationactivity. The absorbance was measured at 450 nmusing a BioTek microplate reader (BioTek, Winooski,VT).5-ethynyl-2’-deoxyuridine (EdU) assayAn EdU assay was performed using an EdUassay kit (RiboBio, Guangzhou, China). Cells wereincubated with 50 μm Edu solution at roomtemperature for 6–8 h. Subsequently, cells were fixedwith 4% neutral paraformaldehyde at roomtemperature for 30 min. Cells were permeabilizedwith PBS containing 0.5% Triton X-100 for 20 min andthen washed three times with PBS. Cells were stainedwith Apollo staining reagent (KeyGEN, Nanjing,China) for 20 min and washed three times ino-2-phenylindole (DAPI, KeyGEN) andvisualized under a microscope.Transwell assayTranswell chambers (Corning) were used tomeasure cell migration ability. Cells were suspendedin RPMI 1640 medium without FBS, and 1 104 cellswere seeded into the upper chamber of the transwellchamber. Subsequently, 800 μL of RPMI 1640 mediumwith 10% FBS was added into the lower chamber.After 24 h, cells that had migrated to the lower surfaceof membranes were fixed with 4% paraformaldehydefor 20 min and stained with 0.1% crystal violet for 20min. The average number of migrating cells wasdetermined by six randomly picked fields of visionunder the microscope.https://www.ijbs.com
Int. J. Biol. Sci. 2022, Vol. 18Wound healing assayThe wound healing assay was processed using6-well plates (Corning). The cells of different groupswere seeded into 6-well plates and cultivated until thecells were 90% confluent. A scratch was made with apipettor tip, the detached cells were washed off withPBS, and then cells were cultured in medium withoutFBS for 24 h. The wound widths were assessed at 0 hand 24 h under a light microscope, andImageJ software (ImageJ Software Inc., MD, USA)was used to assess the relative area of wound closure.Cell apoptosis assayFlow cytometry was used for apoptosis assays.The AnnexinV-FITC apoptosis detection kit (Yelasen,Shanghai, China) was used to measure the apoptosisrates of adherent and suspension cells. Cells werewashed twice with PBS buffer, 300 μL of bindingbuffer was added to tubes, and stained by 5 μLAnnexin V-FITC and 10 μL PI in the dark for 15 min atroom temperature. The percentage of cell apoptosiswas measured via flow cytometry (Beckman Cytoflex,California, CA, USA).IFCells or tissues on slides were fixed withparaformaldehyde (4%) and permeabilized with0.01% Triton X-100 for 15 min. The slides wereincubated with primary antibodies anti-PLAUR(1:200, Santa Cruz, sc-13522) or anti-TCF7L2 (1:100,Bioss, bsm-52543R), overnight in a humidifiedchamber at 37 C in the dark. Subsequently, cell nucleiwere stained with DAPI. The fluorescencedistribution and intensity of cells and tissues wereanalyzed using a Zeiss LSM 880 laser microscope(Carl Zeiss AG, Oberkochen, Germany).DNA pull-down assayThe DNA-pull-down assay was performed usingthe Bes5004 DNA pull-down kit (BersinBio,Guangzhou, China), according to the manufacturer’sinstructions. First, the PLAUR promoter sequence wassearched for in the NCBI (Table S4). PCR productswere labeled with biotin using a universalbiotinylated primer. The gel recovery kit (QIAGEN,Venlo, Netherlands) was used to isolate a labeledprobe from agarose gels. Lysis buffer was used toextract MKN45 and 293T cell total protein, and a BCAkit (Solarbio, Beijing, China) was used to measure theprotein concentration. One part of the protein wasmarked as “Input,” and the other part was incubatedwith the probe to form a protein-DNA-magnetic beadcomplex. The targeted protein was marked as“Target” after it was eluted and then run onSDS-PAGE. Differential bands were analyzed by4563silver staining. The fractions were analyzed usingnanospray liquid chromatography tandem massspectrometry (LC-MS/MS) on a Thermo Scientific QEHF (Thermo Fisher Scientific, MA, USA).Chromatin-immunoprecipitation (ChIP)ChIP assays were executed using theSimpleChIP Enzymatic Chromatin IP Kit (CST,Massachusetts, MA, USA). The cells were fixed by 1%paraformaldehyde for 10 min, then 0.125 M glycinewas added and the mixture was placed at roomtemperature for 5 min to terminate the DNA–proteincrosslinking. SDS lysis buffer (with proteaseinhibitors) was added to the cells, and an ultrasonicfragmentation device was used to generate chromatinfragments. A portion of the products was marked as“Input.” The remaining lysates were incubated withTCF7L2 antibody (Abcam, Cambridge, UK) andProtein G magnetic beads to form a DNA-antibodymagnetic beads complex, and the DNA was markedas “Target” after elution and purification. Rabbit IgG(CST, Massachusetts, MA, USA) served as a negativecontrol. The final purified DNA fragment wasanalyzed via qRT-PCR. Primers of qPCR for thePLAUR promoter binding site are presented in TableS5.Luciferase activity assayLuciferase activity assay was performed usingthe Luciferase Detection Kit (Promega, Madison, WI,USA), according to the manufacturer’s instruction.First, The WT and mutated PLAUR UTR were clonedinto PGL4.11-Basic Vector (Promega), producing PLAUR-mut-promoter-luc MKN45, and293T cells were co-transfected with different plasmidsfor 48 h. Finally, the Promega dual-luciferase system(Promega) was used for detection.Co-immunoprecipitation (co-IP) assayCo-IP assay was performed as describedpreviously [32]. Lysates were incubated with Flagaffinity beads (Sigma-Aldrich, MA, USA). Theinteracting proteins were detected via western blot.Xenograft assayMKN45 cells were transfected with shRNAagainst PLAUR, TCF7L2 and the correspondingscramble interference by lentiviral infection. Eachplasmid had a luciferase label. Cells transfected withsh-Ctrl and shRNAs (sh-PLAUR or sh-TCF7L2) 1:1were mixed with PBS and Matrigel suspensionreagent (BD Biosystems, San Jose, CA, USA). Briefly,1 106 cells were injected subcutaneously into femaleBALB/c nude mice aged 6-8 weeks (HangzhouZiyuan Laboratory Animal Science and Technology).https://www.ijbs.com
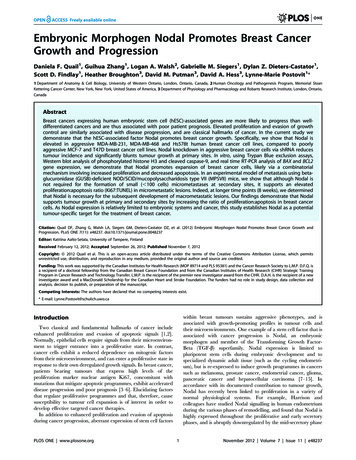
Int. J. Biol. Sci. 2022, Vol. 18Tumor volumes were measured every 4 days andcalculated by the formula (length width2)/2. After24 days, mice were sacrificed by deep anesthesia withethyl ether. Tumor tissues were harvested forsubsequent experiments. The lung metastasisxenograft model was established by injecting 1 106cells into female BALB/c nude mice aged 6–8 weeksthrough the tail vein. The bioluminescence imageswere acquired by the IVIS spectrum imaging system(PerkinElmer, Massachusetts, USA). Lastly, mice weresacrificed after 28 days, and lung tissues wereharvested for subsequent experiments. Animalexperiments were reviewed and approved by theAnimal Use Ethics Committee of Lanzhou UniversitySecond Hospital. All animals were cared for inaccordance with the Guide for the “Care and Use ofLaboratory Animals”.Hematoxylin and eosin (H&E) staining andIHCH&E staining was performed on 5 μm paraffinsections using a standard H&E staining protocol [33].Tissue samples were fixed, embedded, cut into slices,dewaxed, antigen retrieved, incubated with primaryantibody, incubated with secondary antibody, DABstained, hematoxylin stained, and alcohol denatured.The primary antibodies were anti-PLAUR (1:200,Santa Cruz, sc-13522), anti-TCF7L2 (1:100, CST,#2569), and anti-Ki67 (1:100, Proteintech, yreviewed all sections. The IHC score was determinedusing modified Histo-score (H-score) [34]. Thestaining intensity and percentage of positive cellswere scored as described previously [35]. The finalimmunoreactive score was calculated as the stainingintensity score the percentage of positive cells. Theexpression level of TCF7L2 was considered “lowexpression” if the immunoreactive score was 0–4 and“high expression” if the score was 5-9.Bioinformatics analysesStomach adenocarcinoma (STAD) gene mutationdata and RNA-seq data were obtained from theTCGA database. GenVisR [36] data package was usedto construct and draw the “waterfall map” of sc.edu) [37] and PROMO database(http://alggen.lsi.upc.es/home.html) [38] were usedto search for PLAUR promoter sequences and analyzetranscription factors that regulate PLAUR. ThePearson correlation between the expression of PLAURand its transcription factor TCF7L2 was calculatedusing the “ggstatsplot” and “ggplot2” packages. TheJASPAR database (https://jaspar.genereg.net/) [39]was used to identify the binding site of transcription4564factor TCF7L2 to the PLAUR promoter. Expressionprofiles and protein level of TCF7L2 in STAD wereacquired from GEPIA (http://gepia.cancer-pku.cn/)[40] and HPA (https://www.proteinatlas.org) [41]databases. The survival of patients with GC againstTCF7L2 expression was estimated using a KaplanMeier plotter (http://www.kmplot.com/) [42].Statistical analysisFunctional analysis was performed using theSPSS software package (version 24.0, IBM SPSS, IL,USA) and GraphPad Prism (version 8.0, GraphPadSoftware, CA, USA). We used Student's t-test toexamine the difference in means between two groups,and two-tailed ANOVA to examine the differencebetween multiple groups. A Chi-square test was usedfor correlation analysis between gene expression andclinicopathological features. The Kaplan – Meiermethod was used to test the overall survival betweendifferent groups. Cox regression analysis was used toanalyze the influencing factors affecting the prognosisof patients. A P value 0.05 was considered astatistically significant difference.ResultsPLAUR promotes the proliferation, anoikisresistance, and migration of GC cellsTo analyze the effects of PLAUR on themalignant behavior of GC cells, we quantified itsexpression in normal gastric epithelial cells (GES-1)and GC cell lines (HGC27, MGC803, AGS, andMKN45). The expression of PLAUR was highest inMKN45 cells and lowest in MGC803 cells(Supplementary Figure 1). Accordingly, these twocell lines were used to construct stable PLAURknockdown or overexpressing cells. qRT-PCR andwestern blot were used to confirm the knockdown , we assayed the effects of PLAUR on GCcell proliferation via CCK-8 and EdU assays. Theresults showed that the knockdown of PLAURinhibited the proliferation of MKN45 cells, while itsoverexpression promoted the proliferation ofMGC803 cells (Figure 2a-b). To mimic the anoikis ofGC cells, we used ultra-low attachment 6-well platesto suspend the cells for 24 h. Thereafter, the impact ofPLAUR on the anoikis resistance of GC cells wasanalyzed via flow cytometry. Following a 24 hsuspension of cells, the knockdown of PLAURpromoted the apoptosis of MKN45 cells, whereas itsoverexpression inhibited the apoptosis of MGC803cells (Figure 2c). Meanwhile, we used western blot todetect the apoptosis-related protein expression in theGC cells that had been suspended for 24 h. As shownhttps://www.ijbs.com
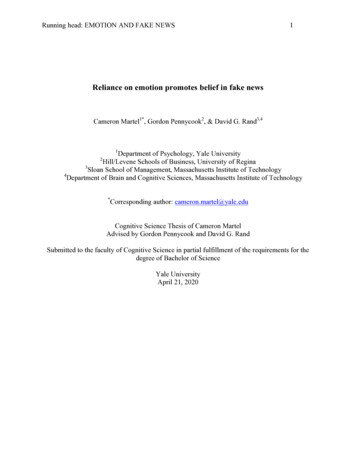
Int. J. Biol. Sci. 2022, Vol. 18in Figure 2d, after cell suspension for 24 h, theknockdown of PLAUR promoted the expression ofcleaved-caspase-3/7 and Bax in the MKN45 cells,while inhibiting the expression of Bcl-2. In contrast,the overexpression of PLAUR inhibited cleavedcaspase-3/7 and Bax expression in MGC803 cells,while promoting the expression of Bcl-2. Finally,transwell and wound healing assays were employedto analyze the correlation of PLAUR with themigration of GC cells. The knockdown of PLAURinhibited the migration of MKN45 cells, while itsoverexpression promoted the migration of MGC803cells (Figure 2e-f). Overall, PLAUR promoted theproliferation, anoikis resistance, and migration of GCcells.4565PLAUR promotes tumor growth andmetastasis in vivoTo further confirm our in vitro observations, weexplored whether PLAUR regulates the growth andmetastasis of tumor cells in vivo. Initially, weestablished a nude mouse model of subcutaneoustumors by subcutaneously injecting MKN45 cells withsh-Ctrl or sh-PLAUR#1. We observed the changes insubcutaneous tumor volume of nude mice andplotted corresponding growth curves. The tumorswere also confirmed by small animal live imaging onthe 24th day after injection. As expected, PLAURknockdown significantly delayed in vivo tumorgrowth in nude mice (Figure 3a). Tumors harvestedfrom the sacrificed animals were weighed, andFigure 2. PLAUR promotes the malignant phenotype of GC cells. a–b Effects of PLAUR knockdown or overexpression on the proliferation of GC cells, measured byCCK-8 (a) and EdU assay (b). c After GC cells were suspended for 24h, the effects of PLAUR knockdown or overexpression on the anoikis resistance of GC cells, analyzed viaflow cytometry. d Changes in apoptosis-related proteins after PLAUR knockdown or overexpression were analyzed via western blot in GC cells suspended for 24 h. e–f Effectsof PLAUR knockdown or overexpression on the migration of GC cells, evaluated by transwell (e) and wound healing assay (f). Compared with the corresponding control group,* P 0.05, ** P 0.001.https://www.ijbs.com
Int. J. Biol. Sci. 2022, Vol. 18significantly heavier tumors were observed in nudemice in the sh-Ctrl group than in the sh-PLAUR#1group (Figure 3b). Additionally, subcutaneoustumors were identified via H&E staining (Figure 3c).IHC analysis revealed that PLAUR knockdowninhibited the expression of Ki67 in tumor tissues(Figure 3c). Subsequently, we established a nudemouse model of lung metastasis through tail veininjection of MKN45 cells, either with sh-Ctrl orsh-PLAUR#1. On the 28th day following injection,4566mice in the sh-Ctrl group exhibited significantlyhigher lung tumor burden than those in thesh-PLAUR#1 group (Figure 3d). After euthanizingand dissecting mice, the PLAUR knockdown reducedthe number of nodules on the lung surfaces (Figure3d). As shown in Figure 3e, H&E staining was alsoemployed to identify lung metastases. Collectively,the above results confirmed that PLAUR facilitatestumor growth and metastasis in vivo.Figure 3. PLAUR promotes the GC process in vivo. a Knockdown of PLAUR inhibited the growth of subcutaneous xenograft tumors in nude mice. The bioluminescenceimages of the subcutaneous tumors were displayed in a small animal in vivo imaging system, and the tumor growth curve for 24 days was measured. b Gross specimen and averageweight of the tumor after sacrifice. Knockdown of PLAUR inhibited the volume and weight of subcutaneous xenograft tumors in nude mice. c Histological characteristics and Ki67expression of the tumor were examined via H&E staining and IHC, respectively. The knockdown of PLAUR inhibited the Ki67 expression of subcutaneous xenograft tumors innude mice. d Knockdown of PLAUR inhibited lung metastasis in nude mice. The bioluminescence image of lung metastases and the count of lung metastatic nodules are displayed,28 days after tail veins were injected with GC cells. The white arrows represent the lung metastasis nodules. e Lung metastasis tumors were confirmed via H&E staining.Compared with the control group, * P 0.001.https://www.ijbs.com
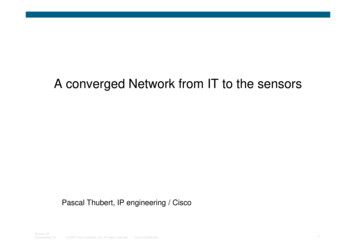
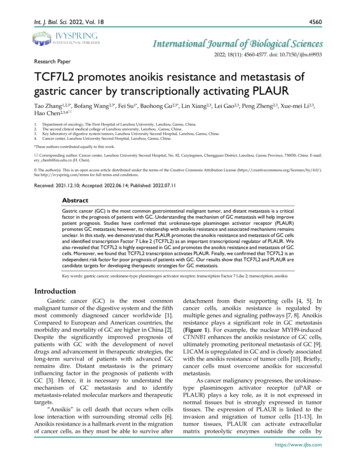
Int. J. Biol. Sci. 2022, Vol. 184567Figure 4. TCF7L2 is a potential transcriptional regulator of PLAUR. a Silver staining of PLAUR binding protein identified in DNA pulldown. b Heat map of expressionof transcription factors of PLAUR in GC samples and normal samples. c TCF7L2, FOXP3, and E2F1 were identified as transcription factors of PLAUR through LC-MS/MS, combinedwith the screening results of the PROMO database. d Expression correlations of TCF7L2, FOXP3, E2F1, and PLAUR were analyzed based on TCGA-seq data. TCF7L2 has thehighest correlation with PLAUR expression. e TCF7L2 protein was confirmed to be present in the pull-down product by western blot.TCF7L2 is a potential transcriptional regulatorof PLAURAs described earlier, PLAUR was upregulated inGC, which promoted the malignancy of tumor cells,including anoikis resistance. Afterwards, we exploredthe reasons for PLAUR upregulation in GC. Initially,we examined PLAUR mRNA expression in 15 pairs ofGC and adjacent tissues (cohort 1). The resultsindicated considerably higher PLAUR mRNA contentin the GC tissues than in the adjacent tissues(Supplementary Figure 3). Additionally, we ruled outthe possibility of PLAUR upregulation in GC causedby PLAUR mutations using a bioinformatics approach(Supplementary Figure 4). Meanwhile, consideringthe major role of abnormal transcriptional regulationin carcinogenesis and development, we speculatedthat abnormal transcription leads to upregulatedPLAUR expression in GC.To find major transcription factors capable ofregulating PLAUR expression, we first determinedthe proteins that bind to the PLAUR promoter inMKN45 cells, by DNA pull-down assay. As shown inFigure 4a, many DNA–protein complex bands werefound on silver-stained polyacrylamide gels, some ofwhich were absent in the control reaction. We furtheridentified the aforementioned proteins throughLC-MS/MS (Table S6). Subsequently, PROMOprogram was used to discover the potentialtranscription factors that can regulate PLAURexpression, and TCGA-STAD-seq data were utilizedto draw an expression heatmap of these transcriptionfactors in GC (Figure 4b). Notably, three transcriptionfactors, namely TCF7L2, FOXP3, and E2F1,overlapped in the LC-MS/MS and PROMO searches(Figure 4c). Based on the TCGA-STAD-seq data, weanalyzed the correlation of PLAUR expression withthese transcription factors in GC. As shown in Figure4d, TCF7L2 exhibited the highest correlation withPLAUR expression (r 0.42, P 0.001). Finally, theexpression of TCF7L2 protein in the pull-downproduct was detected via western blot (Figure 4e).Further analysis, aided by online bioinformatics tools,revealed that TCF7L2 was highly expressed in GC,localized primarily in cell nuclei, and was associatedwith poor patient prognosis (Supplementary Figure5). Our data suggested that the transcription factorTCF7L2 plays an oncogenic role in GC. Hence, wefocused on exploring the regulatory relationshipbetween TCF7L2 and PLAUR.https://www.ijbs.com
Int. J. Biol. Sci. 2022, Vol. 18TCF7L2 transcriptionally upregulates PLAURexpression in GCTo further assess the regulation of PLAURexpression by TCF7L2 at the transcriptional level, westudied the localization of TCF7L2 and PLAURproteins in MKN45 cells and GC tissues by IFstaining, with GC tissues from cohort 1. TCF7L2protein was detected at varying levels in thecytoplasm and nucleus of both MNK45 cells and GCtissues, whereas PLAUR protein was observed only inthe cytoplasm (Figures 5a-b). Through fluorescenceintensity, we found that the expression of TCF7L2 andPLAUR were positively correlated in 15 GC tissues (r 0.54, P 0.03; Figure 5b). Notably, we observed theco-localization of TCF7L2 and PLAUR proteins in thecytoplasm of GC cells through confocal lasermicroscopy. Hence, a co-IP assay was employed tofurther analyze whether there was a protein–proteininteraction between TCF7L2 and PLAUR which couldregulate the abnormal PLAUR expression in GC. Theresults revealed an absence of direct interactionbetween TCF7L2 and PLAUR protein (Supplementary Figure 6). Cell nuclei are considered themain site where transcription events occur inorganisms. Overall, it can be deduced that TCF7L2transcriptionally regulates PLAUR expression.To validate the regulatory effect of TCF7L2 onPLAUR expression, we suppressed TCF7L2 expression in MKN45 cells and overexpressed TCF7L2 inMGC803 cells. The knockdown or overexpression wasverified by qRT-PCR and western blot (Supplementary Figure 7). Afterwards, the effects on PLAURexpression were analyzed. The knockdown of TCF7L2greatly inhibited PLAUR expression in MKN45 cells,whereas its overexpression elevated PLAUR inMGC803 cells (Figure 5c-d). Accordingly, weconfirmed that
Applied Biosystems ABI 7500 (Applied Biosystems, Waltham, MA, USA). GAPDH was u sed as an internal reference gene. The 2-ΔΔCt method was utilized to . ImageJ software (ImageJ Software Inc., MD, USA) was used to assess the relative area of wound closure. Cell apoptosis assay