Transcription
Proceedings of Machine Learning for Healthcare 2016JMLR W&C Track Volume 56Identifiable Phenotyping using Constrained Non–NegativeMatrix FactorizationShalmali Joshishalmali@utexas.eduElectrical and Computer EngineeringThe University of Texas at AustinAustin, TX, USASuriya Gunasekarsuriya@utexas.eduElectrical and Computer EngineeringThe University of Texas at AustinAustin, TX, USADavid Sontagdsontag@cs.nyu.eduComputer ScienceNew York UniversityNYC, NY, USAJoydeep Ghoshjghosh@utexas.eduElectrical and Computer EngineeringThe University of Texas at AustinAustin, TX, USAAbstractThis work proposes a new algorithm for automated and simultaneous phenotyping of multiple co–occurring medical conditions, also referred to as comorbidities, using clinical notesfrom electronic health records (EHRs). A latent factor estimation technique, non-negativematrix factorization (NMF), is augmented with domain constraints from weak supervisionto obtain sparse latent factors that are grounded to a fixed set of chronic conditions. Theproposed grounding mechanism ensures a one-to-one identifiable and interpretable mapping between the latent factors and the target comorbidities. Qualitative assessment ofthe empirical results by clinical experts show that the proposed model learns clinicallyinterpretable phenotypes which are also shown to have competitive performance on 30 daymortality prediction task. The proposed method can be readily adapted to any non-negativeEHR data across various healthcare institutions.1. IntroductionReliably querying for patients with specific medical conditions across multiple organizations facilitates many large scale healthcare applications such as cohort selection, multi-siteclinical trials, epidemiology studies etc. (Richesson et al., 2013; Hripcsak and Albers, 2013;Pathak et al., 2013). However, raw EHR data collected across diverse populations andmultiple care-givers can be extremely high dimensional, unstructured, heterogeneous, andnoisy. Manually querying such data is a formidable challenge for healthcare professionals.c 2016.
EHR driven phenotypes are concise representations of medical concepts composed ofclinical features, conditions, and other observable traits facilitating accurate querying ofindividuals from EHRs (NIH Health Care Systems Research Collaboratory, 2014). Effortslike eMerge Network1 , PheKB2 are well known examples of EHR driven phenotyping. Traditionally used rule–based composing methods for phenotyping require substantial time andexpert knowledge and have little scope for exploratory analyses. This motivates automatedEHR driven phenotyping using machine learning with limited expert intervention.We propose a weakly supervised model for jointly phenotyping 30 co–occurring conditions (comorbidities) observed in intensive care unit (ICU) patients. Comorbidities are aset of co-occurring conditions in a patient at the time of admission that are not directlyrelated to the primary diagnosis for hospitalization (Elixhauser et al., 1998). Phenotypesfor the 30 comorbidities listed in Table 1 are derived using text-based features from clinicalnotes in a publicly accessible MIMIC-III EHR database (Saeed et al., 2011). We presenta novel constrained non–negative matrix factorization (CNMF) for the EHR matrix thataligns the factors with target comorbidities yielding sparse, interpretable, and identifiablephenotypes.The following aspects of our model distinguish our work from prior efforts:1. Identifiability: A key shortcoming of standard unsupervised latent factor modelssuch as NMF (Lee and Seung, 2001) and Latent Dirichlet Allocation (LDA) (Blei et al.,2003) for phenotyping is that, the estimated latent factors learnt are interchangeable andunidentifiable as phenotypes for specific conditions of interest. We tackle identifiabilityby incorporating weak (noisy) but inexpensive supervision as constraints our framework.Specifically, we obtain weak supervision for the target conditions in Table 1 using theElixhauser Comorbidity Index (ECI) (Elixhauser et al., 1998) computed solely from patientadministrative data (without human intervention). We then ground the latent factors tohave a one-to-one mapping with conditions of interest by incorporating the comorbiditiespredicted by ECI as support constraints on the patient loadings along the latent factors.2. Simultaneous modeling of comorbidities: ICU patients studied in this paperare frequently afflicted with multiple co–occurring conditions besides the primary causefor admission. In the proposed NMF model, phenotypes for such co–occurring conditionsjointly modeled to capture the resulting correlations.3. Interpretability: For wider applicability of EHR driven phenotyping for advanceclinical decision making, it is desirable that these phenotype definitions be clinically interpretable and represented as a concise set of rules. We consider the sparsity in the representations as a proxy for interpretability and explicitly encourage conciseness of phenotypesusing tuneable sparsity–inducing soft constraints.We evaluate the effectiveness of the proposed method towards interpretability, clinicalrelevance, and prediction performance on EHR data from MIMIC-III. Although we focuson ICU patients using clinical notes, the proposed model and algorithm are general and canbe applied on any non-negative EHR data from any population group.1. http://emerge.mc.vanderbilt.edu/2. http://phekb.org/2
Table 1: Target comorbiditiesCongestive Heart FailureHypertensionDiabetes ComplicatedAIDSCoagulopathyDeficiency AnemiaCardiac lcohol abuseValvular DiseaseOther Neurological DisordersRenal FailureMetastatic CancerWeight lossDrug abusePulmonary Circulation DisorderChronic Pulmonary DiseasesLiver Disease (excluding bleeding)Solid Tumor (without metastasis)Fluid Electrolyte DisorderPsychosesPeripheral Vascular DisorderDiabetes UncomplicatedPeptic UlcerRheumatoid ArthritisBlood Loss AnemiaDepression2. Data ExtractionThe MIMIC-III dataset consists of de-identified EHRs for 38, 000 adult ICU patients atthe Beth Isreal Deaconess Medical Center, Boston, Massachusetts from 2001–2012. For allICU stays within each admission, clinical notes including nursing progress reports, physiciannotes, discharge summaries, ECG, etc. are available. We analyze patients who have stayedin the ICU for at least 48 hours ( 17000 patients). We derive phenotypes using clinicalnotes collected within the first 48 hours of patients’ ICU stay to evaluate the quality ofphenotypes when limited patient data is available. Further, we evaluate the phenotypeson a 30 day mortality prediction problem. To avoid obvious indicators of mortality andcomorbidities, apart from restricting to 48 hour data, we exclude discharge summaries asthey explicitly mention patient outcomes (including mortality).1. Clinically relevant bag-of-words features: Aggregated clinical notes from allsources are represented as a single bag-of-words features. To enhance clinical relevance,we create a custom vocabulary containing clinical terms from two sources (a) the Systematized Nomenclature of Medicine-Clinical Terms (SNOMED CT), and (b) the level-0 termsprovided by the Unified Medical Language System (UMLS), consolidated into a standardvocabulary format using Metamorphosys — an application provided by UMLS for customvocabulary creation.3 To extract clinical terms from the raw text, the notes were tagged forchunking using a conditional random field tagger4 . The tags are looked up against the custom vocabulary (generated from Metamorphosys) to obtain the bag-of-words representation.Our final vocabulary has 3600 clinical terms.2. Computable weak diagnosis: We incorporate domain constraints from weak supervision to ground the latent factors to have a one-to-one mapping with the conditions ofinterest. In the model described in Section 3, this is enforced by constraining the non-zeroentries on patient loading along the latent factors using a weak diagnosis for comorbidities.The weak diagnoses of target comorbidities in Table 1 are obtained using ECI5 , computedsolely from patient administrative data without human annotation. We refer to this indexas weak diagnoses as it is not a physician’s exact diagnosis and is subject to noise andmisspecification. Note that ECI ignores diagnoses code related to the primary diagnoses ofadmission. Thus, ECI models presence and absence of conditions other than the primaryreason for admission (comorbidities). The phenotype candidates from the proposed modelcan be considered as concise representations of such comorbidities.3. See https://www.nlm.nih.gov/healthit/snomedct/ and https://www.nlm.nih.gov/research/umls/4. https://taku910.github.io/crfpp/5. https://git.io/v6e7q3
Notation[m] for integer m d 1x(j)supp(x)ObservationsN, dX Rd N k 1, 2, . . . , KCj [K] for j [N ]Factor matricesW̃ [0, 1]K NÃ Rd K, b̃ Rd DescriptionSet of indices [m] {1, 2, . . . , m}.PSimplex in dimension d, d 1 {x Rd :xi 1}.Column j of a matrix X.Support of a vector x, supp(x) {i : xi 6 0}.Number of patients ( 17000) and features ( 3600), respectively.EHR matrix from MIMIC III: Clinically relevant bag-of-words featuresfrom notes in first 48 hours of ICU stay for N patients.Indices for K 30 comorbidities in Table 1.Set of comorbidities patient j is diagnosed with using ECI .Estimate of patients’ risk for the K conditions.Estimate of phenotype factor matrix and feature bias vector.Table 2: Notation used in the paper3. Identifiable High–Throughput PhenotypingThe notation used in the paper are enumerated in Table 2. In summary, for each patientj [N ], (a) the bag-of-words features from clinical notes is represented as column x(j) ofEHR matrix X Rd N, and (b) the list of comorbidities diagnosed using ECI is denoted as Cj [K]. Let an unknown W [0, 1]K N represent the risk of N patients for K lies in the interval [0, 1], with 0 and 1 indicatingcomorbidities of interest; each entry wkjno-risk and maximum-risk, respectively, of patient j being afflicted with condition k. IfCj [K] denotes an accurate diagnosis for patient j, then w (j) satisfies supp(w (j) ) Cj .Definition 1 (EHR driven phenotype) EHR driven phenotypes for K co–occurring conditions are a set of vectors {a (k) Rd : k [K]}, such that for a patient j afflicted withconditions Cj [K],P a (k) b ,(1)E[x(j) w (j) ] k C wkjjb where is a bias representing the feature component observed independent of the K targetconditions. A Rd K with a (k) as columns is referred as the phenotype factor matrix.Note that we explicitly model a feature bias b to capture frequently occurring terms thatare not discriminative of the target conditions, e.g., temperature, pain, etc.Cost Function The bag-of-words features are represented as counts in the EHR matrixX. We consider a factorized approximation of X parametrized by matrices A Rd K, K Nd W R and b R as Y AW b1 , where 1 denotes a vector of all ones ofappropriate dimension. The approximation error of the estimate is measured using theI–divergence defined as follows:D(X, Y) Pijyyij xij xij log xijij .(2)Minimizing the I–divergence is equivalent to maximum likelihood estimation under a Poisson distributional assumption on individual entries of the EHR matrix parameterized byY AW b1 (Banerjee et al., 2005).4
Algorithm 1 Phenotyping using constrained NMF.Input: X, {Cj : j [N ]} and paramter λ. Initialization: A(0) , b(0) .while Not converged doW(t) arg minW D(X, A(t 1) W b(t 1) 1 ) s.t. W [0, 1]K N , supp(wj ) Cj , jA(t) , b(t) arg minA,b 0 D(X, AW(t) b1 ) s.t. aj(k) λ d 1 , kPhenotypes For the K comorbidities, columns of A, {a(k) }k [K] are proposed as candidate phenotypes derived from the EHR X, i.e. approximations to {a (k) }k [K] .Constraints The following constraints are incorporated in learning A and W.1. Support Constraints: The non-negative rank–K factorization of X is ‘grounded’ toK target comorbidities by constraining the support of risk w(j) corresponding to patient jusing weak diagnosis Cj from ECI as an approximation of the conditions in Definition 1.2. Sparsity Constraints: Scaled simplex constraints are imposed on the columns of Awith a tuneable parameter λ 0 to encourage sparsity of phenotypes. Restricting thepatient loadings matrix as W [0, 1]K N not only allows to interpret the loadings as thepatients’ risk, but also makes simplex constraints effective in a bilinear optimization.Simultaneous phenotyping of comorbidities using constrained NMF is posed as follows:Ã, W̃, b̃ argminA 0,W 0,b 0 D(X, AW b1 )s.t.supp(w(j) ) Cj j [N ], W [0, 1]K N ,(k)a λ d 1(3) j [K],The optimization in (3) is convex in either factor with the other factor fixed. It is solvedusing alternating minimization with projected gradient descent (Parikh and Boyd, 2014;Lin, 2007). See complete algorithm in Algorithm 1. The proposed model in general canincorporate any weak diagnosis of medical conditions. In this paper, we note that, since weuse ECI, the results are not representative of the primary diagnoses at admission.4. Empirical EvaluationThe estimated phenotypes are evaluated on various metrics. We denote the model learnedusing Algorithm 1 with a given parameter λ 0 as λ–CNMF. The following baselines areused for comparison:1. Labeled LDA (LLDA): LLDA (Ramage et al., 2009) is the supervised counterpartof LDA, a probabilistic model to estimate topic distribution of a corpus. It assumes thatword counts of documents arise from multinomial distributions. It incorporates supervisionon topics contained in a document and can be naturally adapted for phenotyping from bagof-words clinical features, where the topic–word distributions form candidate phenotypes.While LLDA assumes that the topic loadings of a document lie on the probability simplex K 1 , λ–CNMF allows each patient–condition wkj loading to lie in [0, 1]. In interpretingthe patient loading as a disease risk, the latter allows patients to have varying levels ofdisease prevalence. Also, LLDA can induce sparsity only indirectly via a hyperparameterβ of the informative prior on the topic–word distributions. While this does not guarantee5
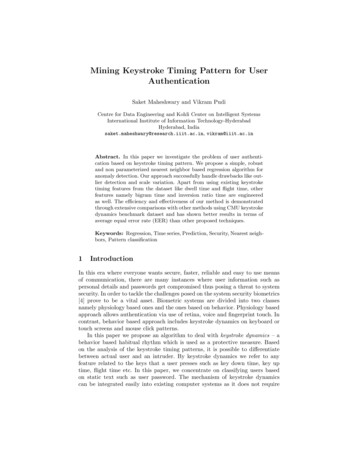
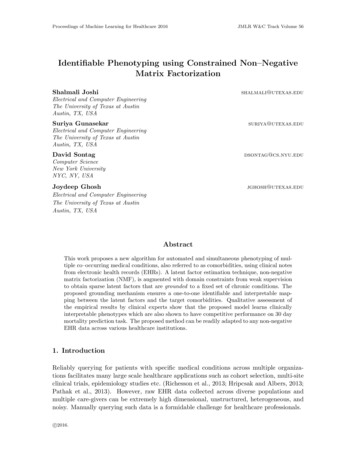
sparse estimates, we obtain reasonable sparsity on LLDA estimates. We use the Gibbssampling code from MALLET (McCallum, 2002) for inference. For a fair comparison toCNMF which uses an extra bias factor, we allow LLDA to model an extra topic shared byall documents in the corpus.2. NMF with support constraints (NMF support): This NMF model incorporates non–negativity and support constraints from weak supervision but not the sparsityinducing constraints on the phenotype matrix. This allows to study the effect of sparsityinducing constraints for interpretability. On the other hand, imposing sparsity without ourgrounding technique does not yield identifiable topics and hence is not studied as a baseline.3. Multi-label Classification (MLC): This baseline treats weak supervision (fromECI) as accurate labels in a fully supervised model. A sparsity inducing 1 regularizedlogistic regression classifier is learned for each condition independently. The learned weightvector for each condition k determines importance of clinical terms towards discriminatingpatients with condition k and are treated as candidate phenotypes for condition k.The weak supervision does not account for the primary diagnosis for admission in theICU population as the ECI ignores primary diagnoses at admission (Elixhauser et al., 1998).However, the learning algorithm can be easily modified to account for the primary diagnoses,if required by using a modified form of supervision or absorbing the effects in an additionaladditive term appended to the model. Nevertheless, the proposed model generates highlyinterpretable phenotypes for comorbidities. Finally, to mitigate the effect of local minima,whenever applicable, for each model, the corresponding algorithm was run with 5 randominitializations and results providing the lowest divergence were chosen for comparison.4.1 Interpretability–accuracy trade–offSparsity of the latent factors is used as a proxy for interpretability of phenotypes. Sparsityis measured as the median of the number of non–zero entries in columns of the phenotypematrix A (lower is better). The λ parameter in λ–CNMF controls the sparsity by imposingscaled simplex constraints on A. CNMF was trained on multiple λ in the range of 0.1 to 1.Stronger sparsity-inducing constraints results in worse fit to the cost function. This trade–off is indeed observed in all models (see A for details). For all models, we pick estimateswith lowest median sparsity while ensuring that the phenotype candidate for every conditionis represented by at least 5 non-zero clinical terms.4.2 Clinical relevance of phenotypesWe requested two clinicians to evaluate the candidate phenotypes based on the top 15terms learned by each model. The ratings were requested on a scale of 1 (poor) to 4 (excellent). The experts were asked to rate based on whether the terms are relevant towards thecorresponding condition and whether the terms are jointly discriminative of the condition.Figure 1 shows the summary of qualitative ratings obtained for all models. For each model,we show two columns (corresponding to two experts). The stacked bars show the histogramof the ratings for the models. Nearly 50% of the phenotypes learned from our model wererated ‘good’ or better by both annotators. In contrast, NMF with support constraints butwithout sparsity inducing constraints hardly learns clinically relevant phenotypes. The proposed model 0.4–CNMF also received significantly higher number of ‘excellent’ and ‘good’6
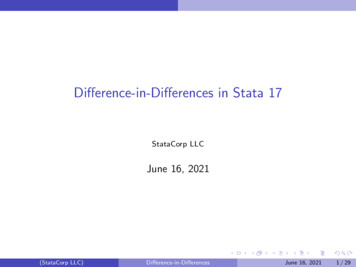
30ExcellentGoodFairPoorNumber of Phenotypes2520151050 0.4-CNMFLLDAModelMLCNMF supportFigure 1: Qualitative Ratings from Annotation: The two bars represent the ratings provided by thetwo annotators. Each bar is a histogram of the scores for the 30 comorbidities sorted by scores.0.4–CNMFLLDAMLCNMF Table 3: Relative Rankings Matrix: Each row of the table is the number of times the model alongthe row was rated strictly better than the model along the column by clinical experts, e.g., column 3in row 2 implies that LLDA was rated better than MLC 12 times over all conditions by all experts.ratings from both experts. Although LLDA and MLC estimate sparse phenotypes, theyare not at par with λ–CNMF. Table 3 shows a summary of relative rankings for all models.Each cell entry shows the number of times the model along the corresponding row was ratedstrictly better than that along the column. 0.4–CNMF is better than all three baselines.The supervised baseline MLC outperforms LLDA even though LLDA learns comorbiditiesjointly suggesting that the simplex constraint imposed by LLDA may be restrictive.Figure 2 is an example of a phenotype (top 15 terms) learned by all models for psychoses.For this condition, the proposed model was rated “excellent” and strictly better than bothLLDA and MLC by both annotators while LLDA and MLC ratings were tied. However,the phenotype for Hypertension (in Figure 3) learned by 0.4–CNMF has more terms relatedto ‘Renal Failure’ or ‘End Stage Renal Disease’ rather than hypertension. One of ourannotators pointed out that “Candidate 1 is a fairly good description of renal disease,which is an end organ complication of hypertension”, where the anonymized Candidate1 refers to 0.4–CNMF. Exploratory analysis suggests that hypertension and renal failureare the most commonly co-occurring set of conditions. Over 93% of patients that havehypertension (according to ECI) also suffer from Renal Failure. Thus, our model is unableto distinguish between highly co-occurring conditions. Other baselines were also ratedpoorly for hypertension, while LLDA was rated only slightly better. More examples ofphenotypes are provided in B.7
0.4-CNMFschizophreniabipolar disorderoverdoseschizoaffective disorderparanoiapsychosislithium toxicitypoisoningpersonalityserotonin syndromeparanoid schizophreniamental retardationsuicidepsychiatric diseasesuicide attemptLLDAaltered mental statusfeveragitatedschizophreniaagitationstress ulceroverdosebipolar disorderdeliriummental leukocytosisMLCNMF supportbipolar disorderpainschizophreniapneumothoraxflat affectagitatedoverdoseedemaschizoaffective edlvhaspirationmetastatic prostate cancer opacitydiastolic dysfunctionpleural effusionagitatedagitationlethargytraumasuicidal ideationschizophreniaileusstress ulceracquired immunodeficiency syndromebipolar disorderFigure 2: Phenotypes learned for ‘Psychoses’ (words are listed in order of importance)0.4-CNMFesrdcrickdchronic renal insufficiencychronic renal failureend stage renal diseaseacute on chronic renal failurechronic kidney diseasecns lymphomajaw painamyloidosisskin osystolic murmurLLDAchfhtnhypertensionchest paincadcracklessobcppulmonary edemaischemiastress ulcerheart failuregibdyspneanauseaMLCcriav fistulachronic renal insufficiencyckdleft ventricular hypertrophyrenal insufficiencyesrdchronic renal failureacute on chronic renal failuresinus rhythmcardiomegalyleft atrial abnormalityjaw painhtnrenal failureNMF supporthtnpainintraventricular hemorrhagepulmonary edemahypoxiahydrocephalushypotensioncoughacute renal eFigure 3: Phenotypes learned for ‘Hypertension’4.3 Mortality predictionTo quantitatively evaluate the utility of the learned phenotypes, we consider the 30 daymortality prediction task. We divide the EHR into 5 cross-validation folds of 80% trainingand 20% test patients. As this is an imbalanced class problem, the training–test splits arestratified by mortality labels. For each split, all models were applied on the training data toobtain phenotype candidates à and feature biases b̃. For each model, the patient loadings W̃along the respective phenotype space (Ã, b̃) are used as features to train a logistic regressionclassifier for mortality prediction. For CNMF and NMF support, these are obtained asWtrain/test argminW [0,1]K N D(ÃW b̃1 , Xtrain/test ) for fixed (Ã, b̃). For LLDA, theseare obtained using Gibbs sampling with fixed topic–word distributions. For MLC, thepredicted class probabilities of the comorbidities are used as features. Additionally, wetrain a logistic regression classifier using the full EHR matrix as features.We clarify the following points on the methodology: (1) à is learned on the patientsin the training dataset only, hence there is no information leak from test patients intotraining. (2) Test patients’ comorbidities from ECI are not used as support constraints ontheir loadings. (3) Regularized logistic regression classifiers are used to learn models formortality prediction. The regularization parameters are chosen via grid-search.The performance of the above baselines trained on 2 regularized logistic regression overa 5-fold cross-validation is reported in Table 4: rows 1–5. The classifier trained on the fullEHR unsurprisingly outperforms all baselines as it uses richer high dimensional information. All phenotyping baselines, except NMF support, show comparable performance onmortality prediction which in spite of learning on a small number of 30 features, is onlyslightly worse than predictive performance of full EHR with 3500 features.8
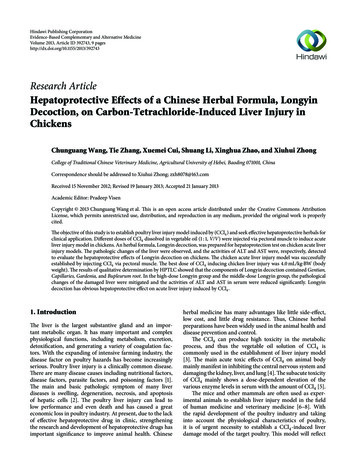
1.2.3.4.5.6.Model0.4–CNMFNMF supportLLDAMLCFull EHRCNMF Full EHR ( 1 , C )0.71(0.07)Table 4: 30 day mortality prediction: 5–fold cross-validation performance of logistic regression classifiers. Classifiers for 0.4–CNMF and competing baselines (NMF support, LLDA, MLC) were trainedon the 30 dimensional phenotype loadings as features. Full EHR denotes the baseline classifier ( 1 regularized logistic regression) using full 3500 dimensional EHR as features. CNMF Full EHRdenotes the performance of the 1 -regularized classifier learned on Full EHR augmented with CNMFfeatures (hyperparameter was manually tuned to match performance of the Full EHR model).Augmented features for mortality prediction (CNMF Full EHR) Unsurprisingly, Table 4 suggests that the high dimensional EHR data has additional informationtowards mortality prediction which are lacking in the 30 dimensional features generated viaphenotyping. To evaluate whether this additional information can be captured by CNMFif augmented with a small number of raw EHR features, we train a mortality predictionclassifier using 1 regularized logistic regression on CNMF features/loadings combined withraw bag–of–words features, with parameters tuned to match the performance of the fullEHR model. The results are reported in the final row of Table 4.In exploring the weights learned by the classifier for all features, we observe that only8.3% of the features corresponding to raw EHR based bag-of-words features have non–zero weights. This suggests that comorbidities capture significant amount of predictiveinformation on mortality and achieve comparable performance to full EHR model with asmall number of additional terms. See Figure 35 in Appendix showing the weights learnedby the classifier for all features. Figure 4 shows comorbidities and EHR terms with topmagnitude weights learned by the CNMF full EHR classifier. For example, it is interestingto note that the top weighted EHR term – dnr or ‘Do Not Resuscitate’ is not indicative ofany comorbidity but is predicitive of patient mortality.5. Discussion and Related WorkSupervised learning methods like Carroll et al. (2011); Kawaler et al. (2012); Chen et al.(2013) or deep learning methods (Lipton et al., 2015; Kale et al., 2015; Henao et al., 2015) forEHR driven phenotyping require expert supervision. Although unsupervised methods likeNMF (Anderson et al., 2014) and non–negative tensor factorization (Kolda and Bader, 2009;Harshman, 1970) are inexpensive alternatives (Ho et al., 2014a,b,c; Luo et al., 2015), theypose challenges with respect to identifiability, interpretability and computation, limitingtheir scalability.Most closely related to our paper is work by Halpern et al. (2016b) which is a semisupervised algorithm for learning the joint distribution on conditions, requiring only thata domain expert specify one or more ‘anchor’ features for each condition (no other labeleddata). An ‘anchor’ for a condition is a set of clinical features that when present are highlyindicative of the target condition, but whose absence is not a strong label for absence of9
Figure 4: Top magnitude weights on (a) EHR and (b) CNMF features in CNMF Full EHR classifierthe target condition (Halpern et al., 2014, 2016a). For example, the presence of insulinmedication is highly indicative of diabetes, but the converse is not true. Joshi et al. (2015)use a similar supervision approach for comorbidities prediction. Whereas the conditions inHalpern et al. (2016b) are binary valued, in our work they are real-valued between 0 and 1.Furthermore, we assume that the support of the conditions is known in the training data.Our approach achieves identifiability using support constraints to ground the latent factors and interpretability using sparsity constraints. The phenotypes learned are clinicallyinterpretable and predictive of mortality when augmented with a sparse set of raw bag-ofwords features on unseen patient population. The model outperforms baselines in termsof clinical relevance according to experts and significantly better than the model whichincludes supervision but no sparsity constraints. The proposed method can be easily extended to other non–negative data to obtain more comprehensive phenotypes. However,it was observed that the algorithm does not discriminate between frequently co–occurringconditions, e.g. renal failure and hypertension. Further, the weak supervision (using ECI)does not account for the primary diagnoses of admission. Additional model flexibility toaccount for a primary condition in explaining the observations could potentially improveperformance. Addressing the above limitations along with quantitative evaluation of risk fordisease prediction, and understanding conditions for uniqueness of phenotyping solutionsare interesting areas of follow-up work.10
AcknowledgementsWe thank Dr. Saul Blecker and Dr. Stephanie Kreml for their qualitative evaluation ofthe computational phenotypes. SJ, SG and JG were supported by NSF: SCH #1418511.DS was supported by NSF CAREER award #1350965. We also thank Yacine Jernite forsharing a code used in preprocessing clinical notes.ReferencesA. Anderson, P. K. Douglas, W. T. Kerr, V. S. Haynes, A. L. Yuille, J. Xie, Y. N. Wu, J. A.Brown, and M. S. Cohen. Non-negative matrix factorization of multimodal MRI, fMRIand phenotypic data reveals differential changes in default mode subnetworks in ADHD.Neuroimage, 2014.A. Banerjee, S. Merugu, I. S. Dhillon, and J. Ghosh. Clustering with bregman divergences.Journal of Machine Learning Research, 2005.D. M. Blei, A. Y. Ng, and M. I. Jordan. Latent dirichlet allocation. Journal of MachineLearning Research, 2003.R. J. Carroll, A. E. Eyler, and J. C. Denny. Naive electronic health record phenotypeidentification for rheumatoid arthritis. In AMIA Annual Symposium, 2011.Y. Chen, R. J. Carroll, E. Hinz, A. Shah, A. E. Eyler, J. C. Denny, and H. Xu. Applyingactive learning to high-throughput phenotyping algorithms for electronic health recordsdata. Journal of the American Medical Informatics Association, 2013.A. Elixhauser, C. Steiner, D. R. Harris, and R. M. Coffey. Comorbidity measures for usewith administrative data. Medical Car
notes in a publicly accessible MIMIC-III EHR database (Saeed et al., 2011). We present a novel constrained non{negative matrix factorization (CNMF) for the EHR matrix that aligns the factors with target comorbidities yielding sparse, interpretable, and identi able phenotypes. The following aspects of our model distinguish our work from prior e .