Transcription
Final Disparities 2010 Layout 1 4/13/11 2:17 PM Page 169Chapter 5. Patient CenterednessThe Institute of Medicine identifies patient centeredness as a core component of quality health care.1 Patientcenteredness is defined as:[H]ealth care that establishes a partnership among practitioners, patients, and their families (whenappropriate) to ensure that decisions respect patients’ wants, needs, and preferences and that patientshave the education and support they need to make decisions and participate in their own care.2Patient centeredness “encompasses qualities of compassion, empathy, and responsiveness to the needs,values, and expressed preferences of the individual patient.”1 In addition, translation and interpretationservices facilitate communication between the provider and the patient and are often a legal requirement.i Thepatient-centered approach includes viewing the patient as a unique person, rather than focusing strictly on theillness, building a therapeutic alliance based on the patient’s and the provider’s perspectives.Patient-centered care is supported by good provider-patient communication so that patients’ needs and wantsare understood and addressed and patients understand and participate in their own care.2-5 This approach tocare has been shown to improve patients’ health and health care.3,4,6-8 Unfortunately, many barriers exist togood communication.Providers also differ in communication proficiency, including varied listening skills and different views fromtheir patients’ of symptoms and treatment effectiveness.9 Additional factors influencing patient centerednessand provider-patient communication include: Language barriers. Racial and ethnic concordance between the patient and provider. Effects of disabilities on patients’ health care experiences. Providers’ cultural competency.Efforts to remove these possible impediments to patient centeredness are underway within the Department ofHealth and Human Services (HHS). For example, the Office of Minority Health has developed a set ofCultural Competency Curriculum Modules that aim to equip providers with cultural and linguisticcompetencies to help promote patient-centered care.10, ii These modules are based on the National Standardson Culturally and Linguistically Appropriate Services. The standards are directed at health care organizationsand aim to improve the patient centeredness of care for people with limited English proficiency (LEP).Another example, which is being administered by the Health Resources and Services Administration, isUnified Health Communication, a Web-based course for providers that integrates concepts related to healthliteracy with cultural competency and LEP.iiiFor example, Title VI of the Civil Rights Act of 1964, 42 U.S.C. 2000d, may require the practitioner or hospital to providelanguage interpreters and translate vital documents for limited-English-proficient persons. Section 504 of the RehabilitationAct of 1973, 29 U.S.C. 794, may require the practitioner or hospital to provide sign language interpreters, materials in Braille,and/or accessible electronic formats for individuals with disabilities.iiThis online program (available at http://www.thinkculturalhealth.org) is accredited for Continuing Medical Education creditsfor physicians and Continuing Education Units for nurses and pharmacists.iiiThis online program (available at http://www.hrsa.gov/publichealth/healthliteracy/) is accredited for Continuing MedicalEducation credits for physicians and Continuing Education Units for nurses, physician assistants, pharmacists, and CertifiedHealth Education Specialists.iNational Healthcare Disparities Report, 2010169
Final Disparities 2010 Layout 1 4/13/11 2:17 PM Page 170Chapter 5In addition, the HHS Office for Civil Rights has issued Guidance to Federal Financial Assistance RecipientsRegarding Title VI Prohibition Against National Origin Discrimination Affecting Limited English ProficientPersons. This guidance explains that recipients of Federal financial assistance must take reasonable steps toprovide LEP people with a meaningful opportunity to participate in HHS-funded programs. Failure to do somay violate the prohibition under Title VI of the Civil Rights Act of 1964, 42 U.S.C. 2000d, against nationalorigin discrimination.11ImportanceMorbidity and Mortality Patient-centered approaches to care have been shown to improve patients’ health status. Theseapproaches rely on building a provider-patient relationship, improving communication, fostering apositive atmosphere, and encouraging patients to actively participate in provider-patient interactions.3, 4 A patient-centered approach has been shown to lessen patients’ symptom burden.6 Patient-centered care encourages patients to comply with treatment regimens.8 Patient-centered care can reduce the chance of misdiagnosis due to poor communication.7Cost Patient centeredness has been shown to reduce underuse and overuse of medical care.12 Patient centeredness can reduce the strain on system resources and save money by reducing the numberof diagnostic tests and referrals.6 Although some studies have shown that being patient centered reduces medical costs and use of healthservice resources, others have shown that patient centeredness increases providers’ costs, especially inthe short run.13MeasuresThe National Healthcare Quality Report (NHQR) and the National Healthcare Disparities Report (NHDR)track several measures of patients’ experience of care. The reports also include one priority and two goalsrecommended by the National Priorities Partnership (NPP). NPP identified patient and family engagement asone of six national priorities. The vision is health care “ that honors each individual patient and family,offering voice, control, choice, skills in self-care, and total transparency, and that can and does adapt readilyto individual and family circumstances, and to differing cultures, languages, and social backgrounds.” Keygoals include enabling patients to effectively navigate and manage their care and enabling patients to makeinformed decisions about their treatment options.The core measure presented in this report is adults and children who reported poor communication at thedoctor’s office. This measure is a composite of four measures—patients’ assessments of how often theirprovider listened carefully to them, explained things clearly, respected what they had to say, and spent enoughtime with them. This measure is presented separately for adults and children.National Healthcare Disparities Report, 2010170
Final Disparities 2010 Layout 1 4/13/11 2:17 PM Page 171The measures related to the NPP goals are: Enabling patients to effectively navigate and manage their care. Usual source of care with or without language assistance. Need for a translator. Ability to read the instructions on a prescription bottle. Enabling patients to make informed decisions about their treatment options. Ability to understand information from a doctor’s office. Patient participation in treatment decisions.FindingsPatients’ Experience of Care—AdultsOptimal health care requires good communication between patients and providers, yet barriers to providerpatient communication are common. To provide all patients with the best possible care, providers must beable to understand patients’ diverse health care needs and preferences and communicate clearly with patientsabout their care.Figure 5.1. Adults who had a doctor’s office or clinic visit in the last 12 months who reported poorcommunication with health providers, by race, ethnicity, and income, 2002-2007National Healthcare Disparities Report, 2010171Chapter 5In addition, the NHDR includes a supporting measure on adults who reported poor communication during ahospital stay. This measure is a composite of three measures—patients’ assessments during a hospital stay ofhow often their doctors/nurses listened carefully to them, explained things clearly, and treated them withcourtesy and respect. This measure is presented separately for communication with nurses andcommunication with doctors.
Final Disparities 2010 Layout 1 4/13/11 2:17 PM Page 172Chapter 5Source: Agency for Healthcare Research and Quality, MedicalExpenditure Panel Survey, 2002-2007.Denominator: Civilian noninstitutionalized population age 18 andover who had a doctor’s office or clinic visit in the last 12 months.Note: Patients who report that their health providers sometimes ornever listened carefully, explained things clearly, showed respect forwhat they had to say, or spent enough time with them areconsidered to have poor communication. Between 2002 and 2007, the percentage of White, middle-income, and high-income adults whoreported poor communication with their health providers significantly decreased (Figure 5.1). In all years, the percentage of adults who reported poor communication was significantly higher forpoor, near-poor, and middle-income people than for high-income people. In all years, Hispanics were significantly more likely than non-Hispanic Whites to report poorcommunication. In 4 of 6 years, Black patients were more likely than Whites to report poor communication with healthproviders; the exceptions were 2006 and 2007. In 5 of 6 years, Asians were more likely than Whites to report poor communication; the exception was2007.Also, in the NHQR: In 5 of 6 years, a significantly lower percentage of adults in large fringe metropolitan areas reportedpoor communication with their health providers; 2006 was the exception.Racial and ethnic minorities are disproportionately of lower education levels. To distinguish the effects ofrace, ethnicity, education, and activity limitation on provider-patient communication, this measure is stratifiedby education level and activity limitation.National Healthcare Disparities Report, 2010172
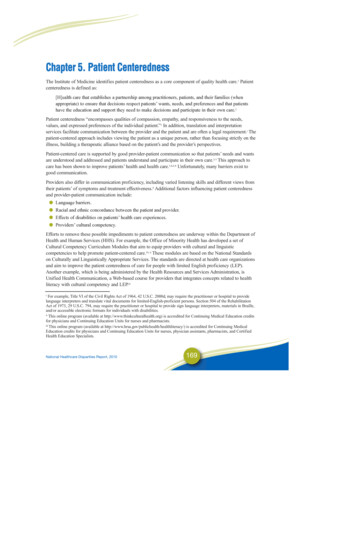
Final Disparities 2010 Layout 1 4/13/11 2:17 PM Page 173Source: Agency for Healthcare Research and Quality, Medical Expenditure Panel Survey, 2007.Denominator: Civilian noninstitutionalized population age 18 and over.Note: Sample sizes were too small to provide estimates for Asians with less than a high school education and Asians with activitylimitations. Patients who report that their health providers sometimes or never listened carefully, explained things clearly, showedrespect for what they had to say, or spent enough time with them are considered to have poor communication.National Healthcare Disparities Report, 2010173Chapter 5Figure 5.2. Adult ambulatory patients who reported poor communication with health providers, by raceand ethnicity, stratified by education and activity limitation, 2007
Final Disparities 2010 Layout 1 4/13/11 2:17 PM Page 174Chapter 5 The amount of education attained and activity limitation status explains some of the racial and ethnicdifferences in provider-patient communication for patients age 18 and over. A significantly higherpercentage of Blacks and Hispanics with no college education reported poor communication with theirhealth provider compared with Whites and non-Hispanic Whites with no college education. However,there is no statistically significant difference between Blacks and Whites with some college education(Figure 5.2). Among high school graduates, Blacks (11.4%) were more likely than Whites (8.3%) and Hispanics(11.4%) were more likely than non-Hispanic Whites (8.0%) to report poor communication with theirhealth providers. Although Blacks were more likely than Whites to report poor communication overall in 2007 (10.4%compared with 9.0%), the Black versus White differences in reporting poor communication were notstatistically significant within any of the three activity limitation groups: basic, complex, and neitherbasic nor complex. In 2007, Hispanics were more likely to report poor communication than non-Hispanic Whites overall(11.8% compared with 8.6%) and for adults with neither basic nor complex activity limitations (11.6%compared with 8.2%).Patients’ Experience of Care—ChildrenCommunication in children’s health care can be challenging since the child’s experiences are interpretedthrough the eyes of a parent or guardian. During a health care encounter, a responsible adult caregiver will beinvolved in communicating with the provider and interpreting decisions in an age-appropriate manner to thepatient. Optimal communication in children’s health care can therefore have a significant impact on receiptof high-quality care and subsequent health status. This is especially true for children with special healthcare needs.National Healthcare Disparities Report, 2010174
Final Disparities 2010 Layout 1 4/13/11 2:18 PM Page 175Source: Agency for Healthcare Research and Quality, MedicalExpenditure Panel Survey, 2002-2007.Denominator: Civilian noninstitutionalized population under age18.Note: Data for Asians (2005 and 2007) and multiple-race children(2006 only) did not meet criteria for statistical reliability. Parentswho report that their child’s health providers sometimes or neverlistened carefully, explained things clearly, showed respect for whatthey had to say, or spent enough time with them are considered tohave poor communication. Overall, the percentage of children whose parents or guardians reported poor communication with theirhealth providers significantly decreased from 6.7% in 2002 to 4.9% in 2007 (data not shown).National Healthcare Disparities Report, 2010175Chapter 5Figure 5.3. Children who had a doctor’s office or clinic visit in the last 12 months whose parentsreported poor communication with health providers: Overall composite, by race, ethnicity, and familyincome, 2002-2007
Final Disparities 2010 Layout 1 4/13/11 2:18 PM Page 176Chapter 5 From 2002 to 2007, Whites, Blacks, people of more than one race, non-Hispanic Whites, Hispanics;and poor, near-poor, and middle-income people all had a significant decrease in the percentage ofchildren whose parent or guardian reported poor communication (Figure 5.3). From 2002 to 2007, the percentage of children whose parents or guardians reported poorcommunication with their health providers remained significantly higher for Hispanics than for nonHispanic Whites. Similarly, the percentage of children from poor families whose parents or guardiansreported poor communication with their health providers was significantly higher than children fromhigh-income families. In all years, a significantly higher percentage of poor and near-poor parents reported poor communicationthan parents with high incomes. In 5 of 6 years, there was also a higher percentage of middle-incomeparents than high-income parents reporting poor communication; 2007 was the exception.Also, in the NHQR: In 4 of 6 years, a significantly lower percentage of parents residing in large fringe metropolitan areasreported poor communication with their health provider than parents residing in large centralmetropolitan areas; 2006 and 2007 were the exceptions.Racial and ethnic minorities have disproportionately lower incomes. To distinguish the effects of race,ethnicity, and income on provider-patient communication, this measure is stratified by income level.Figure 5.4. Composite measure: Children with ambulatory visits whose parents reported poorcommunication with health providers, by ethnicity, stratified by income, 2007Source: Agency for Healthcare Research and Quality, Medical Expenditure Panel Survey, 2007.Denominator: Civilian noninstitutionalized population under age 18.Note: Data were not available for high-income Hispanics. Parents who report that their child’s health providers sometimes or neverlistened carefully, explained things clearly, showed respect for what they had to say, or spent enough time with them are considered tohave poor communication.National Healthcare Disparities Report, 2010176
Final Disparities 2010 Layout 1 4/13/11 2:18 PM Page 177 Among poor individuals, Hispanics were as likely as non-Hispanic Whites to report poorcommunication with their health providers (Figure 5.4).Also, in the NHQR: Children residing in large central and small metropolitan areas showed significant decreases in poorcommunication from 2002 to 2007.Patients’ Experience of Care—HospitalUsing methods developed for the CAHPS (Consumer Assessment of Healthcare Providers and Systems)survey,14 the NHQR and NHDR use a composite measure that combines three measures of provider-patientcommunication into a single core measure. The three measures are: providers who sometimes or never listencarefully, explain things clearly, and respect what patients say. These data are presented separately forcommunication with doctors and communication with nurses.Figure 5.5. Adult hospital patients who reported poor communication with nurses and with doctors, byrace, ethnicity, education, and language, 2007National Healthcare Disparities Report, 2010177Chapter 5 Overall, there was no statistically significant difference between non-Hispanic Whites and Hispanicswho reported poor communication with their health providers (data not shown).
Final Disparities 2010 Layout 1 4/13/11 2:18 PM Page 178Chapter 5Key: NHOPI Native Hawaiian or Other PacificIslander; AI/AN American Indian or Alaska Native.Source: Agency for Healthcare Research andQuality, Hospital CAHPS (Consumer Assessmentof Healthcare Providers and Systems) Survey, 2007.Note: Poor communication is defined as responded“sometimes” or “never” to the set of surveyquestions: “During this hospital stay, how often diddoctors/nurses treat you with courtesy andrespect?” “During this hospital stay, how often diddoctors/nurses listen carefully to you?” and “Duringthis hospital stay, how often did doctors/nursesexplain things in a way you could understand?” Overall, 5.9% of adult hospital patients reported poor communication with nurses during their hospitalstay, and 5.3% reported poor communication with doctors (data not shown). Compared with Whites, all minority groups were more likely to report poor communication with nurses(Figure 5.5). Blacks, American Indians and Alaska Natives, and patients of more than one race weremore likely to report poor communication with doctors. Compared with non-Hispanic Whites, Hispanics were more likely to report poor communication withnurses but not with doctors. Compared with patients with at least some college education, patients with less than a high schooleducation were more likely to report poor communication with both nurses and doctors. Compared with patients who speak English at home, patients who speak Spanish at home were morelikely to report poor communication with nurses while patients who speak some other language at homewere more likely to report poor communication with both nurses and doctors.Also, in the NHQR: Compared with patients ages 18-44, patients ages 45-64 were more likely to report poor communicationwith doctors. Patients age 65 and over were less likely to report poor communication with nurses.National Healthcare Disparities Report, 2010178
Final Disparities 2010 Layout 1 4/13/11 2:18 PM Page 179To effectively navigate the complicated health care system, health care providers need to provide patientswith access to culturally and linguistically appropriate tools to support patient engagement. Clearcommunication is an important component of effective health care delivery. It is vital for providers tounderstand patients’ health care needs and for patients to understand providers’ diagnoses and treatmentrecommendations. Communication barriers can relate to language, culture, and health literacy.For people with limited English proficiency, having language assistance is of particular importance, so theymay choose a usual source of care in part based on language concordance. Not having a language-concordantprovider may limit or discourage some patients from establishing a usual source of care.To fill the data gap that currently exists, we examined subnational data-gathering activities and identified theCalifornia Health Interview Survey (CHIS) as a unique source of this information. CHIS is conducted by theUCLA Center for Health Policy Research in collaboration with the California Department of Public Health,the Department of Health Care Services, and the Public Health Institute.Every 2 years, CHIS involves random-dial telephone interviews with up to 50,000 California households.The people included in CHIS are a statistically representative sample of the entire State’s diverse population.With each survey cycle, new households are selected to participate. Beginning in 2007, CHIS also includes asample of cell-phone-only households, which are often younger and more mobile Californians frequentlyoverlooked in land-line surveys.Language AssistanceLanguage barriers in health care are associated with decreases in quality of care, safety, and patient andclinician satisfaction and contribute to health disparities, even among people with insurance. The FederalGovernment has issued 14 culturally and linguistically appropriate services (CLAS) standards. Thesestandards, which are directed at health care organizations, are also encouraged for individual providers toimprove accessibility of their practices. The 14 standards are organized by themes: Culturally CompetentCare (Standards 1-3), Language Access Services (Standards 4-7), and Organizational Supports for CulturalCompetence (Standards 8-14). For people with limited English proficiency, having CLAS is of particularimportance and may influence the patient’s choice of a usual source of care.National Healthcare Disparities Report, 2010179Chapter 5Patient and Family Engagement: Enabling Effective Patient Navigation andManagement of Care
Final Disparities 2010 Layout 1 4/13/11 2:18 PM Page 180Chapter 5Figure 5.6: Adults with limited English proficiency, by whether they had a usual source of care with orwithout language assistance, by race, ethnicity, income, and education, 2007Key: USC usual source of care.Source: Agency for Healthcare Research and Quality, Medical Expenditure Panel Survey, 2007. In 2007, Hispanic adults were significantly more likely than non-Hispanic adults to have a usual sourceof care with language assistance (Figure 5.6). In 2007, White adults with limited English proficiency were significantly more likely than Asians tohave a usual source of care with language assistance.Need for a TranslatorThe ability of providers and patients to communicate clearly with each other can be compromised if they donot speak the same language. Quality may suffer if patients with limited English proficiency cannot expresstheir care needs to providers who speak English only or who do not have an interpreter’s assistance.Communication problems between the patient and provider can lead to lower patient adherence to medicationregimens and decreased participation in medical decisionmaking. It also can exacerbate cultural differencesthat impair the delivery of quality health care.National Healthcare Disparities Report, 2010180
Final Disparities 2010 Layout 1 4/13/11 2:18 PM Page 181Source: University of California, Los Angeles, Center for Health Policy Research, California Health Interview Survey, 2007. In 2007, non-Hispanic White patients in California were significantly less likely than Hispanic patientsto need a translator during their last doctor visit (Figure 5.7). Non-Hispanic Whites also were less likelythan Mexicans and Central Americans to need a translator. Asians were significantly more likely thannon-Hispanic Whites to need a translator during their last doctor visit (4.1% compared with 0.7%).There were however, no statistically significant differences between the overall Asian population andChinese or Vietnamese patients. There also were no significant differences between Chinese andVietnamese patients. Poor (8.9%), low-income (7.0%), and middle-income (3.1%) patients also were significantly morelikely than high-income (0.9%) patients to need a translator. Patients in California with less than a high school education and high school graduates weresignificantly more likely to need a translator than patients with some college education (12.0% and 2.6,respectively, compared with 1.1%).Ability to Read Instructions on a Prescription BottleThe effectiveness of a prescription is due in large part to the patient’s ability to follow dosing instructionscorrectly. If the patient misinterprets the amount of medication to be taken or the dosing schedule, an adverseevent can occur. This is particularly true for patients taking multiple medications that require strict adherence.This misunderstanding can be due to the patient’s health literacy levels, cognitive abilities, or visualNational Healthcare Disparities Report, 2010181Chapter 5Figure 5.7. Adults age 18 and over who needed a translator during last doctor visit, California, byrace/ethnicity, income, and education, 2007
Final Disparities 2010 Layout 1 4/13/11 2:18 PM Page 182Chapter 5impairment. It is important that health care providers not only rely on patients saying they understandmedication instructions, but also insist that the patients clearly demonstrate their understanding.Figure 5.8. Adults who found it easy to read the instructions on a prescription bottle, by race/ethnicity,income, education, and English proficiency, California, 2007Key: AI/AN American Indian or Alaska Native.Source: University of California, Los Angeles, Center for Health Policy Research, California Health Interview Survey, 2007. Poor patients in California were less likely than high-income patients to find it easy to read theinstructions on a prescription bottle (81.8% compared with 95.6%; Figure 5.8). The percentage of patients in California who found it easy to read the instructions on a prescriptionbottle was higher for high school graduates and people with at least some college education comparedwith patients with less than a high school education. (92.9% and 95.0%, respectively, compared with80.2%). In 2007, patients in California who did not speak English well or at all were less likely than patientswho speak English only to find it easy to read the instructions on a prescription bottle (75.1% comparedwith 95.4%).Also, in the NHQR: In California, patients under age 65 with public insurance and uninsured patients were less likely thanpatients with private health insurance to find it easy to read the instructions on a prescription bottle.National Healthcare Disparities Report, 2010182
Final Disparities 2010 Layout 1 4/13/11 2:18 PM Page 183Figure 5.9. Adults who found it easy to read the instructions on a prescription bottle, by Hispanic andAsian ethnicity, California, 2007Source: University of California, Los Angeles, Center for Health Policy Research, California Health Interview Survey, 2007. In 2007, among different Hispanic ethnic groups in California, there were no statistically significantdifferences in patients who found it easy to read the instructions on a prescription bottle (Figure 5.9). In 2007, Filipinos, Vietnamese people, and South Asians living in California were significantly morelikely than the overall Asian population to find it easy to read the instructions on a prescription bottle. In 2007, Filipinos, Japanese people, Vietnamese people, and South Asians living in California were allmore likely than Chinese people to find it easy to read the instructions on a prescription bottle. In California overall, Asians were significantly more likely than Hispanics to find it easy to read theinstructions on a prescription bottle (89.5% compared with 87.2%).National Healthcare Disparities Report, 2010183Chapter 5Important individual differences exist within each ethnic group. There are national differences as well asother subgroup differences that have to be acknowledged in order to provide appropriate cultural andlinguistic care. To examine these differences, we present data on Hispanic and Asian subgroups in California.
Final Disparities 2010 Layout 1 4/13/11 2:18 PM Page 184Chapter 5Patient and Family Engagement: Enabling Patients To Make Informed DecisionsAbout Their Treatment OptionsThe NPP recommends that health care organizations and their staff use proven and culturally andlinguistically appropriate strategies and tools to enable patients to understand all treatment options and tomake decisions consistent with their values and preferences.Understanding Information From a Doctor’s OfficeRecovery from illness and disease self-management depend in large part on patients’ ability to follow theirdoctors’ instructions at home. Patients can sometimes leave their doctors’ office thinking they understand theinstructions given to them only to realize later that some information is unclear. It is important that bothpatients and physicians not assume that instructions are understood but develop a means to showcomprehension.Figure 5.10. Adults who find it easy to understand written information from a doctor’s office, by race,ethnicity, income, education, and English proficiency, California, 2007Key: AI/AN American Indian or Alaska Native.Source: University of California, Los Angeles, Center for Health Policy Research, California Health Interview Survey, 2007. Non-Hispanic White patients living in California were more likely than all other racial and ethnicgroups to find it easy to understand information from a doctor’s office (Figure 5.10).National Healthcare Disparities Report, 2010184
Final Disparities 2010 Layout 1 4/13/11 2:18 PM Page 185 In 2007, patients living in California with less than a high school education were significantly lesslikely than patients with some college education to find it easy to understand information from adoctor’s office (65.4% compared with 90.0%). In 2007, patients living in California who did not speak English well or at all were less likely thanpatients who speak English only or patients who speak English well
Among high school graduates, Blacks (11.4%) were more likely than Whites (8.3%) and Hispanics (11.4%) were more likely than non-Hispanic Whites (8.0%) to report poor communication with their health providers. Although Blacks were more likely than Whites to report poor communication overall in 2007 (10.4%