Transcription
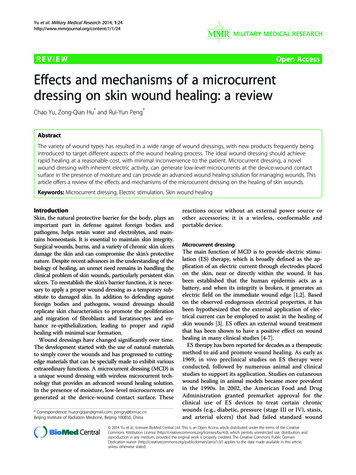
Biomech Model MechanobiolDOI 10.1007/s10237-011-0325-zORIGINAL PAPERExperimental investigation of collagen waviness and orientationin the arterial adventitia using confocal laser scanning microscopyR. Rezakhaniha · A. Agianniotis · J. T. C. Schrauwen ·A. Griffa · D. Sage · C. V. C. Bouten ·F. N. van de Vosse · M. Unser · N. StergiopulosReceived: 17 August 2010 / Accepted: 20 June 2011 The Author(s) 2011. This article is published with open access at Springerlink.comAbstract Mechanical properties of the adventitia are largelydetermined by the organization of collagen fibers. Measurements on the waviness and orientation of collagen, particularly at the zero-stress state, are necessary to relate thestructural organization of collagen to the mechanicalresponse of the adventitia. Using the fluorescence collagenmarker CNA38-OG488 and confocal laser scanning microscopy, we imaged collagen fibers in the adventitia of rabbit common carotid arteries ex vivo. The arteries were cutopen along their longitudinal axes to get the zero-stress state.We used semi-manual and automatic techniques to measureparameters related to the waviness and orientation of fibers.R. Rezakhaniha and A. Agianniotis contributed equally to this work.R. Rezakhaniha · A. Agianniotis · N. StergiopulosLaboratory of Hemodynamics and Cardiovascular Technology,Institute of Bioengineering, EPFL, Lausanne, SwitzerlandJ. T. C. Schrauwen · F. N. van de VosseCardiovascular Biomechanics, Department of BiomedicalEngineering, Eindhoven University of Technology, Eindhoven,The NetherlandsA. GriffaBioimaging and Optics Platform, Life Science Faculty, EPFL,Lausanne, SwitzerlandD. Sage · M. UnserBiomedical Imaging Group, EPFL, Lausanne, SwitzerlandC. V. C. BoutenSoft Tissue Biomechanics and Engineering,Department of Biomedical Engineering,Eindhoven University of Technology, Eindhoven, The NetherlandsA. Agianniotis (B)EPFL STI IBI-STI LHTC, BM 5128 (Bâtiment BM), Station 17,1015 Lausanne, Switzerlande-mail: aristotelis.agianniotis@epfl.chOur results showed that the straightness parameter (definedas the ratio between the distances of endpoints of a fiberto its length) was distributed with a beta distribution (meanvalue 0.72, variance 0.028) and did not depend on the meanangle orientation of fibers. Local angular density distributions revealed four axially symmetric families of fibers withmean directions of 0 , 90 , 43 and 43 , with respect tothe axial direction of the artery, and corresponding circularstandard deviations of 40 , 47 , 37 and 37 . The distribution of local orientations was shifted to the circumferentialdirection when measured in arteries at the zero-load state(intact), as compared to arteries at the zero-stress state (cutopen). Information on collagen fiber waviness and orientation, such as obtained in this study, could be used to developstructural models of the adventitia, providing better meansfor analyzing and understanding the mechanical propertiesof vascular wall.Keywords Orientation distribution ·Waviness distribution · Collagen fibers · Arteries ·Common carotid artery1 IntroductionDetailed biomechanical modeling of blood vessels shouldideally be based on the structural properties of the mainconstituents of the wall with respect to its different layers.The adventitia is the outermost layer of blood vessels and itsmechanical properties are determined mainly by the organization of collagen fibers in this layer. The two main features,characterizing collagen fiber organization, are its wavinessand angular dispersion. Other factors that could determinethe mechanical properties of the adventitia are collagen123
R. Rezakhaniha et al.cross-linking, fiber density and glycoproteins (Williams et al.2009; Et-Taouil et al. 2001).Different techniques such as polarized light microscopy(PLM) (Hilbert et al. 1996; Canham et al. 1991; Smith et al.1981; Finlay et al. 1995; Braga-Vilela et al. 2008; Rieppoet al. 2008; Whittaker and Canham 1991), small angle lightscattering (SALS) (Ferdman and Yannas 1993; Sacks et al.1997; Billiar and Sacks 1997), transmitted light microscopy(TLM) (Elbischger et al. 2005; Canham et al. 1989), fluorescence microscopy (FM) (Axer et al. 2001; Young et al.1998), micro coherence tomography (Micro-CT) (Xia andElder 2001), optical coherence tomography (OCT) (Hansenet al. 2002), small angle X-ray scattering (SAXS), secondharmonic generation (SHG) (Boerboom et al. 2007; Wickeret al. 2008; Bayan et al. 2009) and electron microscopy (EM)(Franchi et al. 2007; Magnusson et al. 2002; Xia and Elder2001; Wolinsky and Glagov 1964) have been used to characterize collagen bundle orientation and/or crimp propertiesin soft tissue. Fewer studies have focused on quantifyingthe organization of collagen fibers within the arterial wall(Canham et al. 1991; Smith et al. 1981; Finlay et al. 1995;Canham et al. 1989; Dingemans et al. 2000). The studies onarteries have been mainly conducted on pressurized (loaded)and/or chemically fixed and embedded vessels. These procedures could modify structural organization of tissue components (Dobrin 1996). Structural models of the mechanicalresponse of the arterial wall are ideally based on the knowledge of the true zero-stress state (ZSS) of each wall constituent, preferably in wet fresh tissue where structural propertieshave not been changed. Krahn et al. have recently developeda new collagen specific fluorescence marker for tissues andlive cell cultures (Krahn et al. 2006) which enables high resolution 3D imaging of collagen fibers in wet fresh tissues(Boerboom et al. 2007).In this study, we have used the fluorescent marker developed by Krahn et al. combined with confocal microscopyand image analysis techniques to quantify the waviness andangular distribution of collagen fibers in the adventitia offresh arteries at their zero-stress state. More specifically, thisstudy was designed to (a) quantify the waviness properties ofcollagen fibers, (b) determine how the waviness distributionof fibers depends on their main orientation and (c) measurethe local angular distribution of collagen fibers in the adventitia of rabbit common carotid arteries.mon carotid arteries of rabbits because they exhibit littletapering and their properties are fairly uniform along theirlength. Arteries were transported on ice in phosphate buffered saline (PBS) to the laboratory and cleaned from thesurrounding tissue. To visualize collagen fiber, the arterieswere incubated over night at 37 in a 2 µ M solution ofCNA35-OG488 in PBS, which was used as the specific vitalflorescent marker for vascular collagen (Krahn et al. 2006).After incubation, the common carotid artery was cut into twoequal segments of approximately 25–30 mm in length. Onesegment was used to measure collagen waviness and orientation in the zero-stress state, which was achieved by cuttingopen carefully along the artery’s axis (cut-open group) andthen immersed in PBS for 30 min before imaging (Han andFung 1996). The other group was kept intact (intact group) atits zero-load state. All measurements were done within 24 hof excision.2.2 Confocal microscopyWe used an upright confocal microscope (Leica SP5 whitelaser, Leica, Germany) to visualize collagen fibers labeledwith the fluorescent marker CNA35-OG488. Arteries weresecured by a pin on a silicone coated Petri dish filled withPBS, with the adventitia facing upwards (Fig. 1). The thickness of the adventitia layer of rabbit carotid arteries is about0.13 mm. Two circumferential lines close to each border weremarked by a blue Miller’s elastic stain as shown in Fig. 1.The distance between these lines was measured before andafter fixing the tissue on the Petri dish to ensure that thearteries were not stretched. In addition, the field of view wasrotated in a way that the horizontal axis of images was parallel with the axial axis of the vessel. The fluorescent markerwas excited at 488 nm by an Argon laser and a photomultiplier tube (PMT) detector was defined at 498–550 nm tocollect the emitted fluorescent signal. Ten arterial segmentsper group were scanned at 5 different locations along thelongitudinal axis. At each location, a z-stack with a step sizeof 0.5 µ m was obtained, resulting in a total image size of238 µm 238 µm 100 µm, with 512 512 pixels ineach 2D image. In total, 50 z-stacks were imaged for eachgroup. Figure 1 shows an example of the image stack after 3Dreconstruction by IMARIS software (Bitplane, Switzerland).2.3 Image analysis2 Materials and methods2.3.1 3D measurement of fiber angle2.1 Tissue preparationThe orientation of collagen bundles in two representativez-stacks from each group was measured by manually locating endpoints of each collagen bundle using IMARIS Software. Figure 2 shows an example of the 3D reconstruction ofcollagen fibers from the z-stacks. Fibers have been manuallyFourteen common carotid arteries were excised postmortemfrom seven New Zealand white male rabbits weighing 3 0.1 kg from a local slaughterhouse. We selected to use com-123
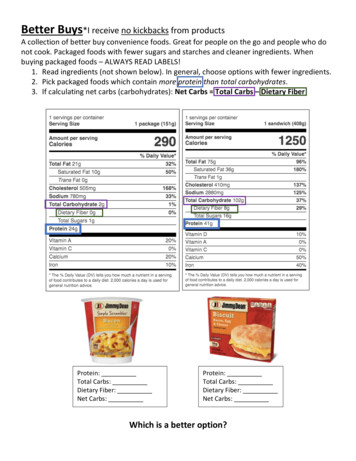
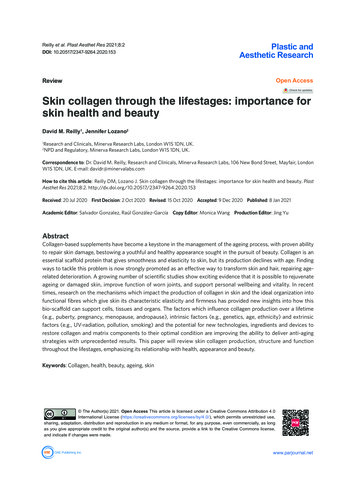
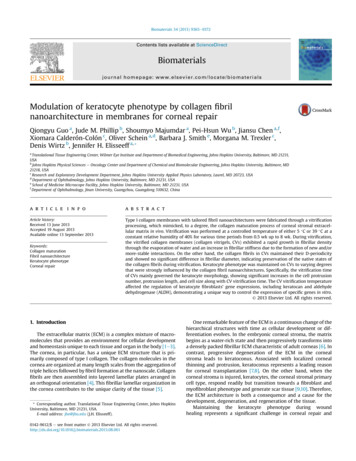
Experimental investigation of collagen waviness and orientationFig. 1 The arterial segment isplaced on a silicon-coated Petridish (not shown) with theadventitia facing upwards andan example of the 3Dreconstruction of outermostlayer of adventitia is presented.θ is the circumferential directionand z the axial directionμzμθzμrL0LfzδrzθFig. 2 Latitude (radial) angle ϕ measured by manual tracing of fibersin a representative 3D reconstruction of z-stacks. z, θ, r correspond tothe longitudinal, circumferential, and radial directionstraced and the global orientation of each fiber has been measured in a spherical coordinate system. The orientation of afiber in 3D could be therefore described by the azimuthalangle δ (between π/2 and π/2) and the latitude (radial)angle ϕ (between 0 and π ) as shown schematically in Fig. 2.2.3.2 2D image analysisBased on the assumption that the radial angle ϕ is smalland in order to facilitate the image analysis, the z-stacksFig. 3 Definition of measured parameters i.e., global angle (a), thickness (t), and length (L f ) of a fiber bundle as well as the length (L o ) ofa straight line connecting the ends of the measured fiber bundlewere flattened using the maximum intensity projection (MIP)available in ImageJ software (NIH, Bestheda, Maryland,USA).2.4 Measurement of waviness and global angle of collagenbundlesTo quantify the waviness characteristics and global angleof collagen bundles in the zero-stress state, all 2D imagesfrom the cut-open group were analyzed semi-automatically.Figure 3 shows the parameters measured for each collagenbundle on the image i.e., the distance between visible endpoints of a collagen bundle (L0 ), the length of the fiber bundle(L f ), the thickness (t) measured in three different locationsalong each bundle, and the global angle of bundles (a) which123
R. Rezakhaniha et al.is the angle between the main axis of the fiber and the axialdirection z as specified in Fig. 3. This angle could take valuesbetween 90 and 90 degrees. These parameters were measured using NeuronJ, an ImageJ plug-in originally developedfor Neurite tracing and analysis (Meijering et al. 2004). Theplug-in facilitates following the fibers on a 2D image andgives as the output the fiber length (L f ) as well as the coordinates of the endpoints. Most bundles are larger than thefield of view. Therefore, we emphasize that these parametersare measured for the part of the bundle visible in the field ofview.To quantify the waviness of fibers, we introduced thestraightness parameter (Ps ) defined as,Ps L 0 /L f(1)Ps is bounded between 0 and 1. The lower the value of Ps , thewavier the fiber is. A bundle with Ps 1 indicates a totallystraight fiber. Ps converges to zero when the fibers get verywavy. This parameter could be particularly useful for modeling the gradual engagement of wavy collagen fibers whichwill be discussed later. In addition, we estimated the size ofthe bundle by,S̃ L f · t (2)where t is the mean thickness of collagen bundles. Thus,each bundle could be characterized by three parameters, i.e.,a straightness parameter Ps , a global angle and an estimatedsize S̃. To give more importance to measurements from largerbundles which contain more collagen fibers than the smallerones, in the estimation of mean straightness parameter Psand the mean angle a, the individual bundle values of Ps anda were weighted by the size S̃ of the corresponding bundle.where α and β are shape parameters of the distribution andB(α, β) is the beta function, 1B(α, β) t α 1 (1 t)β 1 dt(4)0As for the extreme value distribution, it is defined as, Ps μPs μ 1f (Ps ; μ, σ ) σ expexp expσσ(5)where μ is the location parameter and σ 0 the scale parameter.Third, to decide whether Ps is distributed more accuratelyby a beta or an extreme value distribution, we have used probability plots of the data for both distributions using statisticstoolboxTM available in MATLAB. The probability plot is agraphical technique for assessing whether or not a datasetfollows closely a given distribution. The plot includes a reference line useful for judging whether the data follow wellor not the particular distribution. The closer the probability plot of data to this line, the better the data follow thatparticular distribution (Chambers et al. 1983). Finally, usingthe bivariate histogram, the weighted data were divided tosix groups based on their global angle a, starting from 90with 30 steps, and the probability density of the straightness parameter for each angle group was determined. Then,we fitted the beta distribution to all six groups of fibers andcompared the distribution parameters. This step helped us todecide whether the distribution of the straightness parameterPs depends on the global angle or not.2.6 Local angle analysis2.6.1 Image analysis tool2.5 Waviness distribution analysisTo quantify the waviness characteristics of collagen fibers,we analyzed the distribution of the straightness parameter.First, we used a bi-variate histogram to visualize the frequency of straightness parameter Ps and the global anglea, based on the weighted dataset. Second, the dataset wasused to plot a univariate probability density for the straightness parameter regardless of the global angle using MATLAB(The MathWorks, USA). This means that the probability density was extracted from all values of Ps in the dataset. A betaand an extreme value distribution were fitted to the Ps values. Beta probability distribution is a statistical distributiondefined between 0 and 1 as,P α 1 (1 Ps )β 1, 0 Ps 1f (Ps ; α, β) sB(α, β)123(3)To estimate the local orientation of the collagen fibers, weused OrientationJ, which is an ImageJ plug-in developed inhouse based on structure tensors. Structure tensors are matrixrepresentatives of partial derivatives and are commonly usedin the field of image processing (Jahne 1993; Bigun et al.2004). OrientationJ evaluates the local orientation and isotropic properties (coherency and energy) of every pixel ofthe image. These values are derived from the structure tensor defined for each pixel as the 2 2 symmetric positivematrix J, f x , f x w f x , f y w(6)J f x , f y w f y , f y wwhere f x and f y are the partial spatial derivatives of theimage f (x, y), along the principal directions x and y, respectively. Furthermore, the weighted inner product between two
Experimental investigation of collagen waviness and orientationarbitrary images g and h is defined as, w(x, y)g(x, y)h(x, y)dxdy g, h w (7)R2w(x, y) is the Gaussian weighting function that specifies thearea of interest. Once the structure tensor is known, local orientation, energy and coherency for each pixel could be easilycalculated (Jahne 1993). The local predominant orientationθ in the considered region corresponds to the direction of thelargest eigenvector of the tensor and it is thus given by, f x , f y w1(8)θ arctan 22 f y , f y w f x , f x wThe energy parameter E is the trace of the tensor matrix,E Trace(J ) f x , f x w f y , f y w(9)Pixels with higher energy values correspond to less isotropicand more clearly oriented structures.The coherency parameter C is defined as the ratio betweenthe difference and the sum of the tensor eigenvalues,C λmax λminλmax λmin f y , f y w f x , f x wenergy and coherency maps to select the image orientationvalues to be included in the angles histogram. The plug-inalso outputs a hue-saturation-brightness (HSB) color-codedmap which shows the angles of the oriented structures in theimage as shown in Fig. 4.2.6.2 Fitting local anglesUsing OrientationJ plug-in for ImageJ, we obtained the histogram of local angles for all individual images of collagenfibers. Next, we summed up the individual histograms fromimages in each group to calculate local orientation of bothcut-open and intact groups. The probability density function(PDF) of the local angles for each group was then calculated by normalizing local angular histograms. We fitted anempirical PDF by a four modal directional PDF representing4 families of fibers. The angular distribution of each family was modeled with a π -periodic von Mises distribution(Mardia and Jupp 2000) which is the π -periodic equivalentof a Gaussian distribution in directional statistics,ππ1eb cos(2(θ φ)) θ π I0 (b)22R(θ ; φ, b) 2 4 f x , f y w f x , f x w f y , f y w(10)where λmax is the largest and λmin the smallest eigenvalue,respectively. Coherency is bounded between 0 and 1, with 1indicating highly oriented structures and 0 indicating isotropic areas.In OrientationJ, the tensor J is evaluated for each pixel ofan input image by computing the continuous spatial derivatives in x and y using a cubic B-spline interpolation (Unseret al. 1993). The local orientation, coherency, and energy arecomputed based on Eqs. 8, 9 and 10. In our directional analysis, we included only the angular values from parts (pixels)of the images which effectively correspond to fiber edges, asthe orientation information from uniform areas is not significant. To do this, we used the energy of derivatives and thecoherency values to discriminate between significantly andnot-significantly oriented areas. Therefore, the histogram ofthe orientation is built with pixels which have at least 2% ofnormalized energy. Moreover, the orientation values in thehistograms are weighted by the coherency values to give moreimportance to the orientations which correspond to elongatedstructures in the local neighborhood.We made the OrientationJ plug-in and an ImageJ macrofor angle analysis batching available online at http://bigwww.epfl.ch/demo/orientation. OrientationJ computes the orientation, energy and coherency maps of an image and its weightedorientation histogram. It is possible to set thresholds on the(11)I0 denotes the modified Bessel function of the first kind andorder 0, which is defined as,1I0 (b) 2π 2πeb cos θ dθ(12)0The parameter ϕ is the mean orientation and the parameter bis the concentration parameter.The distribution is symmetric about θ ϕ and the circular standard deviation σ of this distribution is (Mardia andJupp 2000), σ 2 logI1 (b)I0 (β) 1/2(13)I1 denotes the modified Bessel function of the first kind andorder 1,1I1 (b) 2π 2πcos θ ebcos θdθ(14)0We assumed cylindrical symmetry around the z axis of arteries. Based on this assumption and the shape of the empiricalPDF, families of fibers to fit the data were assumed havingmean angles of ϕ1 , ϕ1 , π/2 and 0 with shape parameters123
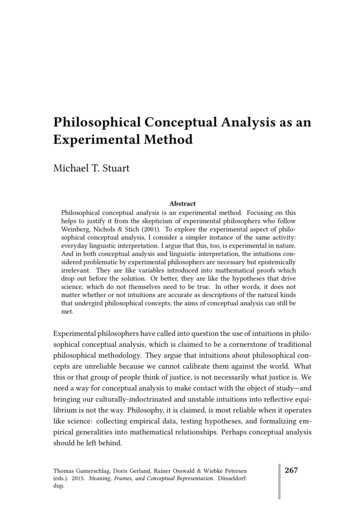
R. Rezakhaniha et al.Fig. 4 Results of the OrientationJ, the imageJ plug-in developed to get the histogram of local angles, the orientation, energy and coherency mapsof an image and the HSB color-coded mapb1 , b2 , b3 and b4 , respectively. Therefore the fitted probability density distribution was defined as,T R(θ ; ϕ 1 , b1 , b2 , b3 , b4 )11 R(θ ; ϕ 1 , b1 ) R(θ ; ϕ 1 , b2 )441ππ1π R(θ ; , b3 ) R(θ ; 0, b4 ) θ 42422λθ sin θ0θ(15)sin θ 0θ2.7 Transformation lawThe deformation of the arterial wall is assumed as an affinedeformation. Furthermore, in order to simplify the analysis, the collagen bundles are assumed to lie only in the circumferential–axial plane. Based on the above assumptions,one can obtain the density probability of local orientationsin the deformed state (intact) based on the zero-stress state(cut-open). As seen in Fig. 5, if λθ and λz are the stretchesin the circumferential and axial directions, respectively, andθ0 and θ1 are the local angles of fibers with respect to theaxial direction in the initial state (cut-open) and the deformedstate (intact), respectively; the angles are then related to eachother by,cosλ z cos θ 0Fig. 5 Mapping of local angles from the original state (θ0 ) to thedeformed state (θ1 ). The angles θ0 and θ1 are related to each otherwith Eq. 16. λθ and λz are the stretches in the circumferential and axialdirections, respectivelyR0 and R1 are density distributions for local angles between π /2 and π /2. Therefore, π/2tan θ1 λθtan θ0λz123(16)θ0 π/2R0 (θ0 )dθ0 π/2R1 (θ1 )dθ1 1 π/2(17)
Experimental investigation of collagen waviness and orientationThe function of θ1 versus θ0 is monotonic and the aboveequation results in,R0 (θ0 )dθ0 R1 (θ1 )dθ1 R0 (θ0 )(18)dθ0dθ1cos2 θ0λθλzλθλzcos2 tan 1(19)tan θ06weighted frequencyR1 (θ1 ) R0 (θ0 )5x 10420Therefore, if R0 is known, R1 could be calculated based onthe ratio of λθ /λz and the distribution R0 . The transformationlaw has been applied on the data to find out the correspondingratio of λθ /λz .1900.8600.6300.4waviness [ ]In this study, we have used manual, semi-automatic, and automatic techniques to quantify the statistical distribution ofparameters related to the orientation and waviness of fibersin the adventitia of rabbit carotid arteries.Figure 2 shows an example of the 3D reconstruction of collagen fibers from the z-stacks. The latitude (radial) angles,manually measured from the 3D reconstruction of samples,are listed in Table 1. The mean value of the absolute radialangle was measured as 5.6 and 6.1 in the cut group and4.8 and 1.7 in the uncut group. Based on these small anglevalues, the fibers were practically lying in the z-θ (axial–circumferential) plane in both groups. This trend was alsoobserved visually in all z-stacks.Figure 6 shows the weighted frequency of bivariate data,i.e., the set of global orientations and straightness from thecut group. The same dataset was used to create Figs. 7 and 9.Figure 7 shows the probability density of the straightnessparameter Ps regardless of the global angle of the data. ThisTable 1 Latitude (radial) angle measurements of 4 representative samplesGroupCutSampleS1ϕ (deg)0.2 600 90Angle [deg]Fig. 6 Bivariate histogram of straightness parameter (Ps ) and globalangles with respect to the axial direction of the artery based on the entireweighted datasetexperimental databeta distributionextreme value distribution2.5Proabability Density3 Results 3021.510.500.20.40.60.81PsFig. 7 Univariate probability density of straightness parameter (Ps )using all weighted data regardless of the global angle: empirical andcorresponding fits from beta and extreme value distributionsUncutS2S3S413.83.05.4 1.29.23.04.6 2.73.37.03.80.3 9.014.9 4.6 0.80.06.1 2.82.0 0.69.6 8.04.6 3.43.2 3.31.5 5.92.3 5.60.7Mean ( ϕ )5.66.14.81.7std ( ϕ )4.74.31.61.4means simply that Fig. 7 plots the density of all weightedstraightness parameters Ps . In addition, Fig. 7 includes thebest fits for beta and extreme value distributions on the experimental density distribution of the straightness. Parametervalues from best fits are reported in Table 2. The best fit forthe beta distribution resulted in α 4.47 and β 1.76and the best fit for the extreme value distribution resulted inμ 0.800 and σ 0.133. To assess how well the datasetfollowed each of these distributions, the probability plots ofthe data for both distributions were plotted in Fig. 8. Based onFig. 8, the data are closer to the straight line for the beta distribution than the extreme value distribution. This indicates123
R. Rezakhaniha et al.Table 2 Parameters of the distribution fits on straightnessparameter, PsDistributionExtreme values DistributionBetaLog likelihood23772480Log likelihoodDomain y Domain0 y eter estimateParameter y0.250.10.050.010.005experimental data0.0010.0005extreme value tal databeta 010.20.4DataFig. 8 Probability plot of beta and extreme value distributions versusthe experimental data. The experimental data seem to follow better thebeta distributionthat the experimental data follow better the beta distributionthan the extreme value distribution.Figure 9 shows probability densities of weighted straightness for groups of different global angle ranges and the corresponding fitted beta distribution. More precisely, Fig. 9ashows the probability density of the weighted straightnessparameter Ps for fibers with global angles between 89 and 60 , 59 and 30 , 29 and 0 , 1 and 30 , 31 and60 , and 61 and 90 . To compare the distribution for the123different angle ranges (Fig. 9a) and the one variable distribution (Fig. 7), all the fits have been plotted in Fig. 9b. The thickblack line shows the best fit from Fig. 7 (angle independentdensity distribution).Table 3 shows the parameters of the beta distribution fitson straightness parameter distributions for all global angledependant groups and the univariate set of the data (regardless of global angle). The shape parameters α and β, relatedto the univariate Ps distribution, were found to be α 4.7and β 1.8. The distributions pertaining to different anglegroups were similar in shape; the shape parameters were α 4.8 0.5 and β 1.8 0.2 and differed only slightly in α.The orientational density of local angles as well as thefitted PDF have been plotted in polar coordinates in Fig. 10for both cut-open and intact groups. For simplicity, the densities are plotted between π /2 and π /2. As it can be seen,the experimental data show a four modal distribution. Forthis reason, we have used a PDF composed of four π -periodic von Mises distributions, representing four families offibers. Figure 10a shows the local angle densities relatedto the cut-open group. Based on the fitted distribution, thefour modes occur at 0 (axial direction), 90 (circumferential direction), 43 and 43 with circular standard deviation(CSD) of 40 , 47 , 37 and 37 , respectively. Based on thesederived CSDs, the distribution appears less variable around43 and 43 than around 0 and 90 .Figure 10b shows the local angle distributions for theuncut group. Compared to Fig. 10a (cut group), the distribution is shifted to the circumferential direction. The families of fibers with mean orientations of 43 and 43 havebeen relocated to mean orientations of 47 and 47 , respectively. Furthermore, the value of probability density functionhas decreased in the axial direction (at 0 ) by 32% whileit has increased in the circumferential direction (at 90 ) by19%.Figure 11, shows the measured density distribution oflocal angles for both cut and uncut groups. Figure 11 alsoshows the predicted density distribution for the intact groupbased on the distribution of the cut-open group and applyingthe deformation with λθ /λz 1.24 using Eq. 19. This corresponds to the deformation needed to bring the cut-open groupgeometry to the intact (uncut) geometry. The results showedthat a transformation of the probability density distributionfor cut-open arteries using a deformation with equivalent circumferential to axial stretch ratios of λθ /λz 1.24, resultsin the same distribution as the uncut arteries.4 DiscussionWe quantified the waviness and angular distribution of collagen fibers in the adventitia of fresh rabbit common carotidarteries. Our results showed that the straightness of fibers
Experimental investigation of collagen waviness and orientationFig. 9 Distribution of straightness parameter in various ranges of global angles i.e., a beta distribution fitted (dashed line) to experimental data(bars) and b comparison of all fitted distributions for the different angle ranges (dashed lines) and the angle independent beta distribution (blackline)Table 3 Shape parameters of the fitted beta distributionsAngle rangeParameter estimationMean and varianceαβMeanVariance( 89 , 60 )5.52.10.7210.023( 59 , 30 )4.41.70.7010.031( 29 , 0 )4.21.90.6910.030(1 , 30 )4.91.80.7340.025(31 , 60 )4.41.60.7360.028(61 , 90 )5.22.00.7270.024Univariateset of data4.71.80.7180.028at the zero-stress state was best represented by a uni-modalbeta distribution function with shape parameters α and βequal to 4.5 and 1.8. These parameters determine the shapeof the distribution and indicate specifically the probabilitydensity of the straightness parameter. In addition, the waviness distribution of fibers did not depend on the global fiberangle. The beta distribution fitted the straightness densitiesfor all different groups of global angles, though the valuesfor shape parameters were slightly different in each group.Finally, the automatic analysis of local angle revealed theexistence of four main families of fibers. The distributionof angles was fitted by a four modal orientational distribution composed of four π -periodic von Mises distributions.Fig. 10 Orientational densityof local angles and fitted PDFfor cut-open (top) and intact(bottom) groups, in polarcoordinates. The four modeswith the corresponding CSD arepresented on the table123
R. Rezakhaniha et al.Fig. 11 Measured density distribution of local angles for both cut-open(dotted line) and intact (line) groups, and predicted density distributionof the intact
A. Griffa · D. Sage . (MIP) available in ImageJ software (NIH, Bestheda, Maryland, USA). 2.4 Measurement of waviness and global angle of collagen bundles To quantify the waviness characteristics and global angle of collagen bundles in the zero-stress state, all 2D images