Transcription
Resonance Raman spectroscopy of G-line and folded phonons in twisted bilayergraphene with large rotation anglesYanan Wang, Zhihua Su, Wei Wu, Shu Nie, Nan Xie, Huiqi Gong, Yang Guo, Joon Hwan Lee, Sirui Xing,Xiaoxiang Lu, Haiyan Wang, Xinghua Lu, Kevin McCarty, Shin-shem Pei, Francisco Robles-Hernandez, ViktorG. Hadjiev, and Jiming BaoCitation: Applied Physics Letters 103, 123101 (2013); doi: 10.1063/1.4821434View online: http://dx.doi.org/10.1063/1.4821434View Table of Contents: 03/12?ver pdfcovPublished by the AIP PublishingAdvertisement:This article is copyrighted as indicated in the abstract. Reuse of AIP content is subject to the terms at: http://scitation.aip.org/termsconditions. Downloaded to IP:129.7.134.4 On: Mon, 14 Oct 2013 19:55:45
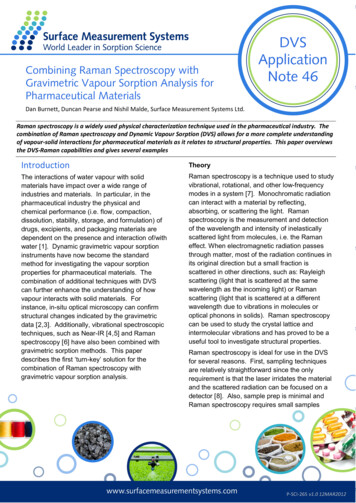
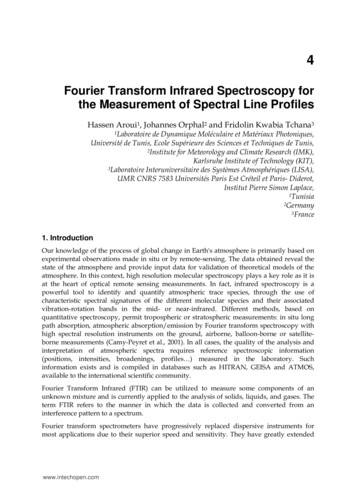
APPLIED PHYSICS LETTERS 103, 123101 (2013)Resonance Raman spectroscopy of G-line and folded phonons in twistedbilayer graphene with large rotation anglesYanan Wang,1 Zhihua Su,1 Wei Wu,1,2 Shu Nie,3 Nan Xie,4 Huiqi Gong,4 Yang Guo,4Joon Hwan Lee,5 Sirui Xing,1,2 Xiaoxiang Lu,1 Haiyan Wang,5 Xinghua Lu,4 Kevin McCarty,3Shin-shem Pei,1,2 Francisco Robles-Hernandez,6 Viktor G. Hadjiev,7 and Jiming Bao1,a)1Department of Electrical and Computer Engineering University of Houston, Houston, Texas 77204, USACenter for Advanced Materials, University of Houston, Houston, Texas 77204, USA3Sandia National Laboratories, Livermore, California 94550, USA4Institute of Physics, Chinese Academy of Sciences, Beijing 100190, China5Department of Electrical and Computer Engineering, Texas A&M University, College Station, Texas 77843,USA6College of Engineering Technology, University of Houston, Houston, Texas 77204, USA7Texas Center for Superconductivity and Department of Mechanical Engineering, University of Houston,Houston, Texas 77204, USA2(Received 24 July 2013; accepted 26 August 2013; published online 16 September 2013)We report the synthesis and systematic Raman study of twisted bilayer graphene (tBLG) withrotation angles from below 10 to nearly 30 . Chemical vapor deposition was used to growhexagon-shaped tBLG with a rotation angle that can be conveniently determined by relative edgemisalignment. Rotation dependent G-line resonances and folded phonons were observed byselecting suitable energies of excitation lasers. The observed phonon frequencies of the tBLGC 2013 AIP Publishing LLC.superlattices agree well with our ab initio calculation. V[http://dx.doi.org/10.1063/1.4821434]Twisted bilayer graphene (tBLG) has attracted considerable attention recently because of the tunability of interlayercoupling and band structure resulting from the freedom ofrelative rotation.1–15 The unique properties of tBLG havebeen revealed by Raman spectroscopy,10–15 and they providean enormous opportunity for device applications. However,tBLG samples used in these reported experimental studiesare not well suitable for device applications.5–7,10–13,15 Oneproblem is that rotation angles of tBLG cannot be conveniently determined. Sophisticated techniques such as transmission electron microscopy (TEM), scanning tunnelingmicroscopy (STM), and atomic force microscopy (AFM)were often used. Another problem is that bilayer regions ofinterest are not well isolated from the rest of graphene.Because of the lack of suitable tBLG samples, especiallywith rotation angles greater than 16 , a well-characterized Gline resonances is still missing, and a one-to-one relationshipbetween G-line resonance, folded phonon frequency, androtation angle has not been established.6,10–13,15Twisted bilayer graphene was grown on Cu foils bychemical vapor deposition (CVD) at ambient pressure in aquartz tube furnace.16 The conditions are similar to what weused for single-layer graphene,17,18 except that a larger flowrate of CH4 was used to facilitate the growth of bilayer graphene.19 Figures 1(a)–1(d) show examples of bilayer graphene islands that consist of two graphene hexagons stackedon each other. It can be seen that two layers can have relativerotation angles from 0 to nearly 30 . The lattice rotation isconfirmed by investigations of TEM and STM.19 The effectof lattice rotation on the electronic band structure is alsorevealed by the STM observation of Van Hove singularities.19,20 An important advantage of such bilayer /4/ 30.00structures compared to those previously reported is that therelative edge misorientation of two hexagons represents theiractual lattice rotation. This conclusion is obtained by comparing low-energy electron diffraction (LEED) with low-energyelectron microscopy (LEEM) from the same region of graphene.16 The relationship between edge misorientation andlattice rotation has facilitated the identification of tBLG,where rotation angles in this work are all based on the averageedge misorientations. Similar stacked graphene hexagonswere reported before, but their lattice rotation was not verifiedFIG. 1. Scanning electron microscopy (SEM) pictures of representativetBLG hexagons with various rotation angles. Scale bars: 5 lm.103, 123101-1C 2013 AIP Publishing LLCVThis article is copyrighted as indicated in the abstract. Reuse of AIP content is subject to the terms at: http://scitation.aip.org/termsconditions. Downloaded to IP:129.7.134.4 On: Mon, 14 Oct 2013 19:55:45
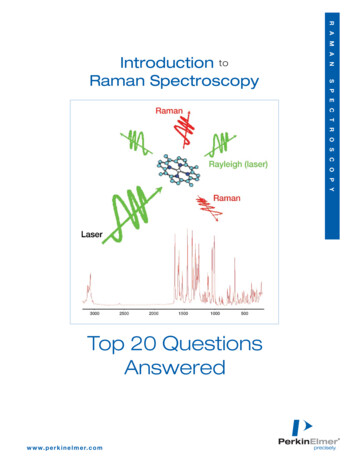
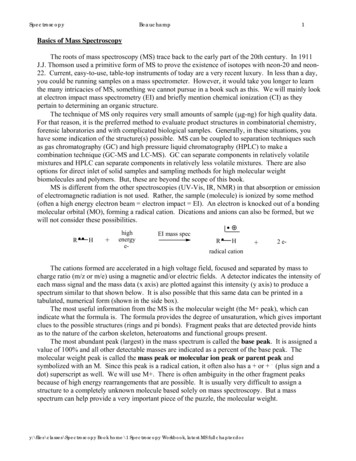
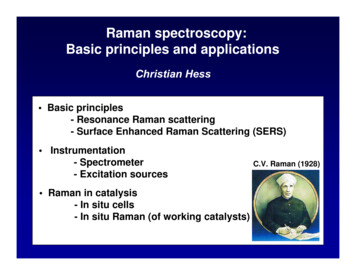
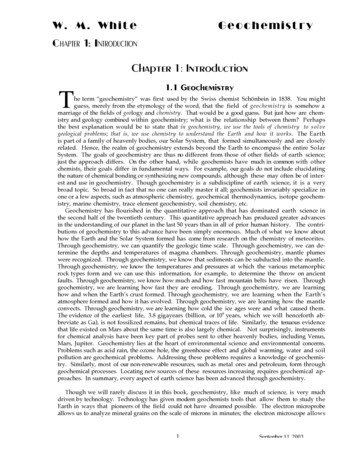
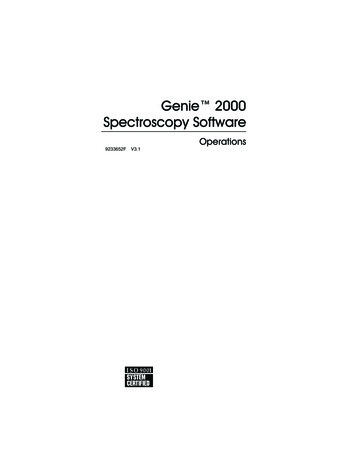
123101-2Wang et al.Appl. Phys. Lett. 103, 123101 (2013)FIG. 2. Raman spectra of G-line andfolded TO phonons under differentlaser excitation energies in two tBLGwith rotation angles of 9 (a) and 16 (b). The spectra are normalized relativeto the G-line of single-layer graphene.with direct lattice imaging techniques such as TEM, STM, orLEED.21Resonance Raman scatterings of G-line and folded phonon can be conveniently observed in tBLG samples with rotation angles around 12 because the resonance excitationenergy falls in the range of our five visible laser lines from638 nm to 458 nm. Figure 2 shows representative Ramanspectra of two tBLG with 9 and 16 rotation angles. As canbe seen, the intensities of folded phonons follow the same dependence on laser excitation wavelength as G-line. For the 9 tBLG, the G-line resonance was only observed with the 638nm laser. The resonance was centered around 458-nm for 16 tBLG, and it disappeared when the laser was switched to either 638-nm or 364-nm. The dependence of folded phononfrequency on the rotation angle can also be clearly seen: Thefrequency decreases when the rotation angle increases.According to previous calculations, G-line resonanceshould be observed even for tBLG with a large rotation angleif the excitation energy is tuned high enough.10,13 This prediction is verified when a 364-nm UV laser was used. Figure3 shows a more than 30 times enhancement in G-line intensity when a tBLG 25.6 sample was excited by the UV line.It should be noted that UV lasers were used in the observation of phonons in twisted bilayer graphene,15,22 but a directG-line enhancement compared to that of single layer graphene was not reported, and the rotation angle was not provided. But where is the folded phonon? We show that theFIG. 3. 364-nm UV Raman spectra from single-layer (1L) and bilayer (2L)regions of a 25.6 tBLG. Inset: SEM image.strong Raman peak near D-line position is actually the foldedphonon.This assignment of the folded phonon is based on thefollowing observations. First, the position of this peak is dependent on the rotation angle of tBLG. Figures 4(a)–4(c)show a series of UV Raman spectra in six different samplesincluding the 16 tBLG. It can be seen that the peak positions of 2D-band remain almost the same, but a large shift inthe positions of Raman peaks near the D-line is observed.According to the relationship between D-line and 2D-band,the Raman shift of the D-line is simply half the Raman shiftof the 2D-band. Thus, the strong Raman near D-line cannotbe the usual D-line as observed by visible laser lines.Second, as before, such strong Raman peaks near D-line areonly observed when there is G-line resonance. This is supported by all six samples shown in Figs. 3(a)–3(c). Becausethe 16 sample exhibits no G-line enhancement, there is noobservable peak near the usual D-line. The other five samples show different degrees of G enhancement from 5 to 20times. Unlike Raman with visible laser lines, the UV RamanD-line is very weak: the relatively strong D-line in singlelayer graphene shown in Fig. 3 is due to the defects createdby UV exposure during the Raman.23 The dependence ofobserved phonon frequencies on the rotation angle is summarized in Fig. 4(d). A general trend can be observed: Alarger rotation angle leads to a lower phonon frequency.Folded phonons are frequently observed in 1-D superlattices.24,25 The frequency of folded phonons can be estimatedby zone folding of the initial phonon dispersion curve into thereduced Brillouin zone (rBZ) of the superlattices. Conversely,the character of folded phonon is an important measure of thequality of superlattice structure.24 Figure 4(a) shows BZ ofsingle-layer graphene and rBZ of the bilayer superlattice witha rotation angle of 13.2 . Also shown are two sets of six-foldreciprocal lattices A and B of the superlattice. It is the position of these reciprocal lattices that determine the frequencyof folded phonons. This can be understood in the followingtwo ways using reciprocal lattice A as an example. Whentransverse optical (TO) dispersion in the larger BZ of singlelayer graphene (SLG) is mapped into the reduced BZ of thesuperlattice, point A will be mapped to the U-point of the BZ,and becomes U-point optical phonons that can be probed byRaman scattering. Based on the six-fold symmetry, phononsat six reciprocal lattices equivalent to lattice A will have thesame frequency. Its frequency can be calculated directly forthe specific point A in the SLG BZ.9,11,19 For this purpose, weThis article is copyrighted as indicated in the abstract. Reuse of AIP content is subject to the terms at: http://scitation.aip.org/termsconditions. Downloaded to IP:129.7.134.4 On: Mon, 14 Oct 2013 19:55:45
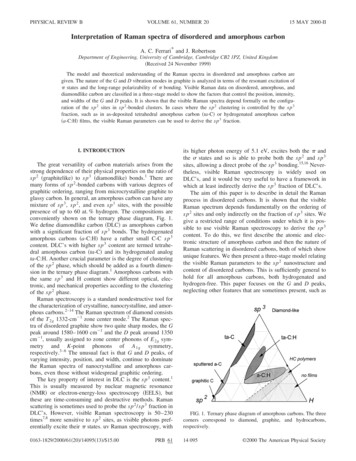
123101-3Wang et al.Appl. Phys. Lett. 103, 123101 (2013)FIG. 4. (a)–(c): 364-nm UV Ramanspectra of the 16 (black) tBLG andfive other tBLGs with rotation anglesgreater than 21 degrees. (a): Ramanspectra indicating G-line resonancewith an enhancement of 5 to 20 timesfor large-angle tBLGs. There is no Gline resonance for the 16-degree tBLG.(b): Close-up view of (a) near 2Dband. (c): Close-up view of (a) near1400 cm 1. (d): Observed phonon frequency as a function of rotation angle.note that the rBZ in Figure 5(a) nearly coincides with that ofthe Moir e reciprocal lattice of tBLG at the same angle. TheMoir e lattice BZ vector qðhÞ ¼ p8pffiffi3a sinðh2Þ then is equal to U-Amomentum.11,14 Figure 5(b) compares the experimentalfolded phonon frequencies (open circles) with those calculated19 for point A in SLG BZ (red curve) at angles h between0 and 30 . Both sets of frequencies are plotted against theMoir e vector q(h). The experimental frequencies followclosely the calculated frequency dependence, which suggeststhat the Moir e lattice is a good approximation to the tBLGsuperlattice realized in our samples.According to the zone folding shown in Fig. 5(a), twodifferent phonon modes are expected from reciprocal latticesA and B, but a lower-frequency phonon at B has not beenobserved. This is the case for all of the samples we havemeasured. We believe the following reasons explain whyonly the phonon with the highest frequency is observed. Letus take the 13.2 tBLG as an example. First, the crystal momentum C-A is the fundamental reciprocal lattice vector ofthe superlattice, while C-B represents a higher-order crystalmomentum. Raman scattering is typically much stronger forprocesses involving the fundamental mode than the higherorder modes. Second, the phonon C-A is closer in energy tothe G-line compared with the folded phonon C-B. The C-Aphonon is thus more likely to be resonantly excited when theresonance condition for the G-line is satisfied.9,11It was speculated by the continuum model that the interlayer coupling becomes negligible for a tBLG with a largerotation angle.1 But our observations indicate that this is notthe case: A G-line resonance and a relatively strong foldedphonon are observed for large-angle twisted graphene. Thisobservation agrees with the calculation based on a graphenesuperlattice, and it is a result of a smaller size of unit cell ofthe superlattice for larger rotation angles.8 The fact that bothG-line resonance and folded phonons are observed for anyFIG. 5. Estimation of folded phonon frequency from transverse optical (TO)dispersion of single-layer graphene. (a) rBZ and reciprocal lattices of 13.2degree twisted bilayer graphene in the BZ of single-layer graphene. The phononmarked by A can be excited by Raman with the exchange of crystal momentumC-A. (b) Calculated zone-folded phonon frequencies of TO and longitudinalmode (LO) as a function of reciprocal wave vector of bilayer superlattice orMoir e pattern. Circles are the observed folded TO phonons from Fig. 4(d).This article is copyrighted as indicated in the abstract. Reuse of AIP content is subject to the terms at: http://scitation.aip.org/termsconditions. Downloaded to IP:129.7.134.4 On: Mon, 14 Oct 2013 19:55:45
123101-4Wang et al.studied bilayer graphene islands implies that tBLG synthesized by CVD are effective superlattices with a relativelystrong interlayer coupling.In conclusion, we synthesized isolated bilayer graphenehexagons and identified their superlattice structures usingTEM, STM, and Raman scattering. We obtained G-lineresonances and folded phonon spectra of tBLG with a widerange of rotation angles. Such Raman characterization provides a solid basis for further understanding and exploringrich physics and other unique properties of bilayer graphene.Single-layer graphene, a one-atom-thick two-dimensionallattice, thus provides us a different building block to engineer two-dimensional structures with tunable properties.The work at Sandia National Laboratories was supportedby the Office of Basic Energy Sciences, Division of MaterialsSciences and Engineering of the U.S. DOE under ContractNo. DE-AC04-94AL85000. S.-S.P., J.M.B., W.W., andS.R.X. acknowledge support from the Delta ElectronicsFoundation and UH CAM. J.M.B. acknowledges supportfrom the National Science Foundation (Career Award ECCS1240510 monitored by Anupama Kaul, DMR-0907336 monitored by Charles Ying) and the Robert A Welch Foundation(E-1728). V.G.H. work was supported by the State of Texasthrough the Texas Center for Superconductivity at theUniversity of Houston. X.L. and Y.G. acknowledge supportfrom Natural Science Foundation of China under Grant No.11174347, and National Basic Research Program of Chinaunder Grant No. 2012CB933002.1J. M. B. Lopes dos Santos, N. M. R. Peres, and A. H. Castro Neto, Phys.Rev. Lett. 99, 256802 (2007).2S. Latil, V. Meunier, and L. Henrard, Phys. Rev. B 76, 201402 (2007).3A. H. MacDonald and R. Bistritzer, Nature 474, 453 (2011).4E. J. Mele, Phys. Rev. B 81, 161405 (2010).5A. Luican, G. H. Li, A. Reina, J. Kong, R. R. Nair, K. S. Novoselov, A. K.Geim, and E. Y. Andrei, Phys. Rev. Lett. 106, 126802 (2011).Appl. Phys. Lett. 103, 123101 (2013)6K. Sato, R. Saito, C. X. Cong, T. Yu, and M. S. Dresselhaus, Phys. Rev. B86, 125414 (2012).J. Hicks, M. Sprinkle, K. Shepperd, F. Wang, A. Tejeda, A. TalebIbrahimi, F. Bertran, P. Le Fevre, W. A. de Heer, C. Berger, and E. H.Conrad, Phys. Rev. B 83, 205403 (2011).8S. Shallcross, S. Sharma, E. Kandelaki, and O. A. Pankratov, Phys. Rev. B81, 165105 (2010).9A. Cocemasov, D. Nika, and A. Balandin, Phys. Rev. B 88, 035428 (2013).10K. Kim, S. Coh, L. Z. Tan, W. Regan, J. M. Yuk, E. Chatterjee, M. F.Crommie, M. L. Cohen, S. G. Louie, and A. Zettl, Phys. Rev. Lett. 108,246103 (2012).11J. Campos-Delgado, L. Cançado, C. Achete, A. Jorio, and J. Raskin, NanoRes. 6, 269 (2013).12Z. H. Ni, L. Liu, Y. Y. Wang, Z. Zheng, L. J. Li, T. Yu, and Z. X. Shen,Phys. Rev. B 80, 125404 (2009).13R. W. Havener, H. L. Zhuang, L. Brown, R. G. Hennig, and J. Park, NanoLett. 12, 3162 (2012).14V. Carozo, C. M. Almeida, E. H. M. Ferreira, L. G. Cancado, C. A.Achete, and A. Jorio, Nano Lett. 11, 4527 (2011).15A. Righi, S. D. Costa, H. Chacham, C. Fantini, P. Venezuela, C.Magnuson, L. Colombo, W. S. Bacsa, R. S. Ruoff, and M. A. Pimenta,Phys. Rev. B 84, 241409 (2011).16S. Nie, W. Wu, S. R. Xing, Q. K. Yu, J. M. Bao, S. S. Pei, and K. F.McCarty, New J. Phys. 14, 093028 (2012).17Q. K. Yu, L. A. Jauregui, W. Wu, R. Colby, J. F. Tian, Z. H. Su, H. L. Cao,Z. H. Liu, D. Pandey, D. G. Wei, T. F. Chung, P. Peng, N. P. Guisinger, E.A. Stach, J. M. Bao, S. S. Pei, and Y. P. Chen, Nature Mater. 10, 443 (2011).18W. Wu, Z. H. Liu, L. A. Jauregui, Q. K. Yu, R. Pillai, H. L. Cao, J. M.Bao, Y. P. Chen, and S. S. Pei, Sens. Actuators B 150, 296 (2010).19See supplementary material at http://dx.doi.org/10.1063/1.4821434 forgraphene growth parameters, TEM, STM lattice Moir e patterns and phonon calculation.20G. H. Li, A. Luican, J. M. B. L. dos Santos, A. H. C. Neto, A. Reina, J.Kong, and E. Y. Andrei, Nat. Phys. 6, 109 (2010).21I. Vlassiouk, M. Regmi, P. F. Fulvio, S. Dai, P. Datskos, G. Eres, and S.Smirnov, ACS Nano 5, 6069 (2011).22A. K. Gupta, Y. J. Tang, V. H. Crespi, and P. C. Eklund, Phys. Rev. B 82,241406 (2010).23I. Calizo, I. Bejenari, M. Rahman, G. Liu, and A. A. Balandin, J. Appl.Phys. 106, 043509 (2009).24B. Jusserand and M. Cardona, in Light Scattering in Solids V, Topics inApplied Physics, edited by Gernot Guntherodt Manuel Cardona (Springer,Berlin, 1989), Vol. 66.25J. M. Bao, A. V. Bragas, J. K. Furdyna, and R. Merlin, Phys. Rev. B 71,045314 (2005).7This article is copyrighted as indicated in the abstract. Reuse of AIP content is subject to the terms at: http://scitation.aip.org/termsconditions. Downloaded to IP:129.7.134.4 On: Mon, 14 Oct 2013 19:55:45
pendence on laser excitation wavelength as G-line. For the 9 tBLG, the G-line resonance was only observed with the 638-nm laser. The resonance was centered around 458-nm for 16 tBLG, and it disappeared when the laser was switched to ei-ther 638-nm or 364-nm. The dependence of folded phonon frequency on the rotation angle can also be clearly .