Transcription
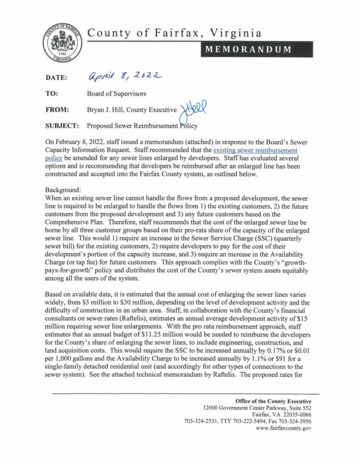
County of Fairfax, Virginia,, e,MEMORANDUM202Z.-DATE:afiTO:Board of SupervisorsFROM:Bryan J. Hill, County ExecutiveSUBJECT:Proposed Sewer ReimbursementlicyOn February 8, 2022, staff issued a memorandum (attached) in response to the Board's SewerCapacity Information Request. Staff recommended that the existing sewer reimbursementpolicy be amended for any sewer lines enlarged by developers. Staff has evaluated severaloptions and is recommending that developers be reimbursed after an enlarged line has beenconstructed and accepted into the Fairfax County system, as outlined below.Background:When an existing sewer line cannot handle the flows from a proposed development, the sewerline is required to be enlarged to handle the flows from 1) the existing customers, 2) the futurecustomers from the proposed development and 3) any future customers based on theComprehensive Plan. Therefore, staff recommends that the cost of the enlarged sewer line beborne by all three customer groups based on their pro-rata share of the capacity of the enlargedsewer line. This would 1) require an increase in the Sewer Service Charge (SSC) (quarterlysewer bill) for the existing customers, 2) require developers to pay for the cost of theirdevelopment's portion of the capacity increase, and 3) require an increase in the AvailabilityCharge (or tap fee) for future customers. This approach complies with the County's "growthpays-for-growth" policy and distributes the cost of the County's sewer system assets equitablyamong all the users of the system.Based on available data, it is estimated that the annual cost of enlarging the sewer lines varieswidely, from 3 million to 30 million, depending on the level of development activity and thedifficulty of construction in an urban area. Staff, in collaboration with the County's financialconsultants on sewer rates (Raftelis), estimates an annual average development activity of 15million requiring sewer line enlargements. With the pro rata reimbursement approach, staffestimates that an annual budget of 11.25 million would be needed to reimburse the developersfor the County's share of enlarging the sewer lines, to include engineering, construction, andland acquisition costs. This would require the SSC to be increased annually by 0.17% or 0.01per 1,000 gallons and the Availability Charge to be increased annually by 1.1% or 91 for asingle-family detached residential unit (and accordingly for other types of connections to thesewer system). See the attached technical memorandum by Raftelis. The proposed rates forOffice of the County Executive12000 Government Center Parkway, Suite 552Fairfax, VA 22035-0066703-324-2531, TTY 703-222-5494, Fax 703-324-3956www.fairfaxcounty.gov
Board of SupervisorsProposed Sewer Reimbursement PolicyPage 2 of 3FY 2023 through FY 2027 for Single-Family Dwellings (SFDs), and townhouses andapartments would be as follows:Type of ConnectionSFD, FY23 AdvertisedBudget ChargeSFD Proposed Charge*Increase Over PreviousYear Proposed ChargeIncrease Over FY 23Advertised BudgetChargeTownhouse andApartment, FY23Advertised BudgetTownhouse andApartment ProposedCharge*AVAILABILITY CHARGE SCHEDULECurrentRateNew RateFY 2022FY 2023 FY 2024FY 2025FY 2026 8,507 8,592 8,678 8,765 8,853FY 2027 8,942N/A 8,683 8,860 9,038 9,217 9,397N/AN/A 91 91 91 91N/A 91 182 273 364 455 6,806 6,874 6,942 7,012 7,082 7,153N/A 6,947 7,088 7,231 7,374 7,518Increase Over PreviousYear Proposed ChargeN/AN/A 73 73 73 73Increase Over FY23Advertised BudgetChargeN/A 73 146 219 292 365*Proposed rates are evaluated annually, and adjustments are recommended to the Board ofSupervisors for their consideration as part of the budget process.SEWER SERVICE CHARGE SCHEDULEPer 1,000 gallons of water consumptionCurrentRateSewer Service ChargeFY23 AdvertisedBudgetProposed Sewer**Service ChargeIncrease OverPrevious YearProposed ChargeIncrease Over FY23Advertised BudgetNew RateFY 2022FY 2023 7.72FY 2025FY 2026FY 2027 8.09FY2024 8.41 8.73 9.21 9.67N/A 8.10 8.44 8.77 9.27 9.75N/AN/A 0.34 0.33 0.50 0.48N/A 0.01 0.03 0.04 0.06 0.08**Proposed rates are evaluated annually, and adjustments are recommended to the Board ofSupervisors for their consideration as part of the budget process
Board of SupervisorsProposed Sewer Reimbursement PolicyPage 3 of 3Staff anticipates the actual reimbursement program cost to fluctuate annually, based on thelevel of development activity. The budget for reimbursement and its impact on the rates wouldbe evaluated annually and adjustments would be recommended for the Board's consideration.With the Board's concurrence of the recommendations, staff will revise the County's sewerservice policy reflecting the recommended reimbursement and the proposed sewer rates for theBoard's adoption after holding a public hearing.Attachments:1. Technical Memorandum — Conveyance Infrastructure and Developer Oversizing PolicyAnalysis — by Raftelis, dated March 8, 20222. Staff memorandum on Sewer Capacity Information Request dated, February 8, 20223. Attachments to staff memorandum of February 8, 2022cc:Rachel Flynn, Deputy County ExecutiveChristopher Herrington, Director, Department of Public Works and EnvironmentalServices (DPWES)Eleanor Ku Codding, Deputy Director, DPWES, Stormwater and Wastewater DivisionsShahram Mohsenin, Director, DPWES, Wastewater Planning and Monitoring DivisionBarbara Byron, Director, Department of Planning and DevelopmentWilliam D. Hicks, Director, Land Development ServicesElizabeth Teare, County AttorneyChristina Jackson, Chief Financial Officer
RAFTELISTECHNIC!! ,h!FPv,0 0To: Shahram Mohsenin, P.E, Director, Wastewater Planning & Monitoring Division;Anand Goutam, CPA, Financial Manager, DPWES, Stormwater and WastewaterFrom: Raftelis Financial Consultants, Inc.Date: March 8, 2022Re: Conveyance Infrastructure and Developer Oversizing Policy AnalysisBackground:The Fairfax County (County) Wastewater Planning & Monitoring Division (Division) has observedsignificant growth in redevelopment of the County at higher density in recent years. The CountyBoard of Supervisors (Board) has approved changes to the comprehensive plan to allow forfurther growth and redevelopment. In some instances, as developers have sought zoningchanges, the County has required oversizing wastewater collection and conveyanceinfrastructure (C&C Infrastructure) to serve higher population densities in accordance with thecomprehensive plan. The County's current sewer service policy requires that the developer mustfund the entire cost of the C&C Infrastructure, including the cost of oversizing. The County doesoffer developers the option of entering into a 20-year agreement to reimburse a portion of the costof the C&C infrastructure funded by the developer as other development connect to theinfrastructure (Reimbursement Policy). The Division reports that in the last 20 years developershave not elected to take advantage of the Reimbursement Policy for various reasons. As a result,the Division is considering proposing revisions to the current Reimbursement Policy forconsideration by the Board of Supervisors. Raftelis was engaged by the Division to assist inanalyzing several policy options currently under consideration (Policy Options) as follows:Option 1County reimburses the developer for the entire cost of the wastewater line that needsto be enlarged.Option 2County reimburses the developer only for the portion of the cost associated withoversizing to meet requirements of the comprehensive plan.Option 3County reimburses the Developer for the entire cost of the wastewater line that needsto be enlarged with exception to the capacity required by the developer for theirproject.The objective of the analysis is to estimate the program costs and identify user fee and availabilityfee rate recommendations to offset the additional costs to the County should the Board elect tochange the Reimbursement Policy for the listed options. These options will result in the developer341 N. Maitland Avenue, Suite 300, Maitland, FL 32751www.rafteljs.com
TECHNICAL MEMO: OVERSIZING POLICY ANALYSIScovering varying amounts of the cost of oversizing under the County's growth-pays-for-growthpolicy.Key Assumptions:1) Assessing programmatic costs:a. Division staff provided Raftelis with a three (3) year history of developer contributedassets by linear foot of installed lines delineated as either expansion or oversize;b.Raftelis applied estimates for line replacement based on unit costs per linear footderived from industry and Division estimates;c.Based on this the potential programmatic costs to the County were estimated torange from 3 million to 30 million annually depending on the variance in unitcosts and the policy option; andd.For purposes of this analysis the program costs assumed as C&C infrastructurecosts under evaluation included 5 million, 15 million, 30 million, and 50 millionannually.2) Estimating the County's programmatic costs for each option:a. The Division provided Raftelis with the fixed wastewater conveyance asset recordsof the system and a listing of all C&C infrastructure by pipe diameter and linearfeet in service;b.Although each development is unique, based on the provided information it wasassumed that the developer's project needs would represent 25% of the C&Cinfrastructure capacity, the comprehensive plan level oversize cost wouldrepresent 50% of the C&C infrastructure cost, and the remaining 25% of the costwould be for handling the flows form the existing customers;c.Based on the aforementioned data and assumptions, the following methodologyfor determining the programmatic cost responsibilities of the County were assumedfor each option shown below ( 5 million program shown as illustration):i. Option 1: 100% County Responsibility x 5 million 5.0 million annuallyii. Option 2: 50% County Responsibility x 5 million 2.5 million annuallyiii. Option 3: 75% County Responsibility x 5 million 3.75 million annually3) Assessing availability fee and user fee impacts from the Policy Options analysis:a. The proposed Policy Options would directly result in varying annual increases tothe County's capital improvement plan funding requirements;b. The Policy options were assumed to be funded from the issuance of additionaldebt since the projects benefit future customers;c. Effects to user and availability fees:
TECHNICAL MEMO: OVERSIZING POLICY ANALYSISi. Increases to the CIP would result in an increase to the County's availabilityfee calculations; andii. Increases in debt service to fund programmatic costs not covered byincreases in availability fees would be funded by user fees.Availability and User Impacts for 5M Enlarged Sewer Line Program:The following table presents a summary of the findings of the evaluation and impacts to user feesand availability fees over the current ten (10) year forecast period:C&C Conveyance CostsCounty ResponsibilityAnnual ProgrammaticCostsYear 1Year 2Year 3Year 4Year 5Year 6Year 7Year 8Year 9Year 10Cumulative IncreasesQuarterly Residential BillImpact at 16,000 GallonsMonthly Bill ImpactOption 1Option 2Option 3 5,000,000100% 5,000,000 5,000,00050% 2,500,000 5,000,00075% 3,750,000AvailabilityFeeIncrease 40.50 40.50 40.50 40.50 40.50 40.50 40.50 40.50 40.50 0.07%0.07%0.07%0.07%AvailabilityFeeIncrease 20.25 20.25 20.25 20.25 20.25 20.25 20.25 20.25 20.25 0.04%0.04%0.04%0.04%AvailabilityFeeIncrease 30.38 30.38 30.38 30.38 30.38 30.38 30.38 30.38 30.38 0.06%0.06%0.06%0.06% 405.000.7% 202.500.4% 303.750.6% 1.25 0.63 0.94 0.42 0.21 0.31Based on the prior table Raftelis analyzed the cumulative cash flow effects of the increase in debtservice and corresponding user and availability fee increases for each option over the ten (10)year forecast period. A summary of the cashflow projections is presented below:Debt Svc Payments'Availability Fee2User Fee Increase10 Year Cashflow EffectsOption 1Option 2( 8,110,671)( 16,221,343) 6,682,500 3,341,250 9,538,843 4,769,421Option 3( 12,166,007) 5,011,875 7,154,1321 Debt service payments assume 30-year financing, 2% issue costs, and 4% interest rate.2 Availability fees assume 3,000 ERCs of new connections per year.
TECHNICAL MEMO OVERSIZING POLICY ANALYSISAvailability and User Impacts for 15M Enlarged Sewer Line Program:The following table presents a summary of the findings of the evaluation and impacts to user feesand availability fees over the current ten (10) year forecast period:C&C Conveyance CostsCounty ResponsibilityAnnual earYear12345678910Cumulative IncreasesQuarterly Residential BillImpact at 16,000 GallonsMonthly Bill ImpactOption 1Option 2Option 3 15,000,000100% 15,000,000 15,000,00050% 7,500,000 15,000,00075% 11,250,000AvailabilityFeeIncrease 121.50 121.50 121.50 121.50 121.50 121.50 121.50 121.50 121.50 %0.22%0.22%0.22%0.22%AvailabilityFeeIncrease 60.75 60.75 60.75 60.75 60.75 60.75 60.75 60.75 60.75 0.11%0.11%0.11%0.11%AvailabilityFeeIncrease 91.13 91.13 91.13 91.13 91.13 91.13 91.13 91.13 91.13 0.17%0.17%0.17%0.17% 1,215.002.2% 607.501.10/0 911.251.7% 3.76 1.88 2.82 1.25 0.63 0.94Based on the prior table Raftelis analyzed the cumulative cash flow effects of the increase in debtservice and corresponding user and availability fee increases for each option over the ten (10)year forecast period. A summary of the cashflow projections are presented below:Debt Svc Payments'Availability Fee2User Fee Increase10 Year Cashflow EffectsOption 1Option 2( 24,332,014)( 48,664,028) 20,047,500 10,023,750 28,616,528 14,308,264Option 3( 36,498,021) 15,035,625 21,462,3961 Debt service payments assume 30-year financing, 2% issue costs, and 4% interest rate.2 Availability fees assume 3,000 ERCs of new connections per year.
TECHNICAL MEMO: OVERSIZING POLICY ANALYSIS5Availability and User Impacts for 30M Enlarged Sewer Line Program:The following table presents a summary of the findings of the evaluation and impacts to user feesand availability fees over the current ten (10) year forecast period:C&C Conveyance CostsCounty ResponsibilityAnnual ProgrammaticCosts'Year 1Year 2Year 3Year 4Year 5Year 6Year 7Year 8Year 9Year 10Cumulative IncreasesQuarterly Residential BillImpact at 16,000 GallonsMonthly Bill ImpactOption 1Option 2Option 3 30,000,000100% 30,000,000 30,000,00050% 15,000,000 30,000,00075% 22,500,000AvailabilityFeeIncrease 243.00 243.00 243.00 243.00 243.00 243.00 243.00 243.00 243.00 %0.44%0.44%0.44%0.44%AvailabilityFeeIncrease 121.50 121.50 121.50 121.50 121.50 121.50 121.50 121.50 121.50 %0.22%0.22%0.22%0.22%AvailabilityFeeIncrease 182.25 182.25 182.25 182.25 182.25 182.25 182.25 182.25 182.25 %0.33%0.33%0.33%0.33% 2,430.004.4% 1,215.002.2% 1,822.503.3% 7.52 3.76 5.64 2.51 1.25 1.88Based on the prior table Raftelis analyzed the cumulative cash flow effects of the increase in debtservice and corresponding user and availability fee increases for each option over the ten (10)year forecast period. A summary of the cashflow projections are presented below:Debt Svc Payments'Availability Fee2User Fee Increase10 Year Cashflow EffectsOption 1Option 2( 97,328,057)( 48,664,028) 40,095,000 20,047,500 57,233,057 28,616,528Option 3( 72,996,043) 30,071,250 42,924,7931 Debt service payments assume 30-year financing, 2% issue costs, and 4% interest rate.2 Availability fees assume 3,000 ERCs of new connections per year.
TECHNICAL MEMO: OVERSIZING POLICY ANALYSIS5Availability and User Impacts for 50M Enlarged Sewer Line Program:The following table presents a summary of the findings of the evaluation and impacts to user feesand availability fees over the current ten (10) year forecast period:C&C Conveyance CostsCounty ResponsibilityAnnual ProgrammaticCostsYear 1Year 2Year 3Year 4Year 5Year 6Year 7Year 8Year 9Year 10Cumulative IncreasesQuarterly Residential BillImpact at 16,000 GallonsMonthly Bill ImpactOption 1Option 2Option 3 50,000,000100% 50,000,000 50,000,00050% 25,000,000 50,000,00075% 37,500,000AvailabilityFeeIncrease 405.00 405.00 405.00 405.00 405.00 405.00 405.00 405.00 405.00 %0.74%0.74%0.74%0.74%AvailabilityFeeIncrease 202.50 202.50 202.50 202.50 202.50 202.50 202.50 202.50 202.50 %0.37%0.37%0.37%0.37%AvailabilityFeeIncrease 303.75 303.75 303.75 303.75 303.75 303.75 303.75 303.75 303.75 %0.55%0.55%0.55%0.55% 4,050.007.4% 2,025.003.7% 3,037.505.5% 12.54 6.27 9.40 4.18 2.09 3.13Based on the prior table Raftelis analyzed the cumulative cash flow effects of the increase in debtservice and corresponding user and availability fee increases for each option over the ten (10)year forecast period. A summary of the cashflow projections are presented below:Debt Svc Payments'Availability Fee2User Fee Increase10 Year Cashflow EffectsOption 2Option 1( 81,106,714)( 162,213,428) 33,412,500 66,825,000 47,694,214 95,388,428Option 3( 121,660,071) 50,118,750 71,541,3211 Debt service payments assume 30-year financing, 2% issue costs, and 4% interest rate.2 Availability fees assume 3,000 ERCs of new connections per year.
TECHNICAL MEMO: OVERSIZING POLICY ANALYSISAlternative Oversizing Program Funding:Based on discussions with County staff we evaluated an additional option intended to present theavailability fee increases to recover all programmatic costs from such fees. The basis forconsidering an exclusive cost recovery from availability fees includes: i) developers or new growthare required to pay such fees; and ii) the cost of oversizing results in an extraordinary propertyloss from the early retirement of an asset benefiting existing customers which is directlyattributable to redevelopment and the capacity needs of the developer for their project. In thisscenario the burden of programmatic cost recovery is derived exclusively from developer paidavailability fees.The methodology used to calculate the fee assumes the incremental approach and recognizesthe following key assumptions:1) We have assumed that the County may incur an annual cost of line replacementapproximately 5 million annually based on historical trends in such costs;2) We have assumed that the program would support approximately 3,000 ERCs annually;3) We examined the availability fee increase based on the previously described options andvarying funding responsibility directly from the developer;4) It should be noted that these assumptions are estimates and may vary relative to the actualprogrammatic costs and as such should be reviewed and revised as necessary.Availability Fee Impacts and Considerations for Alternative Oversizing Program Funding:While the availability fee is a fee paid by all developers requesting wastewater service andcapacity reservation, not all new growth requires oversizing infrastructure. Additionally, fundingreplacement of infrastructure capacity that serves existing customers may not provide thenecessary nexus among the cost and benefit to new growth. We would recommend that theCounty seek legal counsel to ensure this option is viable and would not be susceptible to anychallenge from the development community.(Remainder of Page Intentionally Left Blank)
TECHNICAL MEMO: OVERSIZING POLICY ANALYSISThe following table presents a summary of the findings of the evaluation and impacts to availabilityfees over the current ten (10) year forecast period for a 5M program:C&C Conveyance CostsCounty ResponsibilityAnnual earYear12345678910Cumulative IncreasesOption 1Option 2Option 3 5,000,000100% 5,000,000 5,000,00050% 2,500,000 5,000,00075% 3,750,000Availability FeeIncrease 98.30 98.30 98.30 98.30 98.30 98.30 98.30 98.30 98.30 98.30Availability FeeIncrease 49.20 49.20 49.20 49.20 49.20 49.20 49.20 49.20 49.20 49.20Availability FeeIncrease 73.70 73.70 73.70 73.70 73.70 73.70 73.70 73.70 73.70 73.70 983.00 492.00 737.00Based on the prior table Raftelis analyzed the cumulative cash flow effects of the increase in debtservice and corresponding user and availability fee increases for each option over the ten (10)year forecast period. A summary of the cashflow projections are presented below:Debt Svc Payments'Availability Fee210 Year Cashflow EffectsOption 1Option 2( 16,221,343)( 8,110,671) 16,221,343 8,110,671Option 3( 12,166,007) 12,166,0071 Debt service payments assume 30-year financing, 2% issue costs, and 4% interest rate.2 Availability fees assume 3,000 ERCs of new connections per year.(Remainder of Page Intentionally Left Blank)
TECHNICAL MEMO OVERSIZING POLICY ANALYSISThe following table presents a summary of the findings of the evaluation and impacts to user feesand availability fees over the current ten (10) year forecast period for a 15M program:C&C Conveyance CostsCounty ResponsibilityAnnual ProgrammaticCostsYear 1Year 2Year 3Year 4Year 5Year 6Year 7Year 8Year 9Year 10Cumulative IncreasesOption 1Option 2Option 3 15,000,000100% 15,000,000 15,000,00050% 7,500,000 15,000,00075% 11,250,000Availability FeeIncrease 294.93 294.93 294.93 294.93 294.93 294.93 294.93 294.93 294.93 294.93Availability FeeIncrease 147.47 147.47 147.47 147.47 147.47 147.47 147.47 147.47 147.47 147.47Availability FeeIncrease 221.20 221.20 221.20 221.20 221.20 221.20 221.20 221.20 221.20 221.20 2,949.34 1,474.67 2,212.00Based on the prior table Raftelis analyzed the cumulative cash flow effects of the increase in debtservice and corresponding user and availability fee increases for each option over the ten (10)year forecast period. A summary of the cashflow projections are presented below:Debt Svc Payments'Availability Fee210 Year Cashflow EffectsOption 1Option 2( 48,664,028)( 24,332,014) 48,664,028 24,332,014Option 3( 36,498,021) 36,498,0211 Debt service payments assume 30-year financing, 2% issue costs, and 4% interest rate.2 Availability fees assume 3,000 ERCs of new connections per year.(Remainder of Page Intentionally Left Blank)
TECHNICAL MEMO OVERSIZING POLICY ANALYSIS1The following table presents a summary of the findings of the evaluation and impacts to user feesand availability fees over the current ten (10) year forecast period for a 30M program:C&C Conveyance CostsCounty ResponsibilityAnnual ProgrammaticCostsYear 1Year 2Year 3Year 4Year 5Year 6Year 7Year 8Year 9Year 10Cumulative IncreasesOption 1Option 2Option 3 30,000,000100% 30,000,000 30,000,00050% 15,000,000 30,000,00075% 22,500,000Availability FeeIncrease 589.87 589.87 589.87 589.87 589.87 589.87 589.87 589.87 589.87 589.87Availability FeeIncrease 294.93 294.93 294.93 294.93 294.93 294.93 294.93 294.93 294.93 294.93Availability FeeIncrease 442.40 442.40 442.40 442.40 442.40 442.40 442.40 442.40 442.40 442.40 5,898.67 2,949.34 4,424.00Based on the prior table Raftelis analyzed the cumulative cash flow effects of the increase in debtservice and corresponding user and availability fee increases for each option over the ten (10)year forecast period. A summary of the cashflow projections are presented below:Debt Svc Payments'Availability Fee210 Year Cashflow EffectsOption 1Option 2( 97,328,057)( 48,664,028) 97,328,057 48,664,028Option 3( 72,996,043) 72,996,0431 Debt service payments assume 30-year financing, 2% issue costs, and 4% interest rate.2 Availability fees assume 3,000 ERCs of new connections per year.(Remainder of Page Intentionally Left Blank)
TECHNICAL MEMO: OVERSIZING POLICY ANALYSISThe following table presents a summary of the findings of the evaluation and impacts to user feesand availability fees over the current ten (10) year forecast period fora 50M program:C&C Conveyance CostsCounty ResponsibilityAnnual ProgrammaticCostsYear 1Year 2Year 3Year 4Year 5Year 6Year 7Year 8Year 9Year 10Cumulative IncreasesOption 1Option 2Option 3 50,000,000100% 50,000,000 50,000,00050% 25,000,000 50,000,00075% 37,500,000Availability FeeIncrease 983.11 983.11 983.11 983.11 983.11 983.11 983.11 983.11 983.11 983.11Availability FeeIncrease 491.56 491.56 491.56 491.56 491.56 491.56 491.56 491.56 491.56 491.56Availability FeeIncrease 737.33 737.33 737.33 737.33 737.33 737.33 737.33 737.33 737.33 737.33 9,831.12 4,915.56 7,373.34Based on the prior table Raftelis analyzed the cumulative cash flow effects of the increase in debtservice and corresponding user and availability fee increases for each option over the ten (10)year forecast period. A summary of the cashflow projections are presented below:Debt Svc Payments'Availability Fee210 Year Cashflow EffectsOption 1Option 2( 162,213,428)( 81,106,714) 162,213,428 81,106,714Option 3( 121,660,071) 121,660,0711 Debt service payments assume 30-year financing, 2% issue costs, and 4% interest rate.2 Availability fees assume 3,000 ERCs of new connections per year.(Remainder of Page Intentionally Left Blank)
County of Fairfax, VirginiaMEMORANDUMDATE:February 8,2022TO:Board of SupervisorsFROM:Bryan J. Hill, County ExecutivSUBJECT:Sewer Capacity Information RequestOn October 5, 2021, the Board of Supervisors (Board) requested that staff provide informationon sewer line capacity in Fairfax County (County). This is due to recent challenges that haveemerged in the development process regarding capacity constraints and requirements. Theseare associated with the County's existing Sewer Service Policy (SSP), the Sanitary SewerDesign Criteria of the Public Facilities Manual (PFM), and Public Facilities Element of theCounty Comprehensive Plan, which may need to be reevaluated.There is adequate capacity in the existing wastewater collection system to serve existingcustomers. In 2021, the Department of Public Works and Environmental Services (DPWES)performed a planning-level capacity analysis of the County's over 3,100 miles of wastewaterlines. This revealed that while there is adequate capacity to serve existing customers,approximately 1% of existing wastewater lines (-30 miles) may not meet the design "peakingfactor" applied to new development. These potentially inadequate wastewater lines aredispersed throughout the County and not concentrated in one area.As the County trends away from greenfield development and into denser infill development,there is a greater reliance on the County's existing wastewater collection system. Greenfielddevelopment typically has no existing wastewater collection system. Therefore, a new systemmust be built by the developer. On the other hand, infill development connects to an existingwastewater collection system. However, that system may require increased capacity for newinfill development. In addition, it is often more expensive to install infrastructure in an existingbuilt environment, where other utilities may complicate construction.State regulations mandate that the County apply peaking factors to new wastewater linedesigns to ensure adequate capacity exists. When the capacity of a wastewater line is exceeded,sanitary sewer overflows (SS0s) result. Although County peaking factors are at the higher endof surrounding jurisdictions, the benefit is that the County's SSO rate is 3 times lower than thenational median, and the County is recognized by the US Environmental Protection Agency asa mode! system.I The peaking factor is a multiplier used to estimate wastewater flow for peak flow periods.Office of the County Executive12000 Government Center Parkway, Suite 552Fairfax, VA 22035-0066703-324-2531, TTY 711, Fax 703-324-3956www.fairfaxcounty.gov
Board of SupervisorsSewer Capacity Information RequestPage 2 of 3The peaking factors in the PFM currently applied to new wastewater lines are deemedappropriate. In wastewater system design, engineers estimate flow demands by multiplying thebase flow times a peaking factor to account for periods of high flow. The County has updated thePFM over time to apply current industry standards and adjusted wastewater flow estimates basedon published studies to account for increased use of water-saving devices as well as the currentstate of County wastewater infrastructure. An independent review in 2018 used flow meter datato evaluate the PFM guidelines and concluded that the County's existing peaking factors areappropriate and consistent with industry standards. A reduction in the PFM peaking factorsapplied to new development would reduce the margin of safety within the wastewater collectionsystem and increase the probability of SSOs.The current County "growth-pays-for-growth" policy requires developers to provide adequatewastewater capacity for their proposed developments. If there is adequate capacity in the existingwastewater collection system to accommodate the wastewater from a proposed development, noupsizing of the existing system is required. When the additional wastewater for a proposeddevelopment exceeds the existing wastewater line capacity, the new development must upsizethe wastewater system to accommodate the adopted Comprehensive Plan density, as required bythe Board-approved PFM and SSP.From 2016 to 2021, DPWES estimates that more than 90% of developer-led projects were notrequired to upsize existing sewers because the existing system had adequate capacity.Development projects that are required to upsize existing sewers are typically located withinhigh-density Activity Centers. DPWES estimates that from 2016 to 2021, the average annualtotal cost for all developer-led wastewater system upsizing was approximately 3,150,000 peryear. This is in addition to the 86,000,000 annual Capital Improvement Program of Countyfunded projects to increase the capacity of major sew
Capacity Information Request. Staff recommended that the existing sewer reimbursement policy be amended for any sewer lines enlarged by developers. Staff has evaluated several options and is recommending that developers be reimbursed after an enlarged line has been constructed and accepted into the Fairfax County system, as outlined below.
