Transcription
United StatesDepartment ofAgricultureNaturalResourcesConservationServiceIn cooperation withPurdue UniversityAgricultural ExperimentStationSoil Survey ofHarrison County,Indiana
How To Use This Soil SurveyThe detailed soil maps can be useful in planning the use and management of smallareas.To find information about your area of interest, locate that area on the Index to MapSheets. Note the number of the map sheet and go to that sheet.Locate your area of interest on the map sheet. Note the map unit symbols that are inthat area. Go to the Contents, which lists the map units by symbol and name andshows the page where each map unit is described.The Contents shows which table has data on a specific land use for each detailedsoil map unit. Also see the Contents for sections of this publication that may addressyour specific needs.iii
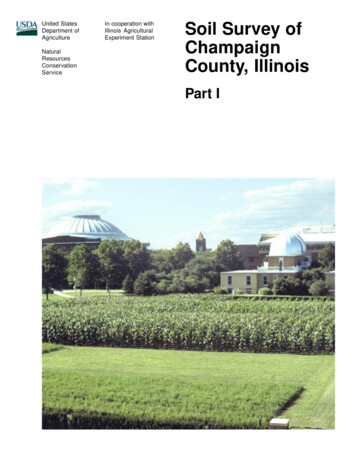
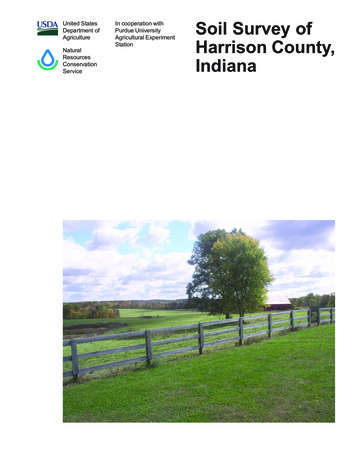
National Cooperative Soil SurveyThis soil survey is a publication of the National Cooperative Soil Survey, a joint effortof the United States Department of Agriculture and other Federal agencies, Stateagencies including the Agricultural Experiment Stations, and local agencies. TheNatural Resources Conservation Service (formerly the Soil Conservation Service) hasleadership for the Federal part of the National Cooperative Soil Survey. This survey wasmade cooperatively by the Natural Resources Conservation Service and the PurdueUniversity Agricultural Experiment Station. It is part of the technical assistancefurnished to the Harrison County Soil and Water Conservation District.Major fieldwork for this soil survey was completed in 2006. Soil names anddescriptions were approved in 2007. Unless otherwise indicated, statements in thispublication refer to conditions in the survey area in 2007. The most current official dataare available on the Internet.Soil maps in this survey may be copied without permission. Enlargement of thesemaps, however, could cause misunderstanding of the detail of mapping. If enlarged,maps do not show the small areas of contrasting soils that could have been shown at alarger scale.Nondiscrimination StatementThe U.S. Department of Agriculture (USDA) prohibits discrimination in all itsprograms and activities on the basis of race, color, national origin, age, disability, andwhere applicable, sex, marital status, familial status, parental status, religion, sexualorientation, genetic information, political beliefs, reprisal, or because all or a part of anindividual’s income is derived from any public assistance program. (Not all prohibitedbases apply to all programs.) Persons with disabilities who require alternative meansfor communication of program information (Braille, large print, audiotape, etc.) shouldcontact USDA’s TARGET Center at (202) 720-2600 (voice and TDD). To file a complaintof discrimination, write to USDA, Director, Office of Civil Rights, 1400 IndependenceAvenue, S.W., Washington, D.C. 20250-9410 or call (800) 795-3272 (voice) or (202)720-6382 (TDD). USDA is an equal opportunity provider and employer.Cover Photo CaptionKarst landscape in an area of Crider silt loam, karst, undulating. Karst landscapesmust be managed carefully to avoid ground-water contamination.Additional information about the Nation’s natural resources is available onlinefrom the Natural Resources Conservation Service at http://www.nrcs.usda.gov.iv
ContentsCover .iHow To Use This Soil Survey . iiiContents . vForeword . xiIntroduction . 1General Nature of the Survey Area . 1How This Survey Was Made . 4Detailed Soil Map Units . 7AeoB2—Alford silt loam, 2 to 6 percent slopes, eroded . 8AeoC2—Alford silt loam, 6 to 12 percent slopes, eroded . 9AgzB—Apalona-Zanesville silt loams, 2 to 6 percent slopes . 9BbhA—Bartle silt loam, 0 to 2 percent slopes . 10BcrAW—Beanblossom silt loam, 1 to 3 percent slopes, occasionally flooded,very brief duration . 11BdoA—Bedford silt loam, 0 to 2 percent slopes . 12BdoB—Bedford silt loam, 2 to 6 percent slopes . 13BkeC2—Bloomfield-Alvin complex, 6 to 15 percent slopes, eroded . 14BuoA—Bromer silt loam, 0 to 2 percent slopes . 15BvsG—Brussels-Rock outcrop complex, 35 to 90 percent slopes, rubbly . 16CbrD2—Caneyville-Haggatt-Knobcreek silt loams, karst, hilly, eroded . 17CbsD3—Caneyville-Haggatt-Knobcreek complex, karst, hilly, severely eroded . 19CbxD4—Caneyville-Haggatt silty clay loams, karst, rolling, very severely eroded,very rocky . 20CcaG—Caneyville-Rock outcrop complex, 25 to 60 percent slopes . 22CtaB—Crider silt loam, karst, undulating . 23CteC2—Crider-Vertrees silt loams, karst, rolling, eroded . 24CtwB—Crider-Bedford-Navilleton silt loams, 2 to 6 percent slopes . 25DeaC2—Deuchars-Apalona-Wellston silt loams, 6 to 12 percent slopes,eroded . 26DeaC3—Deuchars-Apalona-Wellston silt loams, 6 to 12 percent slopes,severely eroded . 28EbhD2—Ebal-Gilpin-Wellston silt loams, 10 to 22 percent slopes, eroded . 30EbhD3—Ebal-Gilpin-Wellston silt loams, 10 to 22 percent slopes, severelyeroded . 31EepA—Elkinsville silt loam, 0 to 2 percent slopes . 33EepB2—Elkinsville silt loam, 2 to 6 percent slopes, eroded . 34EepC2—Elkinsville silt loam, 6 to 12 percent slopes, eroded . 34EepGQ—Elkinsville silt loam, 25 to 60 percent slopes, rarely flooded . 35EesA—Elkinsville-Millstone complex, 0 to 2 percent slopes . 36EesB—Elkinsville-Millstone complex, 2 to 6 percent slopes . 37EesC2—Elkinsville-Millstone complex, 6 to 12 percent slopes, eroded . 38EesFQ—Elkinsville-Millstone complex, 18 to 40 percent slopes, rarely flooded . 39GacAW—Gatchel loam, 0 to 2 percent slopes, occasionally flooded, very briefduration . 40v
GbgB2—Gatton silt loam, 2 to 6 percent slopes, eroded .GbgC2—Gatton silt loam, 6 to 12 percent slopes, eroded .GbgC3—Gatton silt loam, 6 to 12 percent slopes, severely eroded .GfcF—Gilpin-Tipsaw-Ebal complex, 18 to 35 percent slopes, stony .GgbG—Gilwood-Brownstown silt loams, 25 to 75 percent slopes .GmaG—Gnawbone-Kurtz silt loams, 20 to 60 percent slopes .HcaA—Hatfield silt loam, 0 to 2 percent slopes .HcgAH—Haymond silt loam, 0 to 2 percent slopes, frequently flooded, briefduration .HcgAW—Haymond silt loam, 0 to 2 percent slopes, occasionally flooded, verybrief duration .HcpAP—Haymond silt loam, depression, 0 to 2 percent slopes, frequentlyponded, very brief duration .HufAH—Huntington silt loam, 0 to 2 percent slopes, frequently flooded, briefduration .HufAK—Huntington silt loam, 0 to 2 percent slopes, occasionally flooded, briefduration .JoaA—Johnsburg silt loam, 0 to 2 percent slopes .KunAW—Kintner loam, 1 to 3 percent slopes, occasionally flooded, very briefduration .KxkC2—Knobcreek-Navilleton silt loams, 6 to 12 percent slopes, eroded .KxlC3—Knobcreek-Haggatt-Caneyville complex, 6 to 12 percent slopes,severely eroded .KxlE3—Knobcreek-Haggatt-Caneyville complex, 12 to 25 percent slopes,severely eroded .KxmE2—Knobcreek-Haggatt-Caneyville silt loams, 12 to 25 percent slopes,eroded .KxoC2—Knobcreek-Navilleton-Haggatt silt loams, karst, rolling, eroded .KxpD2—Knobcreek-Haggatt-Caneyville silt loams, karst, hilly, eroded .KxrC3—Knobcreek-Navilleton-Haggatt complex, karst, rolling, severelyeroded .KxsD3—Knobcreek-Haggatt-Caneyville complex, karst, hilly, severely eroded .KxtC2—Knobcreek-Haggatt-Caneyville silt loams, karst, rolling, eroded .KxtC3—Knobcreek-Haggatt-Caneyville complex, karst, rolling, severelyeroded .LaaA—Laconia silt loam, 0 to 1 percent slopes .LpoAK—Lindside silt loam, 0 to 2 percent slopes, occasionally flooded, briefduration .LpoAQ—Lindside silt loam, 0 to 2 percent slopes, rarely flooded .McnGQ—Markland silt loam, 18 to 50 percent slopes, rarely flooded .MdlD2—Markland silt loam, 6 to 18 percent slopes, eroded .MdwD3—Markland silty clay loam, 6 to 18 percent slopes, severely eroded .MhuA—McGary silt loam, 0 to 2 percent slopes .NbhAK—Newark silt loam, 0 to 2 percent slopes, occasionally flooded, briefduration 66768696970717272
NbhAQ—Newark silt loam, 0 to 2 percent slopes, rarely flooded . 73NprAQ—Nolin silt loam, 0 to 2 percent slopes, rarely flooded . 74Omz—Orthents, earthen dam . 74PcrA—Pekin silt loam, 0 to 2 percent slopes . 75PcrB2—Pekin silt loam, 2 to 6 percent slopes, eroded . 75PhwB2—Percell silt loam, 2 to 6 percent slopes, eroded . 76Pml—Pits, quarry . 77Ppu—Pits, sand and gravel . 77RmcE—Riney loam, 12 to 35 percent slopes . 78ScbA—Sciotoville silt loam, 0 to 2 percent slopes . 78ScbB2—Sciotoville silt loam, 2 to 6 percent slopes, eroded . 79SfyB—Shircliff silt loam, 0 to 2 percent slopes . 80Uaa—Udorthents, cut and filled . 80UekAQ—Urban land-Elkinsville-Haymond complex, 0 to 6 percent slopes, rarelyflooded . 81UflC—Urban land-Crider-Vertrees complex, karst, rolling . 82UnsB—Urban land-Udarents, clayey substratum complex, hills, 2 to 12 percentslopes . 83Usl—Udorthents, rubbish . 84VcaC3—Vertrees-Crider-Caneyville complex, karst, rolling, severely eroded . 84VcbD2—Vertrees-Crider-Caneyville silt loams, karst, hilly, eroded . 86VccD3—Vertrees-Haggatt-Caneyville complex, karst, hilly, severely eroded . 88W—Water . 90WbkAP—Wilbur-Newark silt loams, depression, 0 to 2 percent slopes,frequently ponded, very brief duration . 90WycAQ—Woodmere silt loam, 0 to 3 percent slopes, rarely flooded . 91Use and Management of the Soils . 93Interpretive Ratings . 93Rating Class Terms . 93Numerical Ratings . 93Crops and Pasture . 94Limitations and Hazards Affecting Cropland . 98Limitations and Hazards Affecting Pastureland . 99Yields per Acre . 101Land Capability Classification . 102Prime Farmland . 103Hydric Soils . 104Windbreaks and Environmental Plantings . 105Forestland . 105Forestland Productivity . 107Forestland Management . 107Recreational Development . 109Wildlife Habitat . 111Engineering . 112Building Site Development . 113vii
Sanitary Facilities . 114Construction Materials . 116Soil Properties . 119Engineering Index Properties . 119Physical Properties of the Soils . 120Erosion Properties of the Soils . 122Chemical Properties of the Soils . 122Water Features . 123Soil Features . 124Classification of the Soils . 127Soil Series and Their Morphology . 127Alford Series . 128Alvin Series . 129Apalona Series . 130Bartle Series . 133Beanblossom Series . 135Bedford Series . 136Bloomfield Series . 139Bromer Series . 140Brownstown Series . 141Brussels Series . 142Caneyville Series . 143Crider Series . 145Deuchars Series . 148Ebal Series . 150Elkinsville Series . 152Gatchel Series . 153Gatton Series . 154Gilpin Series . 156Gilwood Series . 157Gnawbone Series . 159Haggatt Series . 160Hatfield Series . 162Haymond Series . 164Huntington Series . 165Johnsburg Series . 166Kintner Series . 168Knobcreek Series . 170Kurtz Series . 172Laconia Series . 174Lindside Series . 175Markland Series . 176McGary Series . 178Millstone Series . 179viii
Navilleton Series . 181Newark Series . 182Nolin Series . 184Pekin Series . 185Percell Series . 187Riney Series . 188Sciotoville Series . 190Shircliff Series . 191Tipsaw Series . 193Vertrees Series . 194Wellston Series . 197Wilbur Series . 199Woodmere Series . 200Zanesville Series . 202Formation of the Soils . 205Factors of Soil Formation . 205Processes of Soil Formation . 208References . 211Glossary . 215Tables . 235Table 1.—Temperature and Precipitation . 236Table 2.—Freeze Dates in Spring and Fall . 237Table 3.—Growing Season . 237Table 4.—Acreage and Proportionate Extent of the Soils . 238Table 5.—Main Cropland and Pastureland Limitations and Hazards . 241Table 6.—Land Capability and Yields per Acre of Crops and Pasture . 253Table 7.—Prime Farmland . 258Table 8.—Windbreaks and Environmental Plantings . 260Table 9.—Forest Productivity . 294Table 10.—Forestland Management, Part I . 337Table 10.—Forestland Management, Part II . 350Table 10.—Forestland Management, Part III . 362Table 10.—Forestland Management, Part IV . 373Table 11.—Recreational Development, Part I . 381Table 11.—Recreational Development, Part II . 394Table 12.—Wildlife Habitat . 404Table 13.—Building Site Development, Part I . 415Table 13.—Building Site Development, Part II . 428Table 14.—Sanitary Facilities, Part I . 445Table 14.—Sanitary Facilities, Part II . 461Table 15.—Construction Materials, Part I . 475Table 15.—Construction Materials, Part II . 486Table 16.—Engineering Index Properties . 503Table 17.—Physical Properties of the Soils . 540ix
Table 18.—Erosion Properties of the Soils .Table 19.—Chemical Properties of the Soils .Table 20.—Water Features .Table 21.—Soil Features .Table 22.—Classification of the Soils .Issued 2009x557571585606614
ForewordSoil surveys contain information that affects land use planning in survey areas. Theyinclude predictions of soil behavior for selected land uses. The surveys highlight soillimitations, improvements needed to overcome the limitations, and the impact ofselected land uses on the environment.Soil surveys are designed for many different users. Farmers, foresters, andagronomists can use the surveys to evaluate the potential of the soil and themanagement needed for maximum food and fiber production. Planners, communityofficials, engineers, developers, builders, and home buyers can use the surveys toplan land use, select sites for construction, and identify special practices needed toensure proper performance. Conservationists, teachers, students, and specialists inrecreation, wildlife management, waste disposal, and pollution control can use thesurveys to help them understand, protect, and enhance the environment.Various land use regulations of Federal, State, and local governments may imposespecial restrictions on land use or land treatment. The information in this report isintended to identify soil properties that are used in making various land use or landtreatment decisions. Statements made in this report are intended to help the landusers identify and reduce the effects of soil limitations on various land uses. Thelandowner or user is responsible for identifying and complying with existing laws andregulations.Great differences in soil properties can occur within short distances. Some soils areseasonally wet or subject to flooding. Some are too unstable to be used as afoundation for buildings or roads. Clayey or wet soils are poorly suited to use as septictank absorption fields. A high water table makes a soil poorly suited to basements orunderground installations.These and many other soil properties that affect land use are described in this soilsurvey. The location of each soil is shown on the detailed soil maps. Each soil in thesurvey area is described, and information on specific uses is given. Help in using thispublication and additional information are available at the local office of the NaturalResources Conservation Service or the Cooperative Extension Service.Jane HardistyState ConservationistNatural Resources Conservation Servicexi
Soil Survey ofHarrison County, IndianaBy Steven W. Neyhouse, Sr., Byron G. Nagel, Gary R. Struben, and Steven Blanford,Natural Resources Conservation ServiceOriginal fieldwork by John M. Robbins, Jr., Daniel A. Donaldson, William D. Hosteter,Arturo Rivera, and Robert E. Modesitt, Soil Conservation ServiceFieldwork by Steven W. Neyhouse, Sr., Dena L. Marshall, George
are available on the Internet. Soil maps in this survey may be copied without permission. Enlargement of these maps, however, could cause misunderstanding of the detail of mapping. If enlarged, maps do not show the small areas of contrasting soils that could have been shown at a larger scale. Nondiscrimination Statement